MCQ testing in higher education Yes there are


 evaluated 2770 MCQs")

 � the total number of items answered correctly indicates the")
 models � predicts likelihood that an examinee with a specific")

 � IRT requires")
 How People Learn")
 ◦ (1) cognitive processing (6 items), (2) forgetting")


")


. Evaluating the quality")
. Assessing")
- Slides: 26
MCQ testing in higher education: Yes, there are bad items and invalid scores —A case study identifying solutions Presentation to Tillämpad Utbildningsvetenskap, Umeå Universitet September 2017 Prof. dr. Gavin T. L. Brown
Multiple-choice questions � Use in higher education varies by faculty & location ◦ High in Medicine; low in UK � Efficient coverage & accurate scoring � BUT instructor written items are problematic ◦ Leads to invalid conclusions about who knows what � Currently, ◦ ◦ evaluation usually depends on ‘qualitative’ judgment content guidelines, style and format, writing the stem, writing options
Statistical evaluation � Bad characteristics ◦ Too difficult or easy, ◦ too easy to guess at, ◦ no discrimination between high and low performing learners � Commonplace in high-stakes testing programs ◦ International comparisons: PISA, TIMSS, PIRLS ◦ Entrance exams: GRE, Swe. SAT, ACT, GMAT, LSAT ◦ Language competency: TOEFL, TSE � But not in Higher Education ◦ Does it matter? ◦ Can we just trust the content experts to write good items?
MCQs in higher education � Tarrant, Knierim, Hayes, and Ware (2006) evaluated 2770 MCQs used over a five-year period from 2001 to 2005 ◦ nearly half (46%) of the items were bad because they violated item-writing guidelines. � Similar results reported across different disciplines ◦ (Downing, 2005; Ellsworth, Dunnell, & Duell 1990; Hansen & Dexter, 1997; Masters et al. , 2001). � negative impact on students’ performance and achievement ◦ (Clifton & Schriner, 2010; Downing, 2005; Tarrant, Knierim, Hayes, & Ware, 2006). � MCQs do not assess higher-order thinking and focus too much on recall of knowledge ◦ (Downing, 2005; Malau-Aduli & Zimitat, 2012; Popham, 2011; Tarrant, Knierim, Hayes, & Ware, 2006; Walsh & Seldomridge, 2006). � low selection rates for wrong answers ◦ up to nearly half of all items (Haladyna and Downing, 1993), ◦ between 30 and 40% of all items (Tarrant et al. , 2009), and ◦ as many as 75% (Hingorjo and Jaleel, 2012).
Why does it matter? � Leads to inappropriate grades and poor signals about student ability and negative impact on consequent decisions ◦ pass-fail, ◦ graduation, ◦ access to scholarship, etc. � Does a high score really mean the person is good? And vice versa. � Is it true if the test items are poor quality?
Classical test theory (CTT) � the total number of items answered correctly indicates the examinee’s level of ability or knowledge � Bad items are ◦ too easy (p>. 80) or too hard (p<. 20) ◦ weak correlation with total score; point-biserial correlation (r <. 20) ◦ Infrequent selection of distractors (<5% of test-takers) suggests inefficient pb ◦ Low internal consistency of items to each other (Cronbach α<. 70) � Sufficient statistics to evaluate test item quality
Item response theory (IRT) models � predicts likelihood that an examinee with a specific ability level will correctly answer a specific item by defining the examinee’s ability in relation to the item characteristics � person’s total score or ability estimated using a probabilistic formula based on the dual properties of the item and the testtaker’s performance ◦ probability of answering correctly has an S or ogive shape � Score is adjusted by how hard the items correctly answered were; not how many were right (CTT)
IRT: 3 models difficulty at p=. 50 � Line 3 � Item ◦ 1 PL, Rasch (no guessing, all items have same slope); statistically non-significant chi-square values (i. e. , p ≥ 0. 05) � Line 2 � Line 1 ◦ 2 PL (no guessing, different slopes); discrimination >0. 19 ◦ 3 PL (guessing, varying slopes); 4 options chance <0. 25
Sample size � CTT can work with small N (200 +) � IRT requires big N (>500) ◦ But >300 ok if at least 30 test questions ◦ 3 PL allows the possibility of guessing, but requires large N (>1000) � Challenge for operational testing in HE (big classes exist but they are few in number) � Fit of IRT model to data can be determined ◦ Smaller AIC value indicates better fit
This study � Research intensive university in NZ � Educ 121(G) How People Learn ◦ 2 * 50 -item MCQ (Mid-term + Final) worth 50% of total grade ◦ Operational data, secondary anonymised analysis � 395 students enrolled ◦ 372 took both tests and had final grade ◦ No further data about participants � Analysis with ‘ltm’ package in R
Test content � Mid-term (5 lectures) ◦ (1) cognitive processing (6 items), (2) forgetting (8 items), (3) general learning theory (5 items), (4) memory (8 items), (5) meta-cognition (10 items), (6) retrieval (7 items), and (7) schema (6 items). � Final exam (5 lectures) ◦ 10 items each for: (1) motivation, (2) approaches to learning, (3) problem solving, (4) social structure, and (5) behaviorism or observational learning � All 4 option MCQ � Standard invigilated administration
Test dimensionality � confirmatory factor analysis of a single factor with 50 items using the weighted least square estimator with robust standard errors and mean- and variance- adjusted χ2 test statistic (MPLUS) ◦ Midterm test (χ2 = 4213. 62, df = 1175, χ2/df = 3. 586, p = 0. 06; RMSEA = 0. 083; CFI = 0. 934; WRMR = 2. 394) ◦ Final exam (χ2 = 1309. 05, df = 1175, χ2/df = 1. 114, p = 0. 29; RMSEA = 0. 017; CFI = 0. 936; WRMR = 0. 982). � Plausible Final unidimensional Midterm; strong unidimensional
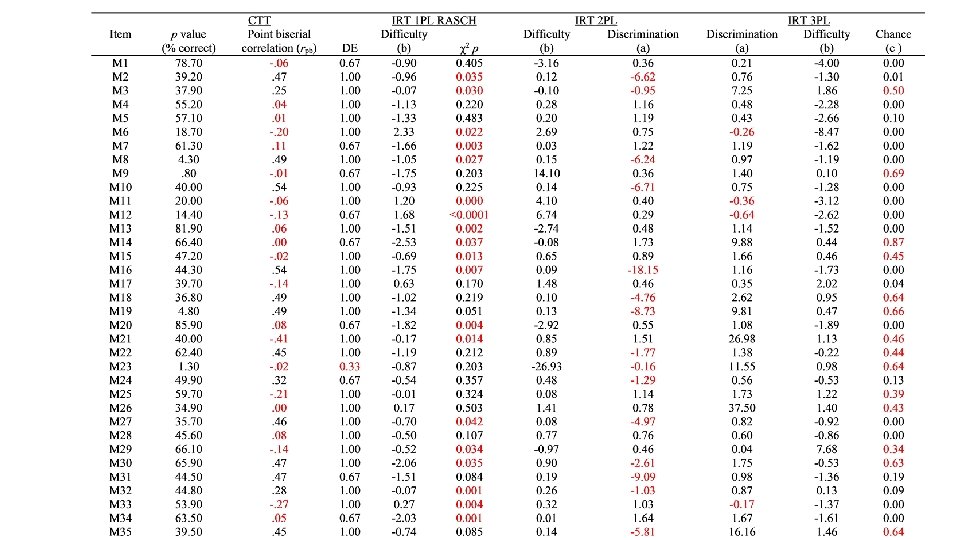
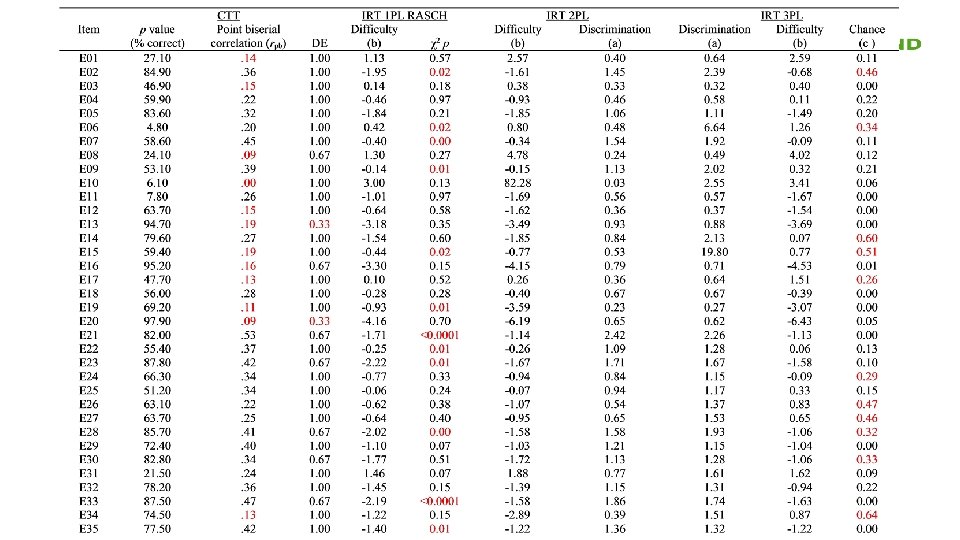
Item analysis results BAD=Rasch � Poor=Raw � OK=3 PL Midterm � Good=CTT, 2 PL, & 3 PL Final �
Which IRT model? AIC values by model Test 1 PL 2 PL 3 PL Midterm 19620. 39 17653. 32 19052. 00 Final 18889. 88 18546. 93 18578. 89 Mid-term 2 PL Final 2 PL
Grade impact minimum standard of κ > 0. 40 to indicate that the observed agreement is greater than might occur by chance
Summary � The inclusion of poor quality items had a small but critical impact on students’ overall course grades, especially in terms of pass/fail decisions. � Using a statistical model approach to removing items with unacceptable characteristics made a difference to course performance in a way that benefited a small number of students and overall made the course appear equally successful as the official raw score approach.
Which Model? � 3 PL logically superior but not empirically ◦ Small N? � Rasch definitely deficient � CTT similar to 2 PL ◦ But … � Impact on instructors. ◦ Mid-term: raw scores 58% (217 of 375) students failed ◦ Under IRT 2 PL: 38% (144 students) would have failed
Benefit of IRT � two students (i. e. , AUID 153 and AUID 332) ◦ Raw score =44% (15 of 34 items) final exam; unsatisfactory grade (D) ◦ After using the IRT 2 PL method, student AUID 153 would get +4 points moving to “C” (i. e. , satisfactory), while student AUID 332 would get -0. 6 points resulting in grade “D−” (i. e. , extremely poor). ◦ Student AUID 332 answered fewer hard items correctly relative to AUID 153 but got the same number of items correct. ◦ Treating items of different difficulty as if they have the same information about quality of performance would generate different conclusions.
So what to do? �A ◦ ◦ score analysis engine Link items to test analysis to locate bad items Show course administrator Do you accept deletion & recalculation? But this creates a score centered on ZERO with SD=1. 00 Item Status 1 Good 2 Good 3 Fair 4 Poor 5 Poor 6 Good 7 Good 8 Fair 9 Good 10 Poor
Standard Setting � This is the distribution of items to people ◦ Where do you want the following boundaries? �Pass-fail (C-) �B�A- � The system then converts scores to official grades
To be resolved � Can system be built and communicate effectively to endusers? � Will instructors & students accept that their RAW scores are converted through this 2 step process? ◦ It is what we do in any standardised test system
Conclusion Every institution that uses MCQs needs to replicate this study ◦ highly likely that specific exams or tests will not meet normal requirements. ◦ credibility of assessment is necessary, especially if there is a tendency to be litigious about grading or testing (Brookhart, 2010). ◦ lack of quality assurance process at the course or department level poses a significant reputational risk to the institution. ◦ Use of IRT item analysis has a potential beneficial impact on overall course grades and number of students passing. ◦ More informative feedback to students and instructors might be generated by giving grades derived from item difficulty. ◦ more commitment and effort is needed to meet professional obligations.
source � Brown, G. T. L. , & Abdulnabi, H. (2017). Evaluating the quality of higher education instructor-constructed multiple-choice tests: Impact on student grades. Frontiers in Education: Assessment, Testing, & Applied Measurement, 2(24) doi: 10. 3389/feduc. 2017. 00024
references � � � Clifton, S. L. , and Schriner, C. L. (2010). Assessing the quality of multiple-choice test items. Nurse Educ. 35, 12– 16. doi: 10. 1097/NNE. 0 b 013 e 3181 c 41 fa 3 Downing, S. M. (2005). The effects of violating standard item-writing principles on tests and students: the consequences of using flawed test items on achieve-ment examinations in medical education. Adv. Health Sci. Educ. 10, 133– 143. doi: 10. 1007/s 10459 -004 -4019 -5 Ellsworth, R. A. , Dunnell, P. , and Duell, O. K. (1990). Multiple-choice test items: what are textbook authors telling teachers? J. Educ. Res. 83, 289– 293. doi: 10. 1080/ 00220671. 1990. 10885972 Haladyna, T. M. , and Downing, S. M. (1993). How many options is enough for a multiple-choice test item? Educ. Psychol. Meas. 53, 999– 1010. doi: 10. 1177/001 3164493053004013 Hansen, J. D. , and Dexter, L. (1997). Quality multiple-choice test questions: item-writing guidelines and an analysis of auditing test banks. J. Educ. Bus. 73, 94– 97. doi: 10. 1080/08832329709601623 Hingorjo, M. R. , and Jaleel, F. (2012). Analysis of one-best MCQs: the difficulty index, discrimination index and distractor efficiency. J. Pak. Med. Assoc. 62, 142– 147. Malau-Aduli, B. S. , and Zimitat, C. (2012). Peer review improves the quality of MCQ examinations. Assess. Eval. High. Educ. 37, 919– 931. doi: 10. 1080/0260 2938. 2011. 586991 Masters, J. C. , Hulsmeyer, B. S. , Pike, M. E. , Leichty, K. , Miller, M. T. , and Verst, A. L. (2001). Assessment of multiple-choice questions in selected test banks accompanying text books used in nursing education. J. Nurs. Educ. 40, 25– 32. doi: 10. 3928/0148 -483420010101 -07 Popham, W. J. (2011). Classroom Assessment: What Teachers Need to Know. Boston, MA: Pearson. Tarrant, M. , Knierim, A. , Hayes, S. K. , and Ware, J. (2006). The frequency of item writing flaws in multiple-choice questions used in high stakes nursing assess-ments. Nurs. Educ. Pract. 6, 354– 363. doi: 10. 1016/j. nepr. 2006. 07. 002 Tarrant, M. , Ware, J. , and Mohammed, A. M. (2009). An assessment of functioning and non-functioning distractors in multiple-choice questions: a descriptive analysis. BMC Med. Educ. 9: 40. doi: 10. 1186/1472 -6920 -9 -40 Walsh, C. M. , and Seldomridge, L. A. (2006). Critical thinking: back to square two. J. Nurs. Educ. 45, 212– 219.