MCB Exam III Review Ji Woong Park December

MCB Exam III Review Ji Woong Park December 13 th, 2014

Material Coverage • My review covers 45 points. It’s lectures by Stewart, Huettner, Weihl, Amarasinghe, and Fremont. • Due to the diverse range of topics (cancer to crystallography), you may need to use slides not in the review to help your understanding. • But, the exam questions will be based on the review slides. There will be, however, some questions that require solid understanding/application to answer them (hence, the above point) • Previous years’ exams will be helpful but it’s incorrect to assume they will be like Exam II.

Terms To Know for “Application” Questions • • RT-q. PCR/RNAi/Knockout Gene or Mice Western Blot/IP/Co-IP Transfection/Infection Electrophysiology Mass Spec/NMR/Crystallography Site-Directed Mutagenesis Inhibitors/Dominant Negatives Fluorescence/Viability/Toxicity Assays

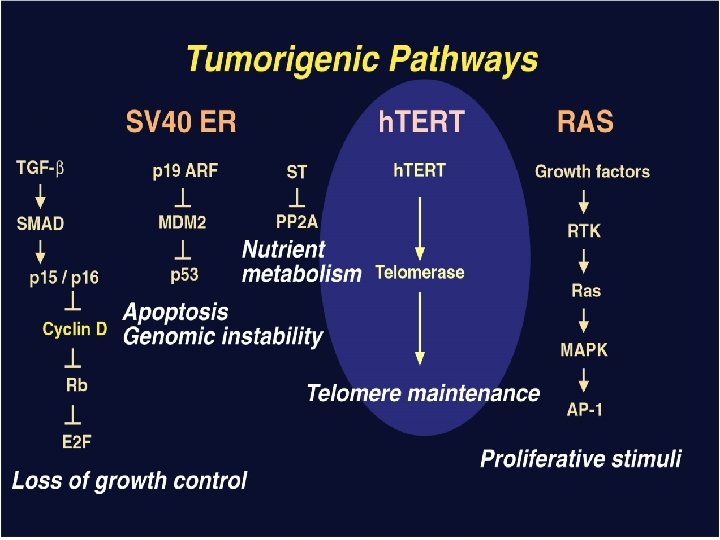
Telomere Function distinguishes between the chromosome end a double strand break protects the chromosome from end-to-end fusions

An emerging paradigm: the telomere complex does not exclude DNA surveillance, repair and replication machinery; rather it directs, modulates and specializes the activities of these proteins to ensure high fidelity replication and telomere stability TRF 1 TRF 2 Old view TRF 1 TIN 2 TPP 1 POT 1 TRF 2 RAP 1 DNA repair machinery New view DNA repair/replication machinery

The “telomere” hypothesis Telomere Length Population Doubling Senescence 1 2 3 4 Time 5 6

The telomere hypothesis p 53 Rb Telomere Length Stop Time Senescence

The telomere hypothesis Telomere Length p 53 Rb Continued proliferation Crisis telomere dysfunction genetic catastrophe cell death Time

Telomerase adds telomeric repeats to the 3’ termini of the chromosome -only the catalytic (h. TERT) and RNA (h. TR) components are required for activity in vitro h. TERT h. TR CAAUCCCAAUC

The telomere hypothesis Telomere Length ALT Stop Senescence p 53 Rb Crisis h. TERT 1 in ~107 Stable telomere maintenance Time

Telomere Length The telomere hypothesis ALT Stop Crisis h. TERT 1 in ~107 Time

ALT Telomerase +

Telomerase allows ALT cells to form tumors h. TERT H-ras TUMORS GM 847 Immortal Expresses SV 40 Early region Lacks telomerase Stewart et al 2002

Extra-telomeric functions of h. TERT Overexpression of m. TERT in murine models increases tumor rates in aged mice Overexpression of h. TERT results in resistance to apoptosis Ectopic expression of m. TERT in skin results “hairy” mice, increased stem cell pool Telomerase is favored over ALT in human tumors h. TERT expression is required in normal fibroblasts to avoid senescence

Time/Stress Senescence evasion Senescence Stromal Promotion Normal ECM Epithelial cell Premalignant Altered ECM Endothelial cell Preneoplastic cell Tumor Young fibroblast Senescent fibroblast Cancer cell Immune cell Senescent epithelial cell
")
For additional reading (highly recommend)

Types of Stem Cells Embryonic – from the inner cell mass of preimplantation embryos, prior to formation of the 3 germ layers (ectoderm, mesoderm, endoderm) Somatic – undifferentiated cells found in specific locations in “mature” tissues i. PS cells – induced pluripotent stem cells generated by reprogramming differentiated cells (or cell nuclei, i. e. therapeutic cloning)
 – deterministic")
Reprogramming • SCNT – somatic cell nuclear transfer (reproductive and therapeutic cloning) – deterministic and fairly rapid • i. PS – induced pluripotent stem cells – slow and stochastic (until recently) • Transdifferentiation – conversion of one terminally differentiated cell type into another without dedifferentiation to an immature phenotype. Must rule out cell fusion or other explanations.

Generating i. PS cells • Express transcription factors: Oct 3/4, Sox 2, Klf 4 and c-Myc (OSKM) Oct 3/4, Sox 2, Nanog and Lin 28 • Initial de-differentiation and proliferation (day 1 -3, enhanced by Myc); histone modification and chromatin reorganization • 2 nd wave of gene expression - stem cell and development related genes (day 9 -12); DNA demethylation and X reactivation OR

Transdifferentiation • Conversion from one differentiated cell type to another without evident de-differentiation and re-differentiation • Must not be confused by cell fusion or selection for rare pluripotent cells in the source material. • Induced by expression of transcription factors and micro. RNAs

Protein Degradation in the Cell Ub Autophagy Nucleus Aggresome Ub UPS Ub Ub Endocytosis

Protein Degradation § Ubiquitin/Proteasome Pathway 80 -90% Most intracellular proteins • Lysosomal processes 10 -20% Extracellular proteins Cell organelles Some intracellular proteins

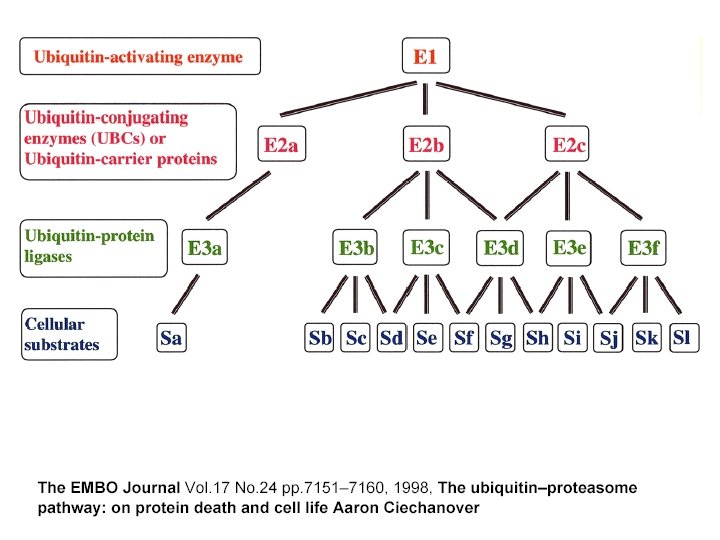
UBIQUITIN Ø Small peptide that is a “TAG” Ø 76 amino acids Ø C-terminal glycine - isopeptide bond with the e-amino group of lysine residues on the substrate Ø Attached as monoubiquitin or polyubiquitin chains G K

Ubiquitination of proteins is a FOUR-step process Ø First, Ubiquitin is activated by forming a link to “enzyme 1” (E 1). Ø Then, ubiquitin is transferred to one of several types of “enzyme 2” (E 2). Ø Then, “enzyme 3” (E 3) catalizes the transfer of ubiquitin from E 2 to a Lys e-amino group of the “condemned” protein. Ø Lastly, molecules of Ubiquitin are commonly conjugated to the protein to be degraded by E 3 s & E 4 s AMP

The proteasomal DUB Usp 14 impairs protein degradation Lee, BH et al Nature 467: 179 -84 2010

Autophagy • Lysosomal degradation of proteins and organelles • Occurs via three routes – Macroautophagy – Microautophagy (direct uptake of cellular debris via the lysosome) – Chaperone mediated autophagy (selective import of substrates via Hsc 70 and Lamp 2 a)

Selective Autophagy • • • Aggregaphagy– p 62/SQSTM 1, Nbr 1 Mitophagy – Parkin, Nix Reticulophagy – endoplasmic reticulum Ribophagy – translating ribosomes Xenophagy – e. g. Salmonella via optineurin Lipophagy – autophagy mediated lipolysis • Performed by an expanding group of ubiquitin adaptors

Rapamycin as an inducer of autophagy �Immunosuppressant used to treat transplant rejection �Inhibits the m. TOR pathway �m. TOR integrates extrinsic growth signals and cellular nutrient status and energy state �Active m. TOR �Protein synthesis and cell growth �Inactive m. TOR (or rapamycin treatment) �Inhibition of protein synthesis and increased autophagic degradation of protein

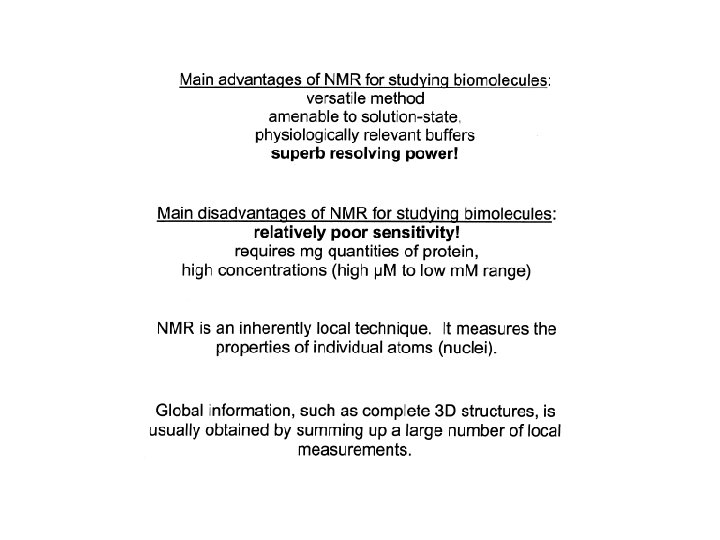
Protein Structures from an NMR Perspective Analyzing NMR Data is a Non-Trivial Task! there is an abundance of data that needs to be interpreted X Not A Direct Path! Interpreting NMR Data Requires Making Informed “Guesses” to Move Toward the “Correct” Fold Distance from Correct Structure Initial rapid convergence to approximate correct fold Correct structure NMR Data Analysis Iterative “guesses” allow “correct” fold to emerge

Protein Structure Determination by NMR • Stage I—Sequence specific resonance assignment • State II – Conformational restraints • Stage III – Calculate and refine structure

Why use deuteration? • What are the advantages? • What are the disadvantages?
 - distance constraint 4.")
NMR Structure Determination NOE - a through space correlation (<5Å) - distance constraint 4. 1Å 2. 9Å Coupling Constant (J) - through bond correlation J - dihedral angle constraint Chemical Shift - very sensitive to local changes in environment - dihedral angle constraint Dipolar coupling constants (D) - bond vector orientation relative to magnetic field - alignment with bicelles or viruses NH C H D NH

Analysis of the Quality of NMR Protein Structures Is the “Average” NMR Structure a Real Structure? • No-it is a distorted structure level of distortions depends on the similarity between the structures in the ensemble Ø provides a means to measure the variability in atom positions between an ensemble of structures Expanded View of an “Average” Structure Ø Some very long, stretched bonds Position of atoms are so scrambled the graphics program does not know which atoms to draw bonds between Some regions of the structure can appear relatively normal

An 7 -step program for protein structure determination by x-ray crystallography 1. Produce monodisperse protein either alone or as relevant complexes 2. Grow and characterize crystals 3. Collect X-ray diffraction data 4. Solve the phase problem either experimentally or computationally 5. Build and refine an atomic model using the electron density map 6. Validation: How do you know if a crystal structure is right? 7. Develop structure-based hypothesis

1. Produce monodisperse protein either alone or as relevant complexes Methods to determine protein purity, heterogeneity, and monodispersity § Gel electrophoresis (native, isoelectric focusing, and SDS-PAGE) § Size exclusion chromatography § Dynamic light scattering http: //www. protein-solutions. com/ § Circular Dichroism Spectroscopy http: //www-structure. llnl. gov/cd/cdtutorial. htm Characterize your protein using a number of biophysical methods Establish the binding stoichiometry of interacting partners

2. Grow and characterize crystals §Hanging Drop vapor diffusion §Sitting drop, dialysis, or under oil §Macro-seeding or micro-seeding §Sparse matrix screening methods §Random thinking processes, talisman, and luck The optimum conditions for crystal nucleation are not necessarily the optimum for diffraction-quality crystal growth Hanging Drop Sitting drop Commercial screening kits available from http: //www. hamptonresearch. com; http: //www. emeraldbiostructures. com Space Group P 21 4 M 3 /ASU diffraction >2. 3Å 14. 4% Peg 6 K Na. Cacodylate p. H 7. 0 200 m. M Ca. Cl 2 Space Group C 2 2 M 3 /ASU diffraction >2. 1Å 18% Peg 4 K Malic Acid/Imidazole p. H 5. 1 100 m. M Ca. Cl 2 Space Group P 3121 3 M 3 + 3 MCP-1/ASU diffraction > 2. 3Å 18% Peg 4 K Na. Acetate p. H 4. 1 100 m. M Mg. Cl 2

No Xtals? Decrease protein heterogeneity § Remove purification tags and other artifacts of protein production § Remove carbohydrate residues or consensus sites (i. e. , N-x-S/T) § Determine domain boundaries by limited proteolysis followed by mass spectrometry or amino-terminal sequencing. Make new expression constructs if necessary. § Think about the biochemistry of the system! Does your protein have cofactors, accessory proteins, or interacting partners to prepare as complexes? Is their an inhibitor available? Are kinases or phosphatases available that will allow for the preparation of a homogeneous sample? § Get a better talisman

3. Collect X-ray diffraction data §Initiate experiments using home-source x-ray generator and detector §Determine liquid nitrogen cryo-protection conditions to reduce crystal decay §While home x-rays are sufficient for some questions, synchrotron radiation is preferred §Anywhere from one to hundreds of crystals and diffraction experiments may be required Argonne National Laboratory Structural Biology Center beamline. ID 19 at the Advanced Photon Source http: //www. sbc. anl. gov

4. Solve the phase problem either experimentally or computationally §Structure factor equation: §By Fourier transform we can obtain the electron density. We know the structure factor amplitudes after successful data collection. Unfortunately, conventional x-ray diffraction doesn’t allow for direct phase measurement. This is know as the crystallographic phase problem. §Luckily, there a few tricks that can be used to obtain estimates of the phase (h, k, l) Experimental Phasing Methods §MIR - multiple isomorphous replacement - need heavy atom incorporation § MAD - multiple anomalous dispersion- typically done with Se. Met replacement §MIRAS - multiple isomorphous replacement with anomalous signal §SIRAS - single isomorphous replacement with anomalous signal Computational Methods §MR - molecular replacement - need related structure §Direct and Ab Initio methods - not yet useful for most protein crystals

MAD phasing statistics for the AP-2 -appendage

5. Build an atomic model using the electron density map Electron density for the AP-2 appendage Initial bones trace for the AP-2 appendage Final trace for the AP-2 appendage

The resolution of the electron-density map and the amount of detail that can be seen Resolution Structural Features Observed 5. 0 Å 3. 5 Å 3. 0 Å 2. 8 Å 2. 5 Å Overall shape of the molecule Ca trace Side chains Carbonyl oxygens (bulges) Side chain well resolved, Peptide bond plane resolved Holes in Phe, Tyr rings Current limit for best protein crystals 1. 5 Å 0. 8 Å

6. Validation: How do you know if a crystal structure is right? The R-factor R = S(|Fo-Fc|)/S(Fo) where Fo is the observed structure factor amplitude and Fc is calculated using the atomic model. R-free An unbiased, cross-validation of the R-factor. The R-free value is calculated with typically 5 -10% of the observed reflections which are set aside from atomic refinement calculations. Main-chain torsions: the Ramachandran plot Geometric Distortions in bond lengths and angles Favorable van der Waals packing interactions Chemical environment of individual amino acids Location of insertion and deletion positions in related sequences

7. Develop structure-based hypothesis Structure-Based Mutagenesis of the -appendage

Selection of E 16 specific epitope variants of DIII Yeast library of DIII variants created by error prone PCR E -DIII Pooled DIII m. Abs E 16 staining DIII mutations at Ser 306, Lys 307, Thr. E 330 and Thr 332 significantly diminish E 16 binding

GOOD LUCK – Interview season is coming!
- Slides: 49