
MBA 290 ADVANCED STRATEGIC MANAGEMENT Professor Stanley Han

MBA 290: ADVANCED STRATEGIC MANAGEMENT Professor Stanley Han College of Business Administration hans@csus. edu 1
Course Overview: Objectives To acquire familiarity with the principal concepts, frameworks and techniques of strategic management. l To gain expertise in applying these concepts, frameworks and techniques in order to understand the reasons for good or bad performance by an enterprise, generate strategy options for an enterprise, assess available options under conditions of imperfect knowledge, select the most appropriate strategy, recommend the best means of implementing the chosen strategy. l 2
Course Overview: Objectives (cont’d) To integrate the knowledge gained in previous courses. l To develop your capacity as a general manager in terms of an appreciation of the work of the general manager, the ability to view business problems from a general management perspective, the ability to develop original and innovative approaches to strategic problems, developing business judgment. l 3
THE CONCEPT OF STRATEGY The Concept of Strategy and the Pursuit of Sustainable Above-Normal Profits
Domain of Strategy • strategic competitiveness and above normal returns • concerns managerial decisions and actions which materially affect the success and survival of business enterprises • involves the judgment necessary to strategically position a business and its resources so as to maximize long-term profits in the face of irreducible uncertainty and aggressive competition • strategy is the linkage between a business and its current and future environment
Definition • The determination of the long run goals and objectives of an enterprise, the adoption of courses of action and the allocation of resources necessary for carrying out these goals Alfred Chandler, Strategy and Structure
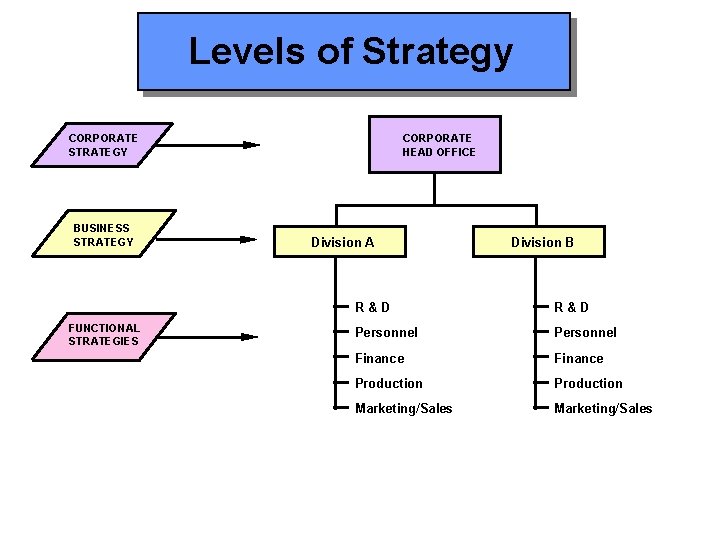
Levels of Strategy CORPORATE STRATEGY BUSINESS STRATEGY FUNCTIONAL STRATEGIES CORPORATE HEAD OFFICE Division A R & D Personnel Finance Production Marketing/Sales Division B R & D Personnel Finance Production Marketing/Sales
Levels of Strategy • Corporate strategy. . . defines the scope of the business in terms of the industries and markets in which it competes. • includes decisions about diversification, vertical integration, acquisitions, new ventures, divestments, allocation of scarce resources between business units • Business strategy. . . is concerned with how the firm competes within a particular industry or market. . . to win a business unit must adopt a strategy that establishes a competitive advantage over its rivals. • Functional strategy. . . the detailed deployment of resources at the operational level
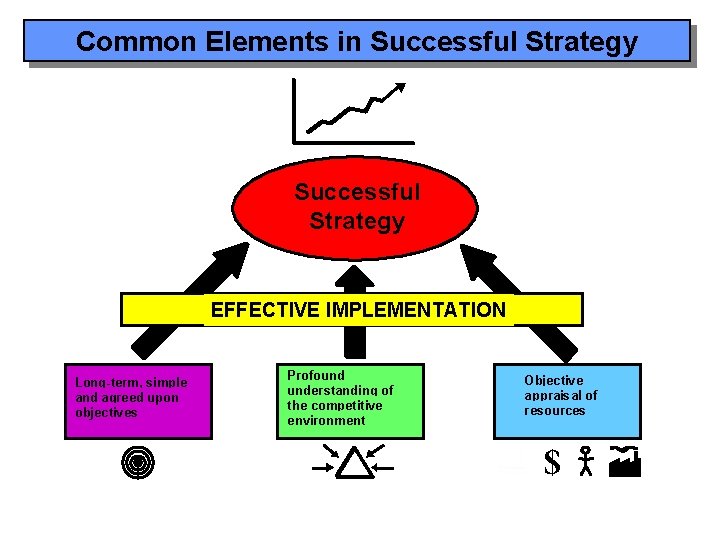
Common Elements in Successful Strategy EFFECTIVE IMPLEMENTATION Long-term, simple and agreed upon objectives Profound understanding of the competitive environment Objective appraisal of resources $
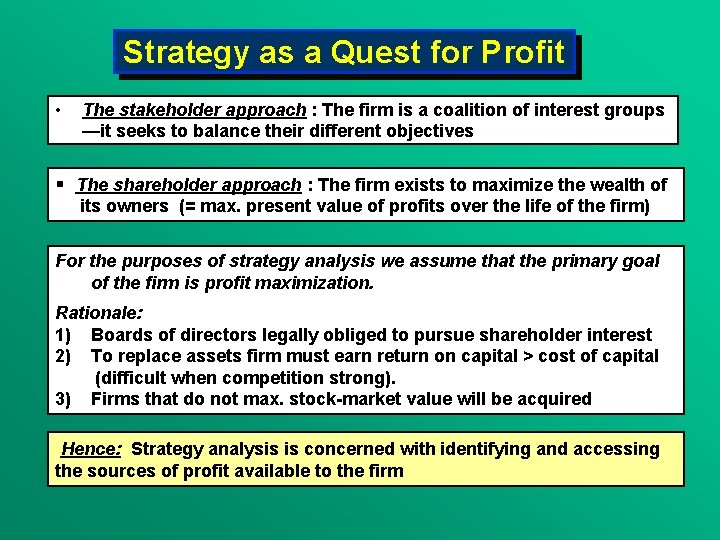
Strategy as a Quest for Profit • The stakeholder approach : The firm is a coalition of interest groups —it seeks to balance their different objectives § The shareholder approach : The firm exists to maximize the wealth of its owners (= max. present value of profits over the life of the firm) For the purposes of strategy analysis we assume that the primary goal of the firm is profit maximization. Rationale: 1) Boards of directors legally obliged to pursue shareholder interest 2) To replace assets firm must earn return on capital > cost of capital (difficult when competition strong). 3) Firms that do not max. stock-market value will be acquired Hence: Strategy analysis is concerned with identifying and accessing the sources of profit available to the firm
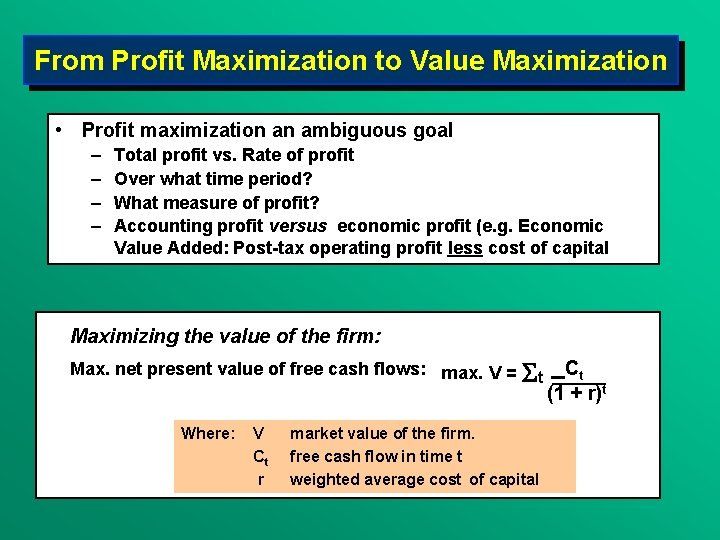
From Profit Maximization to Value Maximization • Profit maximization an ambiguous goal – – Total profit vs. Rate of profit Over what time period? What measure of profit? Accounting profit versus economic profit (e. g. Economic Value Added: Post-tax operating profit less cost of capital Maximizing the value of the firm: Max. net present value of free cash flows: max. V = St Ct (1 + r)t Where: V market value of the firm. Ct free cash flow in time t r weighted average cost of capital
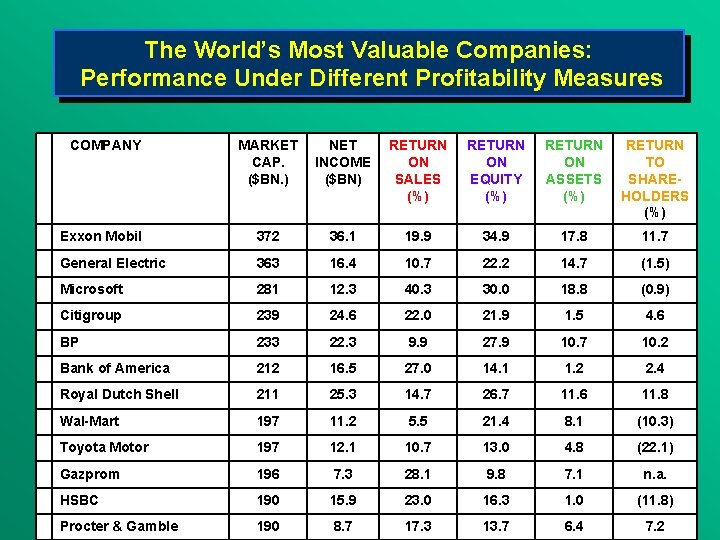
The World’s Most Valuable Companies: Performance Under Different Profitability Measures COMPANY MARKET NET RETURN CAP. INCOME ON ($BN. ) ($BN) SALES (%) RETURN ON EQUITY (%) RETURN ON TO ASSETS SHARE(%) HOLDERS (%) Exxon Mobil 372 36. 1 19. 9 34. 9 17. 8 11. 7 General Electric 363 16. 4 10. 7 22. 2 14. 7 (1. 5) Microsoft 281 12. 3 40. 3 30. 0 18. 8 (0. 9) Citigroup 239 24. 6 22. 0 21. 9 1. 5 4. 6 BP 233 22. 3 9. 9 27. 9 10. 7 10. 2 Bank of America 212 16. 5 27. 0 14. 1 1. 2 2. 4 Royal Dutch Shell 211 25. 3 14. 7 26. 7 11. 6 11. 8 Wal-Mart 197 11. 2 5. 5 21. 4 8. 1 (10. 3) Toyota Motor 197 12. 1 10. 7 13. 0 4. 8 (22. 1) Gazprom 196 7. 3 28. 1 9. 8 7. 1 n. a. HSBC 190 15. 9 23. 0 16. 3 1. 0 (11. 8) Procter & Gamble 190 8. 7 17. 3 13. 7 6. 4 7. 2
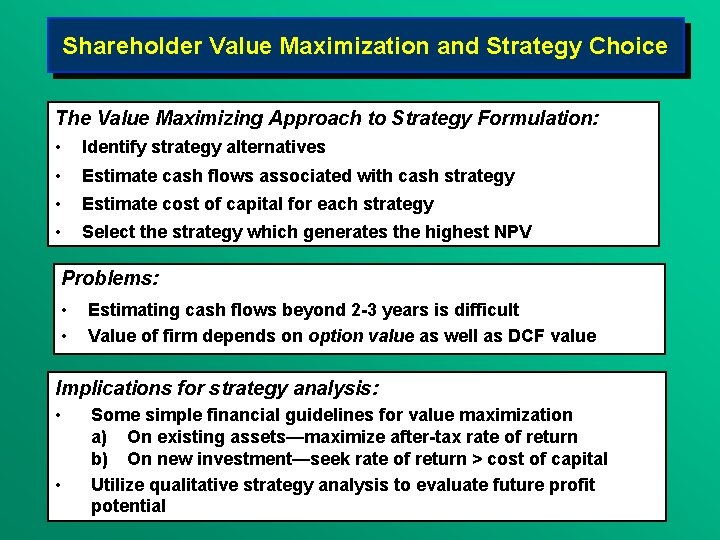
Shareholder Value Maximization and Strategy Choice The Value Maximizing Approach to Strategy Formulation: • Identify strategy alternatives • Estimate cash flows associated with cash strategy • Estimate cost of capital for each strategy • Select the strategy which generates the highest NPV Problems: • • Estimating cash flows beyond 2 -3 years is difficult Value of firm depends on option value as well as DCF value Implications for strategy analysis: • • Some simple financial guidelines for value maximization a) On existing assets—maximize after-tax rate of return b) On new investment—seek rate of return > cost of capital Utilize qualitative strategy analysis to evaluate future profit potential
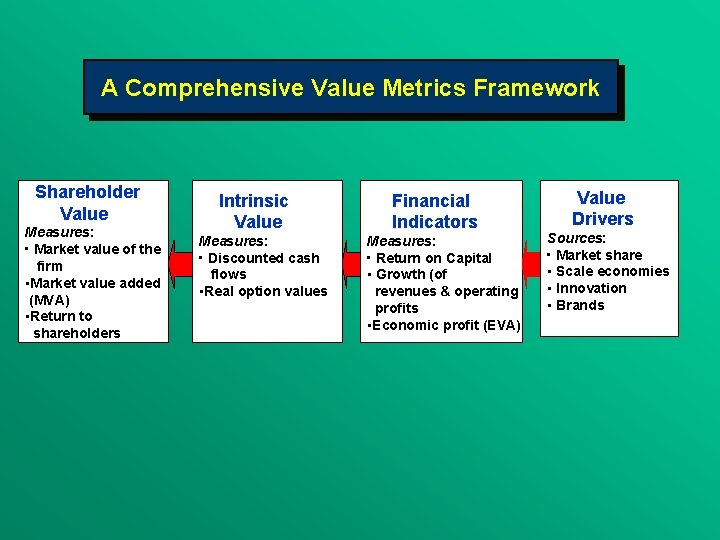
A Comprehensive Value Metrics Framework Shareholder Value Measures: • Market value of the firm • Market value added (MVA) • Return to shareholders Intrinsic Value Financial Indicators Measures: • Discounted cash flows • Real option values Measures: • Return on Capital • Growth (of revenues & operating profits • Economic profit (EVA) Value Drivers Sources: • Market share • Scale economies • Innovation • Brands
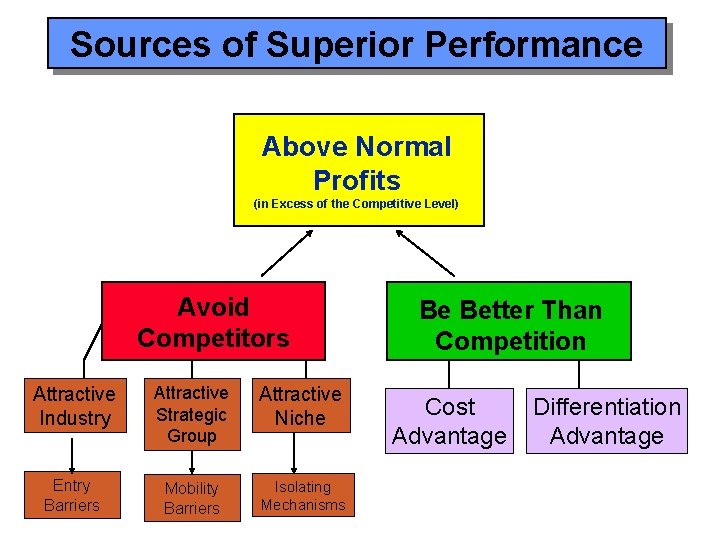
Sources of Superior Performance Above Normal Profits (in Excess of the Competitive Level) Avoid Competitors Attractive Industry Attractive Strategic Group Attractive Niche Entry Barriers Mobility Barriers Isolating Mechanisms Be Better Than Competition Cost Advantage Differentiation Advantage
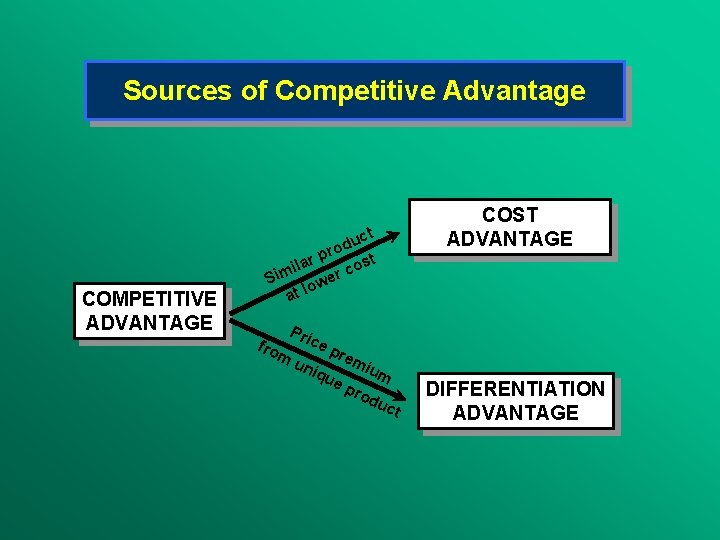
Sources of Competitive Advantage COMPETITIVE ADVANTAGE COST ADVANTAGE ct u d ro p r st la o i c m er Si w o l at fro Pri m ce un pre iqu mi um e p rod uc t DIFFERENTIATION ADVANTAGE
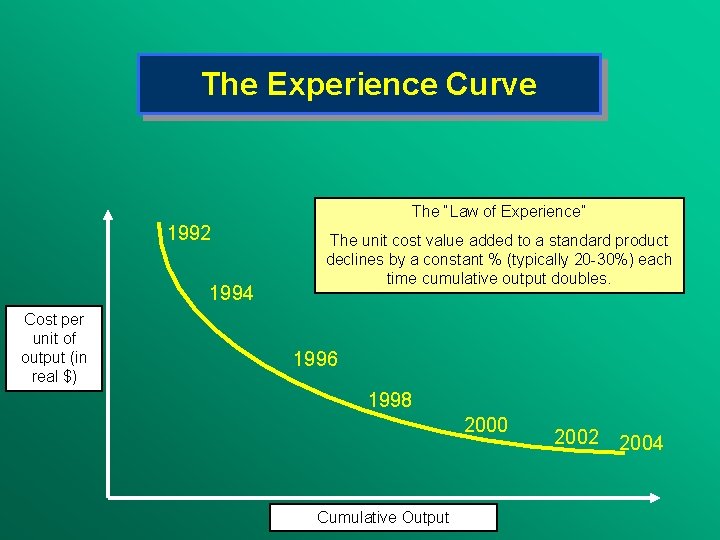
The Experience Curve The “Law of Experience” 1992 1994 Cost per unit of output (in real $) The unit cost value added to a standard product declines by a constant % (typically 20 -30%) each time cumulative output doubles. 1996 1998 2000 Cumulative Output 2002 2004
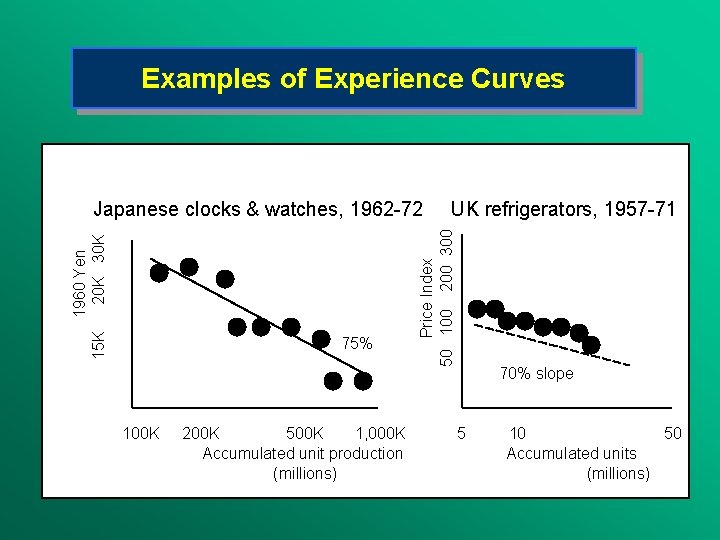
Examples of Experience Curves 75% 100 K 200 K 500 K 1, 000 K Accumulated unit production (millions) UK refrigerators, 1957 -71 Price Index 50 100 200 300 1960 Yen 15 K 20 K 30 K Japanese clocks & watches, 1962 -72 70% slope 5 10 50 Accumulated units (millions)
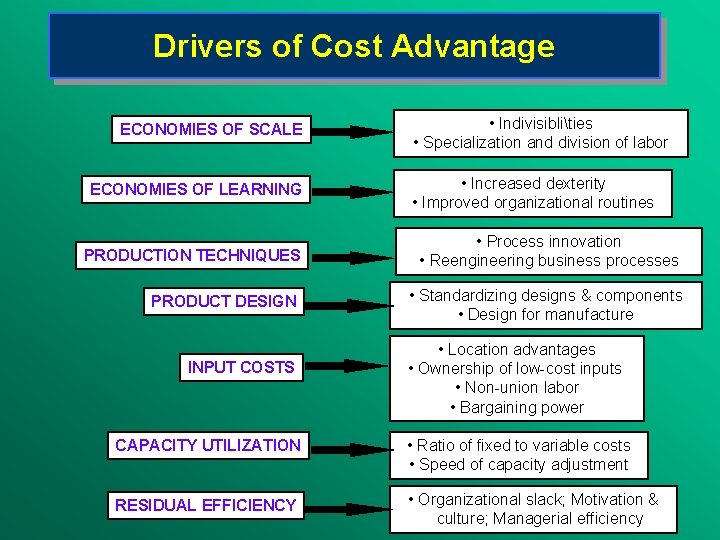
Drivers of Cost Advantage ECONOMIES OF SCALE ECONOMIES OF LEARNING • Indivisiblities • Specialization and division of labor • Increased dexterity • Improved organizational routines PRODUCTION TECHNIQUES • Process innovation • Reengineering business processes PRODUCT DESIGN • Standardizing designs & components • Design for manufacture INPUT COSTS • Location advantages • Ownership of low-cost inputs • Non-union labor • Bargaining power CAPACITY UTILIZATION • Ratio of fixed to variable costs • Speed of capacity adjustment RESIDUAL EFFICIENCY • Organizational slack; Motivation & culture; Managerial efficiency
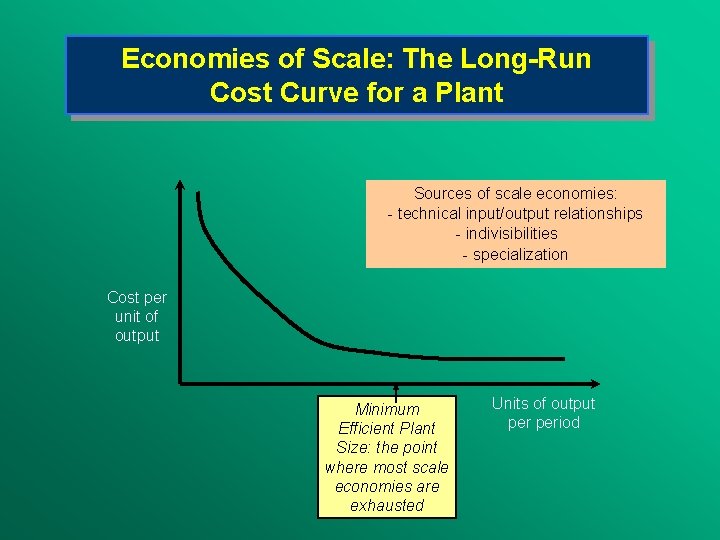
Economies of Scale: The Long-Run Cost Curve for a Plant Sources of scale economies: - technical input/output relationships - indivisibilities - specialization Cost per unit of output Minimum Efficient Plant Size: the point where most scale economies are exhausted Units of output period
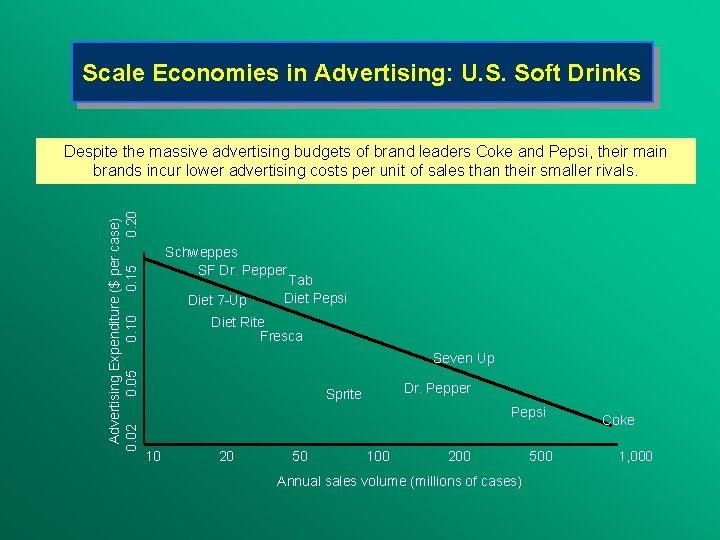
Scale Economies in Advertising: U. S. Soft Drinks Advertising Expenditure ($ per case) 0. 02 0. 05 0. 10 0. 15 0. 20 Despite the massive advertising budgets of brand leaders Coke and Pepsi, their main brands incur lower advertising costs per unit of sales than their smaller rivals. Schweppes SF Dr. Pepper Diet 7 -Up Tab Diet Pepsi Diet Rite Fresca Seven Up Dr. Pepper Sprite Pepsi 10 20 50 100 200 Annual sales volume (millions of cases) 500 Coke 1, 000
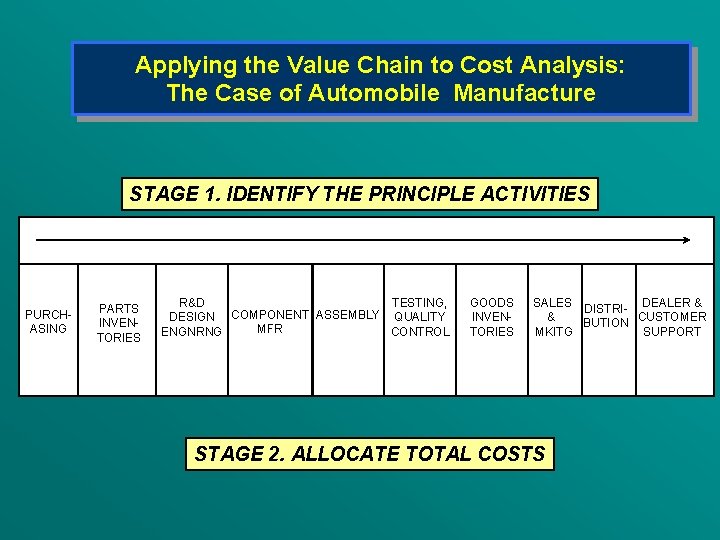
Applying the Value Chain to Cost Analysis: The Case of Automobile Manufacture STAGE 1. IDENTIFY THE PRINCIPLE ACTIVITIES PURCHASING PARTS INVENTORIES R&D TESTING, COMPONENT ASSEMBLY DESIGN QUALITY MFR ENGNRNG CONTROL GOODS INVENTORIES SALES DISTRI- DEALER & & BUTION CUSTOMER MKITG SUPPORT STAGE 2. ALLOCATE TOTAL COSTS
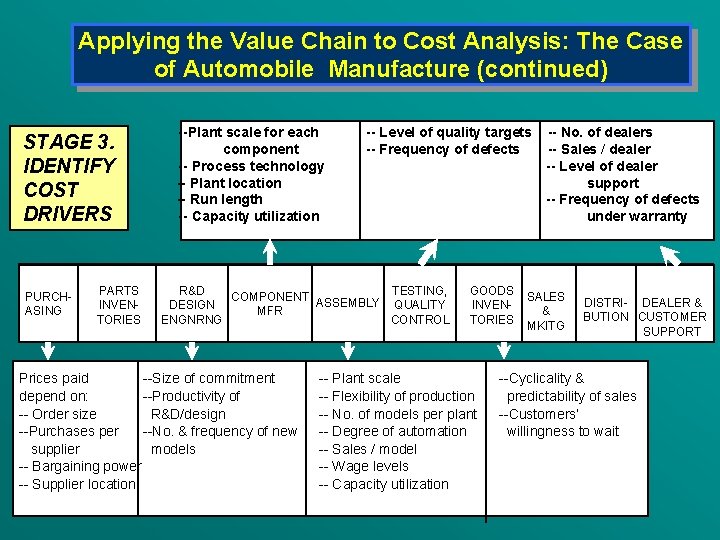
Applying the Value Chain to Cost Analysis: The Case of Automobile Manufacture (continued) --Plant scale for each -- Level of quality targets -- No. of dealers -- Frequency of defects -- Sales / dealer -- Level of dealer support -- Frequency of defects under warranty STAGE 3. component -- Process technology IDENTIFY COST -- Plant location -- Run length DRIVERS -- Capacity utilization PURCHASING PARTS INVENTORIES R&D COMPONENT ASSEMBLY TESTING, DESIGN QUALITY MFR ENGNRNG CONTROL Prices paid --Size of commitment depend on: --Productivity of -- Order size R&D/design --Purchases per --No. & frequency of new supplier models -- Bargaining power -- Supplier location GOODS INVENTORIES -- Plant scale -- Flexibility of production -- No. of models per plant -- Degree of automation -- Sales / model -- Wage levels -- Capacity utilization SALES & MKITG DISTRI- DEALER & BUTION CUSTOMER SUPPORT --Cyclicality & predictability of sales --Customers’ willingness to wait
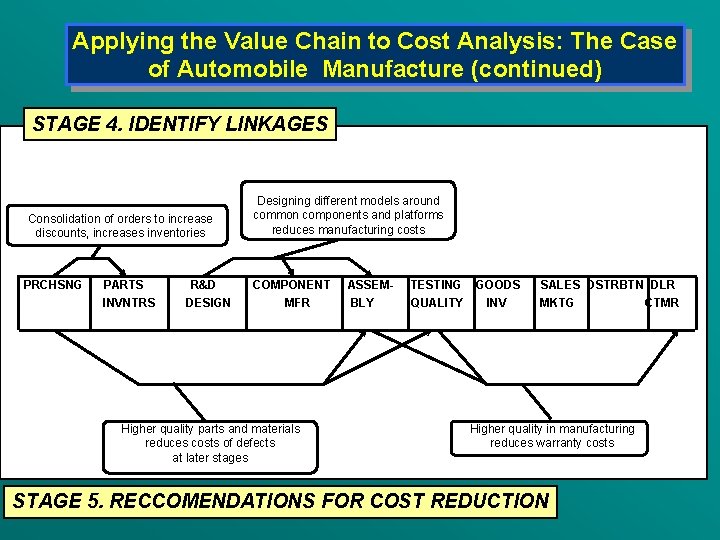
Applying the Value Chain to Cost Analysis: The Case of Automobile Manufacture (continued) STAGE 4. IDENTIFY LINKAGES Consolidation of orders to increase discounts, increases inventories Designing different models around common components and platforms reduces manufacturing costs PRCHSNG PARTS R&D COMPONENT ASSEM- TESTING GOODS SALES DSTRBTN DLR INVNTRS DESIGN MFR BLY QUALITY INV MKTG CTMR Higher quality parts and materials reduces costs of defects at later stages Higher quality in manufacturing reduces warranty costs STAGE 5. RECCOMENDATIONS FOR COST REDUCTION
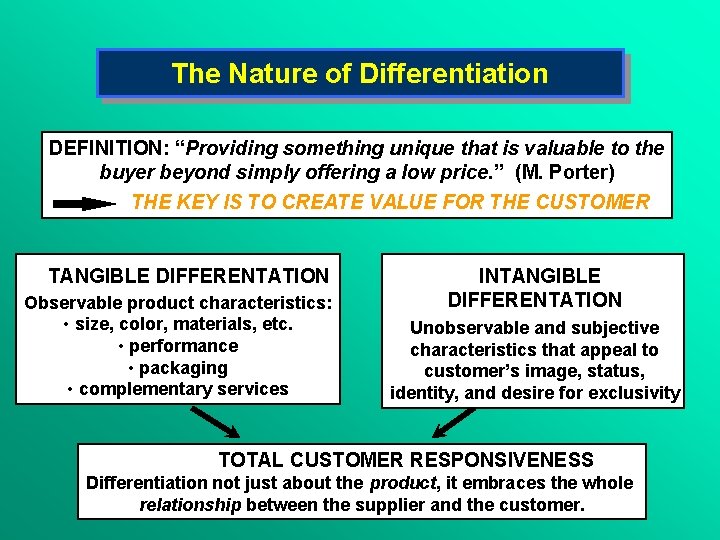
The Nature of Differentiation DEFINITION: “Providing something unique that is valuable to the buyer beyond simply offering a low price. ” (M. Porter) THE KEY IS TO CREATE VALUE FOR THE CUSTOMER TANGIBLE DIFFERENTATION Observable product characteristics: • size, color, materials, etc. • performance • packaging • complementary services INTANGIBLE DIFFERENTATION Unobservable and subjective characteristics that appeal to customer’s image, status, identity, and desire for exclusivity TOTAL CUSTOMER RESPONSIVENESS Differentiation not just about the product, it embraces the whole relationship between the supplier and the customer.
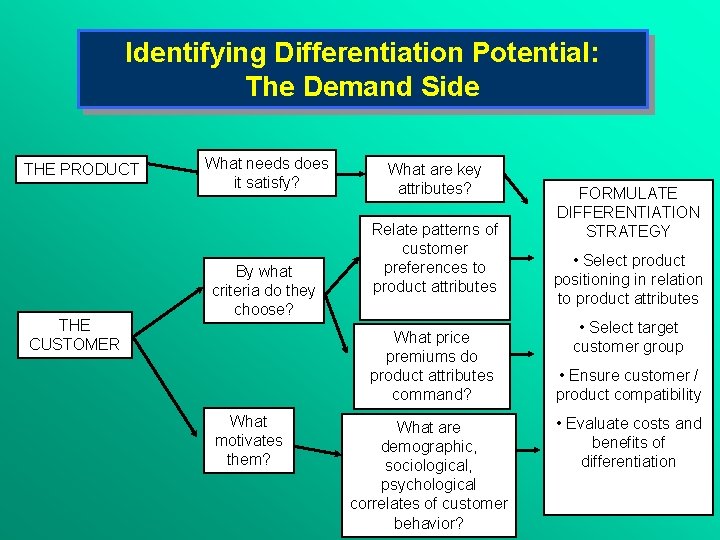
Identifying Differentiation Potential: The Demand Side THE PRODUCT THE CUSTOMER What needs does it satisfy? By what criteria do they choose? What are key attributes? Relate patterns of customer preferences to product attributes What price premiums do product attributes command? What motivates them? What are demographic, sociological, psychological correlates of customer behavior? FORMULATE DIFFERENTIATION STRATEGY • Select product positioning in relation to product attributes • Select target customer group • Ensure customer / product compatibility • Evaluate costs and benefits of differentiation
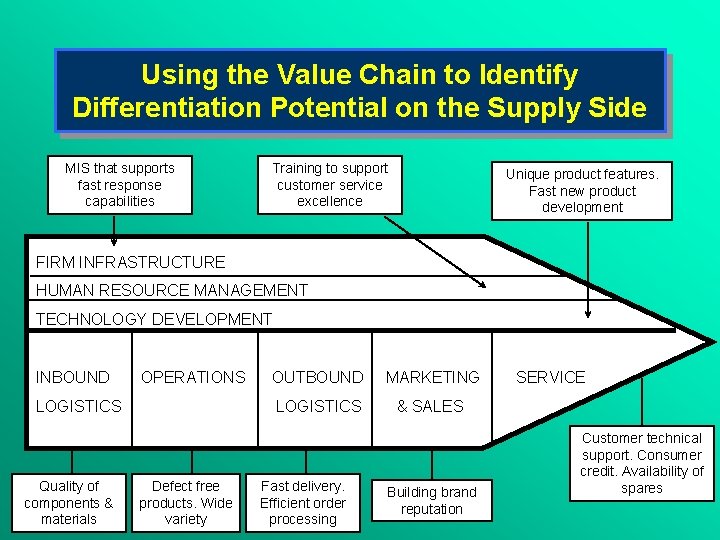
Using the Value Chain to Identify Differentiation Potential on the Supply Side MIS that supports fast response capabilities Training to support customer service excellence Unique product features. Fast new product development FIRM INFRASTRUCTURE HUMAN RESOURCE MANAGEMENT TECHNOLOGY DEVELOPMENT INBOUND OPERATIONS LOGISTICS Quality of components & materials Defect free products. Wide variety OUTBOUND MARKETING LOGISTICS & SALES Fast delivery. Efficient order processing Building brand reputation SERVICE Customer technical support. Consumer credit. Availability of spares
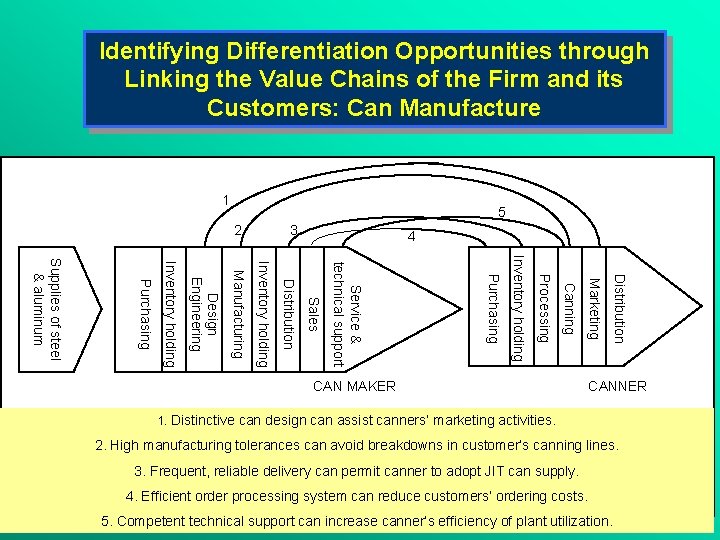
Identifying Differentiation Opportunities through Linking the Value Chains of the Firm and its Customers: Can Manufacture 1 5 2 3 4 Distribution Marketing Canning Processing Inventory holding Purchasing Service & technical support Sales Distribution Inventory holding Manufacturing Design Engineering Inventory holding Purchasing Supplies of steel & aluminum CAN MAKER CANNER 1. Distinctive can design can assist canners’ marketing activities. 2. High manufacturing tolerances can avoid breakdowns in customer’s canning lines. 3. Frequent, reliable delivery can permit canner to adopt JIT can supply. 4. Efficient order processing system can reduce customers’ ordering costs. 5. Competent technical support can increase canner’s efficiency of plant utilization.
INDUSTRY ANALYSIS AND POSITIONING Determining Industry Attractiveness and Identifying Strategic Opportunities
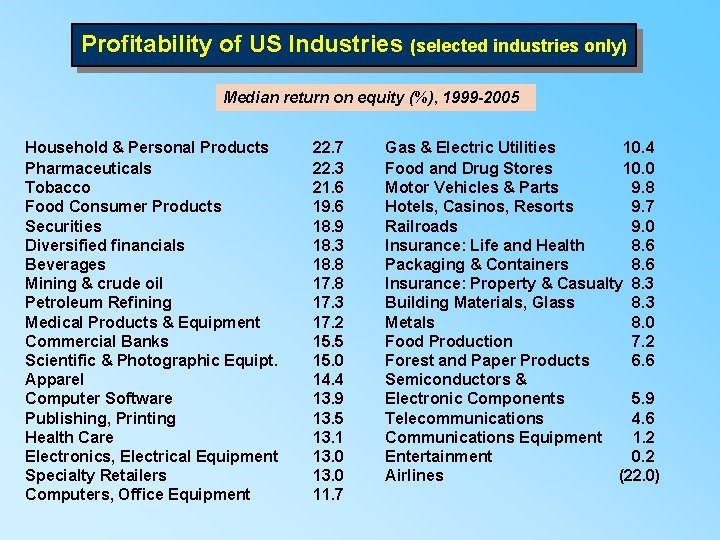
Profitability of US Industries (selected industries only) Median return on equity (%), 1999 -2005 Household & Personal Products Pharmaceuticals Tobacco Food Consumer Products Securities Diversified financials Beverages Mining & crude oil Petroleum Refining Medical Products & Equipment Commercial Banks Scientific & Photographic Equipt. Apparel Computer Software Publishing, Printing Health Care Electronics, Electrical Equipment Specialty Retailers Computers, Office Equipment 22. 7 22. 3 21. 6 19. 6 18. 9 18. 3 18. 8 17. 3 17. 2 15. 5 15. 0 14. 4 13. 9 13. 5 13. 1 13. 0 11. 7 Gas & Electric Utilities 10. 4 Food and Drug Stores 10. 0 Motor Vehicles & Parts 9. 8 Hotels, Casinos, Resorts 9. 7 Railroads 9. 0 Insurance: Life and Health 8. 6 Packaging & Containers 8. 6 Insurance: Property & Casualty 8. 3 Building Materials, Glass 8. 3 Metals 8. 0 Food Production 7. 2 Forest and Paper Products 6. 6 Semiconductors & Electronic Components 5. 9 Telecommunications 4. 6 Communications Equipment 1. 2 Entertainment 0. 2 Airlines (22. 0)
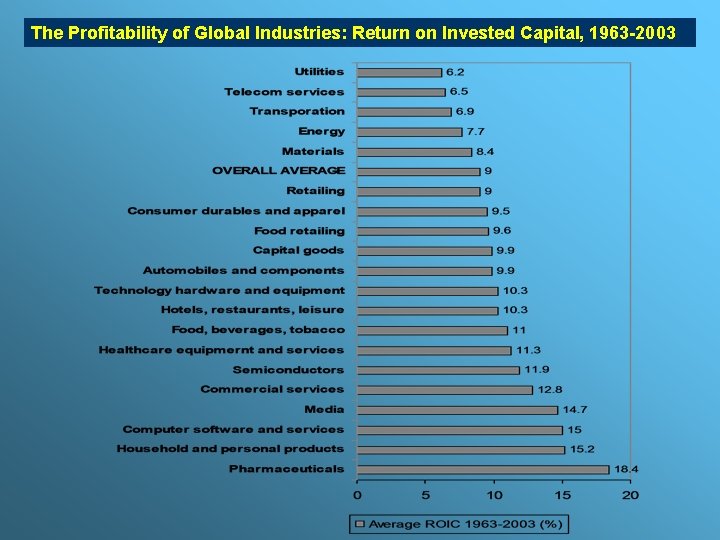
The Profitability of Global Industries: Return on Invested Capital, 1963 -2003
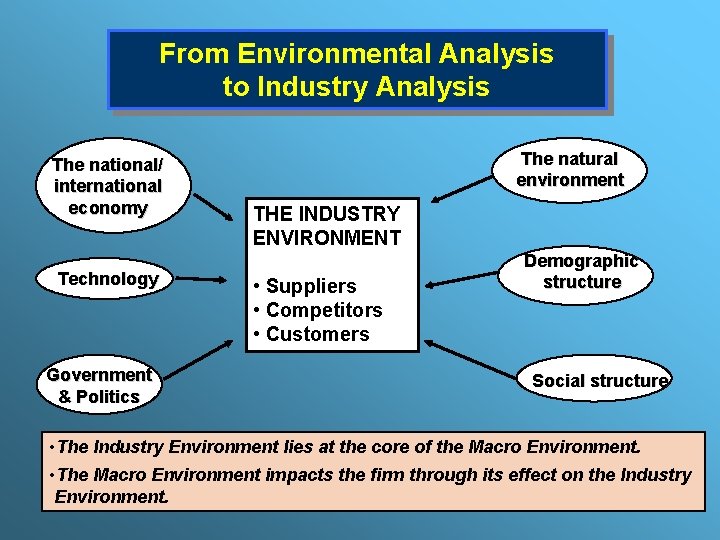
From Environmental Analysis to Industry Analysis The national/ international economy Technology Government & Politics The natural environment THE INDUSTRY ENVIRONMENT • Suppliers • Competitors • Customers Demographic structure Social structure • The Industry Environment lies at the core of the Macro Environment. • The Macro Environment impacts the firm through its effect on the Industry Environment.
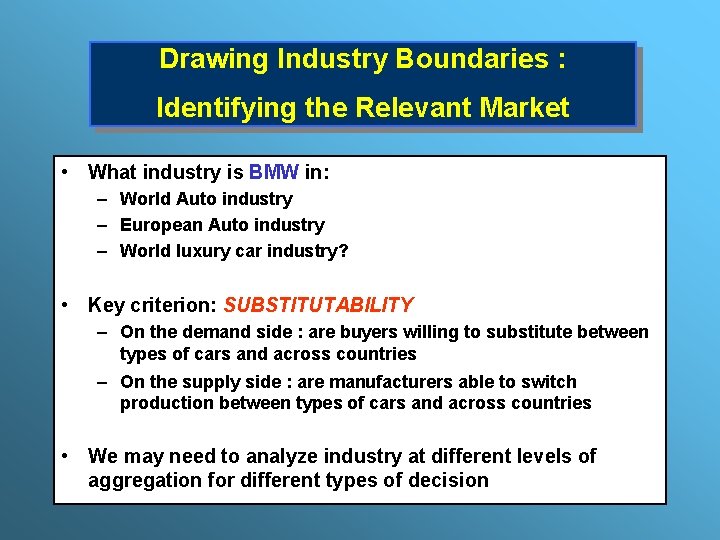
Drawing Industry Boundaries : Identifying the Relevant Market • What industry is BMW in: – World Auto industry – European Auto industry – World luxury car industry? • Key criterion: SUBSTITUTABILITY – On the demand side : are buyers willing to substitute between types of cars and across countries – On the supply side : are manufacturers able to switch production between types of cars and across countries • We may need to analyze industry at different levels of aggregation for different types of decision
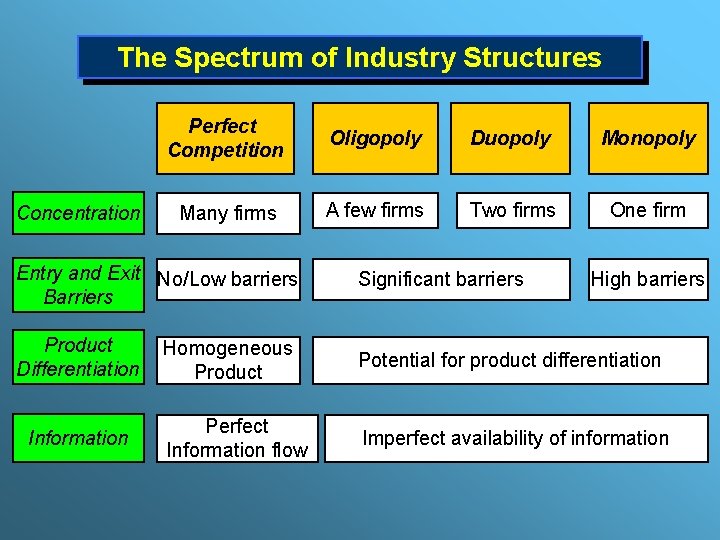
The Spectrum of Industry Structures Concentration Perfect Competition Oligopoly Duopoly Monopoly Many firms A few firms Two firms One firm Entry and Exit No/Low barriers Barriers Significant barriers Product Differentiation Homogeneous Product Potential for product differentiation Perfect Information flow Imperfect availability of information Information High barriers
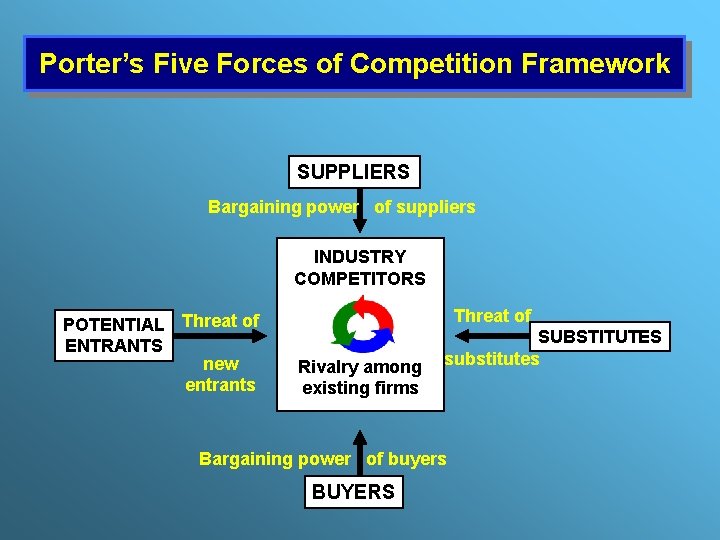
Porter’s Five Forces of Competition Framework SUPPLIERS Bargaining power of suppliers INDUSTRY COMPETITORS POTENTIAL Threat of ENTRANTS new entrants Threat of Rivalry among existing firms SUBSTITUTES substitutes Bargaining power of buyers BUYERS
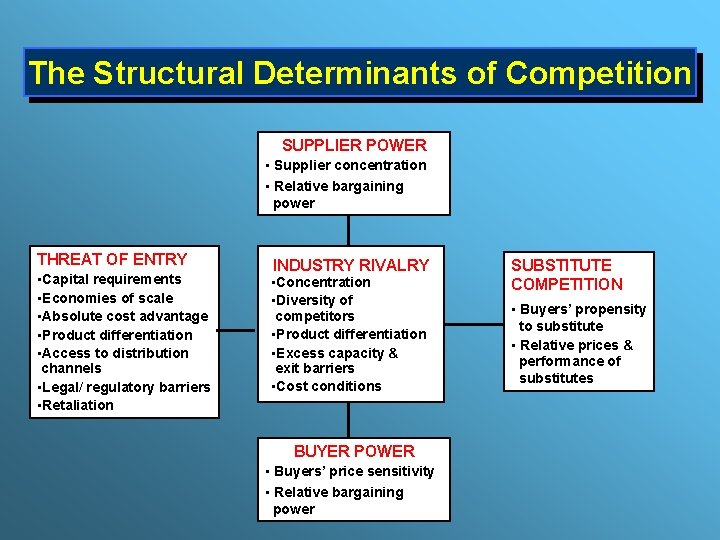
The Structural Determinants of Competition SUPPLIER POWER • Supplier concentration • Relative bargaining power THREAT OF ENTRY • Capital requirements • Economies of scale • Absolute cost advantage • Product differentiation • Access to distribution channels • Legal/ regulatory barriers • Retaliation INDUSTRY RIVALRY • Concentration • Diversity of competitors • Product differentiation • Excess capacity & exit barriers • Cost conditions BUYER POWER • Buyers’ price sensitivity • Relative bargaining power SUBSTITUTE COMPETITION • Buyers’ propensity to substitute • Relative prices & performance of substitutes
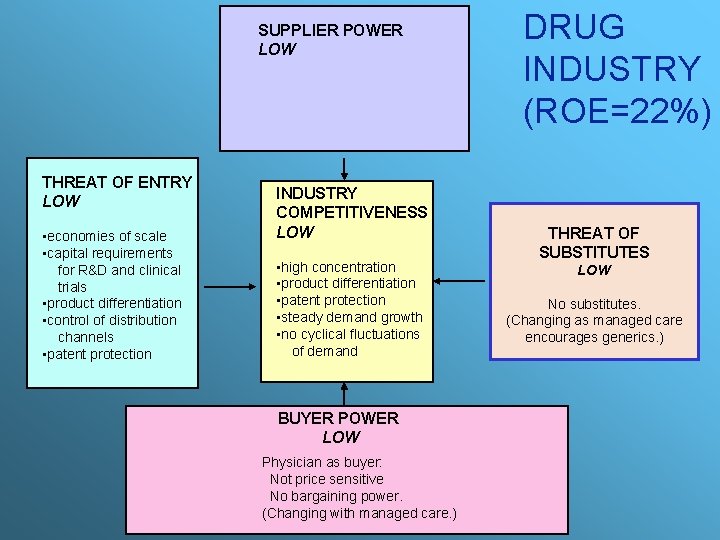
SUPPLIER POWER LOW THREAT OF ENTRY LOW • economies of scale • capital requirements for R&D and clinical trials • product differentiation • control of distribution channels • patent protection INDUSTRY COMPETITIVENESS LOW • high concentration • product differentiation • patent protection • steady demand growth • no cyclical fluctuations of demand BUYER POWER LOW Physician as buyer: Not price sensitive No bargaining power. (Changing with managed care. ) DRUG INDUSTRY (ROE=22%) THREAT OF SUBSTITUTES LOW No substitutes. (Changing as managed care encourages generics. )
Applying Five-Forces Analysis Forecasting Industry Profitability • Past profitability a poor indicator of future profitability. • If we can forecast changes in industry structure we can predict likely impact on competition and profitability. Strategies to Improve Industry Profitability • What structural variables are depressing profitability • Which of these variables can be changed by individual or collective strategies?
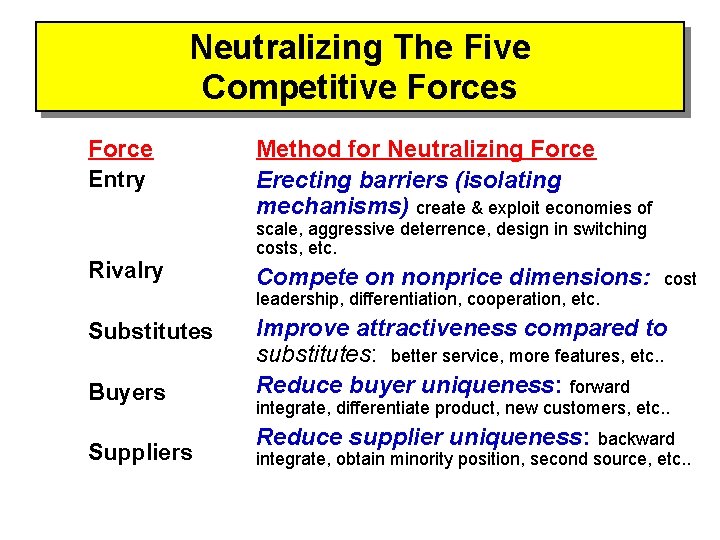
Neutralizing The Five Competitive Forces Force Entry Rivalry Method for Neutralizing Force Erecting barriers (isolating mechanisms) create & exploit economies of scale, aggressive deterrence, design in switching costs, etc. Compete on nonprice dimensions: cost leadership, differentiation, cooperation, etc. Substitutes Buyers Suppliers Improve attractiveness compared to substitutes: better service, more features, etc. . Reduce buyer uniqueness: forward integrate, differentiate product, new customers, etc. . Reduce supplier uniqueness: backward integrate, obtain minority position, second source, etc. .
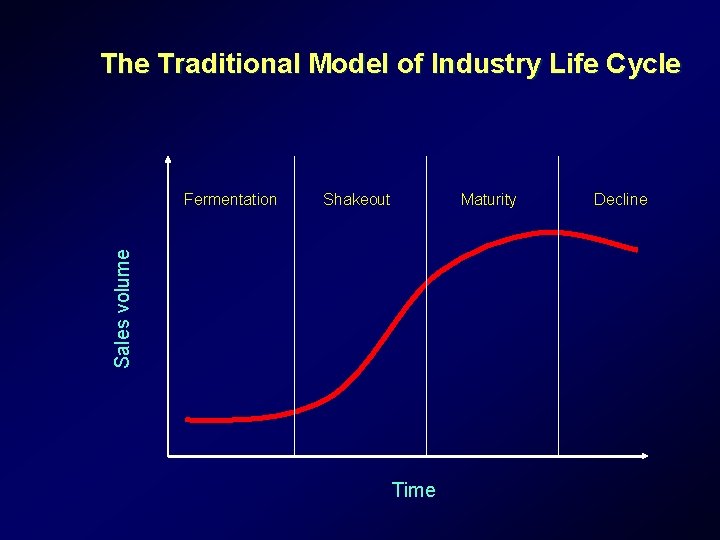
The Traditional Model of Industry Life Cycle Shakeout Maturity Sales volume Fermentation Time Decline
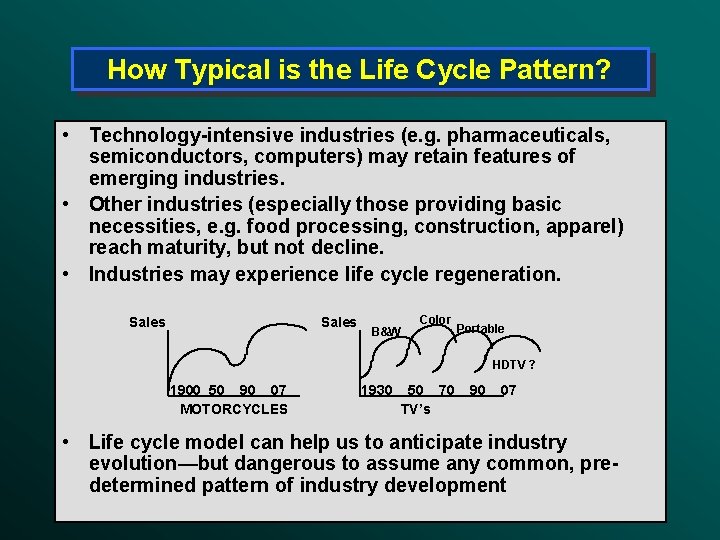
How Typical is the Life Cycle Pattern? • Technology-intensive industries (e. g. pharmaceuticals, semiconductors, computers) may retain features of emerging industries. • Other industries (especially those providing basic necessities, e. g. food processing, construction, apparel) reach maturity, but not decline. • Industries may experience life cycle regeneration. Sales B&W Color Portable HDTV ? 1900 50 90 07 1930 50 70 90 07 MOTORCYCLES TV’s • Life cycle model can help us to anticipate industry evolution—but dangerous to assume any common, predetermined pattern of industry development
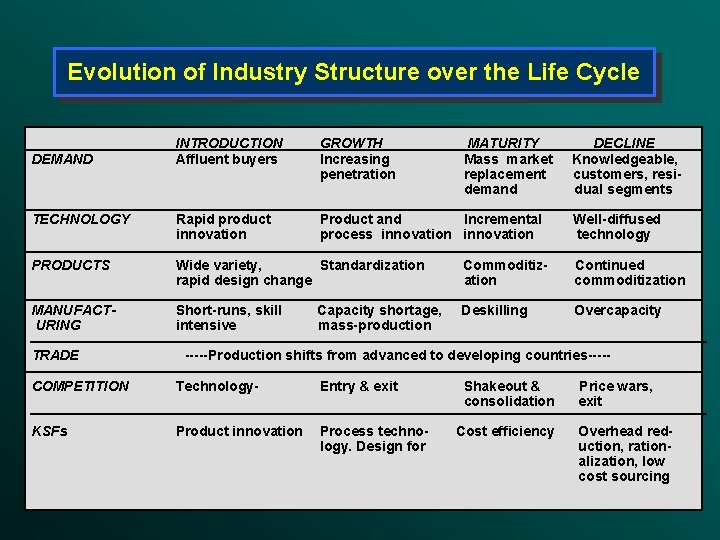
Evolution of Industry Structure over the Life Cycle INTRODUCTION Affluent buyers GROWTH Increasing penetration TECHNOLOGY Rapid product innovation Product and Incremental Well-diffused process innovation technology PRODUCTS Wide variety, Standardization Commoditiz- Continued rapid design change ation commoditization DEMAND MATURITY DECLINE Mass market Knowledgeable, replacement customers, resi- demand dual segments MANUFACTShort-runs, skill Capacity shortage, Deskilling Overcapacity URING intensive mass-production TRADE -----Production shifts from advanced to developing countries----- COMPETITION Technology- Entry & exit Shakeout & Price wars, consolidation exit KSFs Product innovation Process techno- Cost efficiency Overhead red logy. Design for uction, ration- alization, low cost sourcing
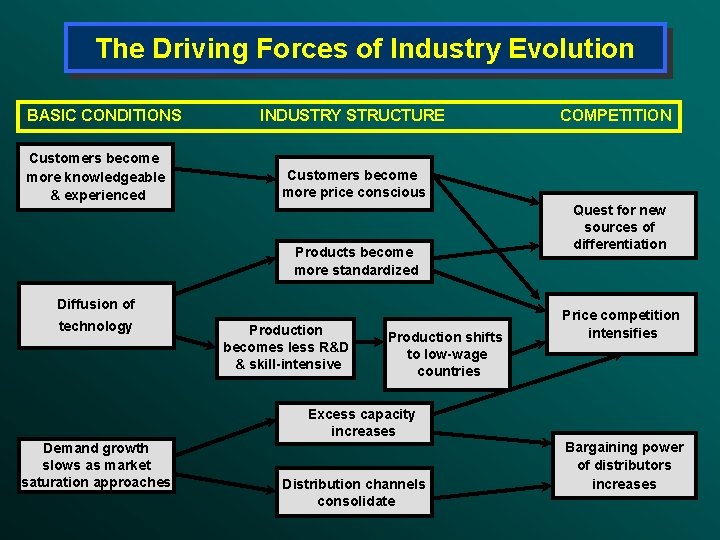
The Driving Forces of Industry Evolution BASIC CONDITIONS Customers become more knowledgeable & experienced INDUSTRY STRUCTURE Customers become more price conscious Products become more standardized Diffusion of technology COMPETITION Production becomes less R&D & skill-intensive Production shifts to low-wage countries Quest for new sources of differentiation Price competition intensifies Excess capacity increases Demand growth slows as market saturation approaches Distribution channels consolidate Bargaining power of distributors increases
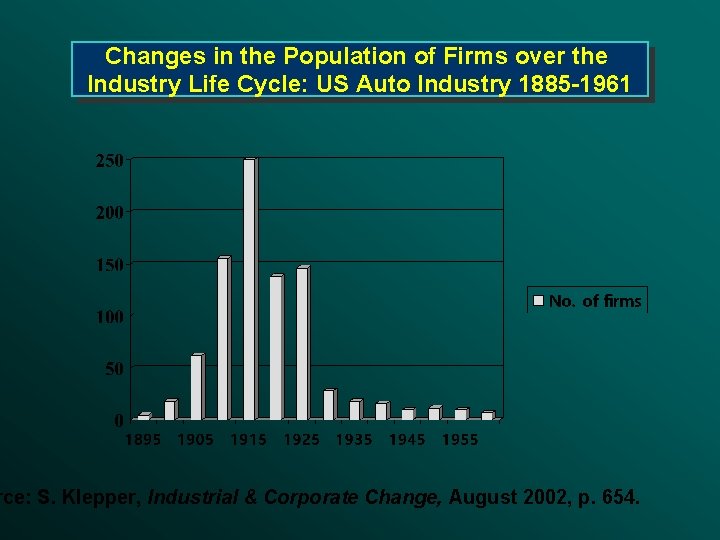
Changes in the Population of Firms over the Industry Life Cycle: US Auto Industry 1885 -1961 rce: S. Klepper, Industrial & Corporate Change, August 2002, p. 654.
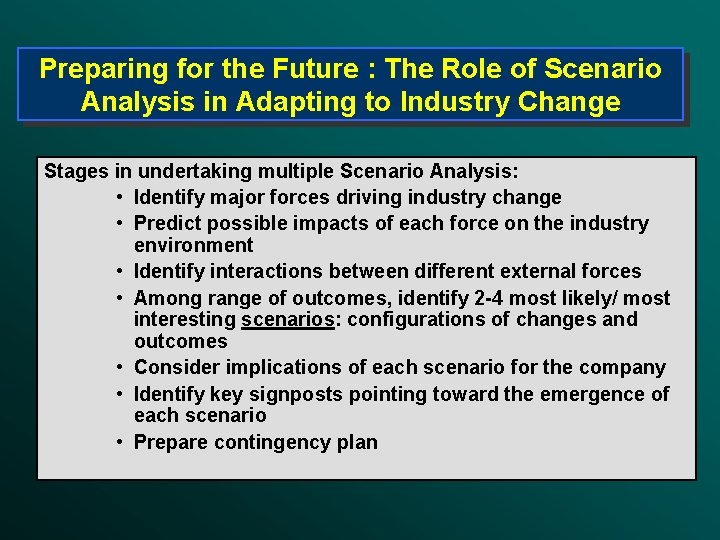
Preparing for the Future : The Role of Scenario Analysis in Adapting to Industry Change Stages in undertaking multiple Scenario Analysis: • Identify major forces driving industry change • Predict possible impacts of each force on the industry environment • Identify interactions between different external forces • Among range of outcomes, identify 2 -4 most likely/ most interesting scenarios: configurations of changes and outcomes • Consider implications of each scenario for the company • Identify key signposts pointing toward the emergence of each scenario • Prepare contingency plan
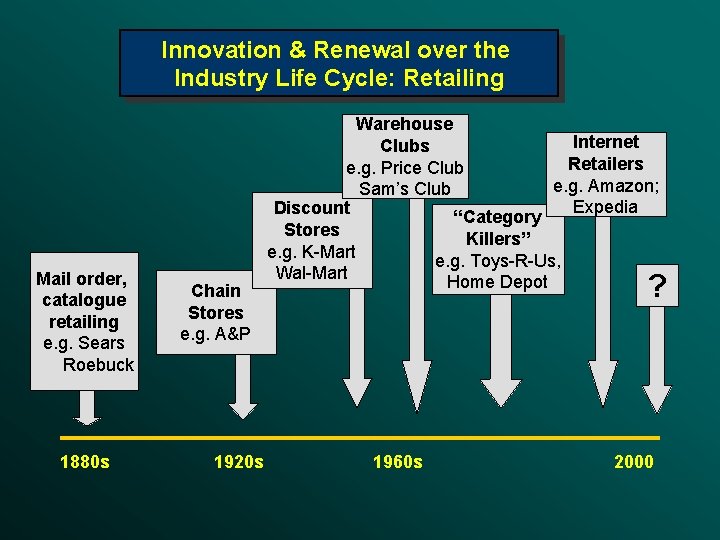
Innovation & Renewal over the Industry Life Cycle: Retailing Mail order, catalogue retailing e. g. Sears Roebuck 1880 s Chain Stores e. g. A&P 1920 s Warehouse Internet Clubs Retailers e. g. Price Club e. g. Amazon; Sam’s Club Expedia Discount “Category Stores Killers” e. g. K-Mart e. g. Toys-R-Us, Wal-Mart Home Depot ? 1960 s 2000
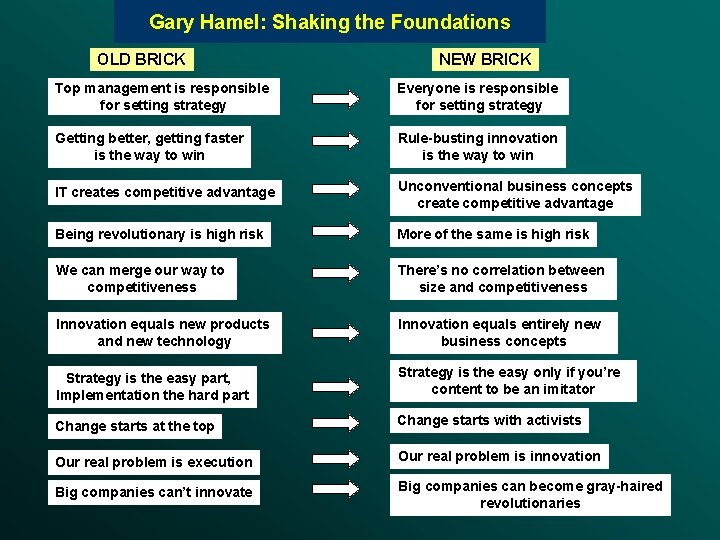
Gary Hamel: Shaking the Foundations OLD BRICK NEW BRICK Top management is responsible for setting strategy Everyone is responsible for setting strategy Getting better, getting faster is the way to win Rule-busting innovation is the way to win IT creates competitive advantage Unconventional business concepts create competitive advantage Being revolutionary is high risk More of the same is high risk We can merge our way to competitiveness There’s no correlation between size and competitiveness Innovation equals new products and new technology Innovation equals entirely new business concepts Strategy is the easy part, Implementation the hard part Strategy is the easy only if you’re content to be an imitator Change starts at the top Change starts with activists Our real problem is execution Our real problem is innovation Big companies can’t innovate Big companies can become gray-haired revolutionaries
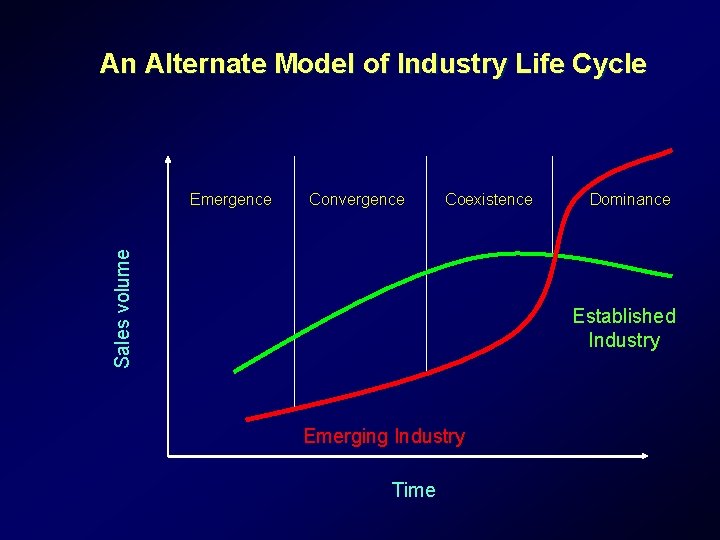
An Alternate Model of Industry Life Cycle Convergence Coexistence Sales volume Emergence Dominance Established Industry Emerging Industry Time
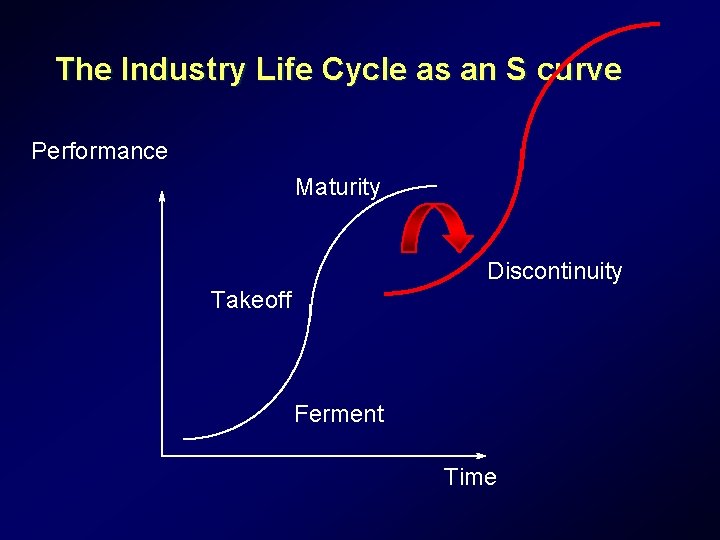
The Industry Life Cycle as an S curve Performance Maturity Discontinuity Takeoff Ferment Time
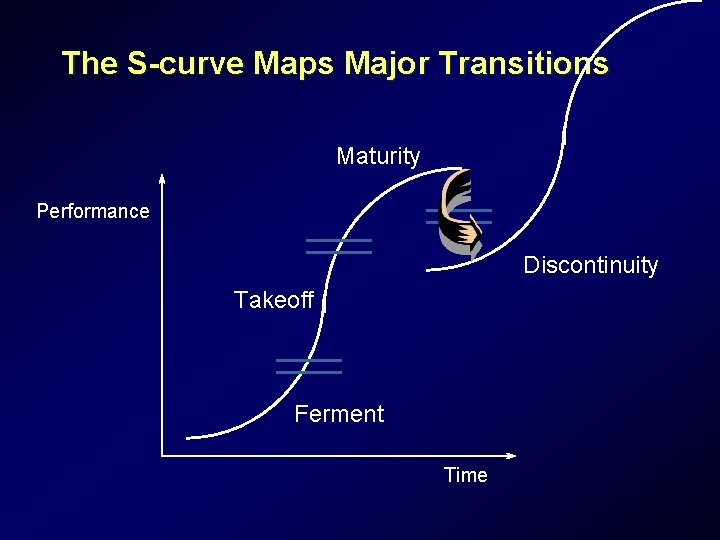
The S-curve Maps Major Transitions Maturity Performance Discontinuity Takeoff Ferment Time
RESOURCES, CAPABILITIES, AND CORE COMPETENCES
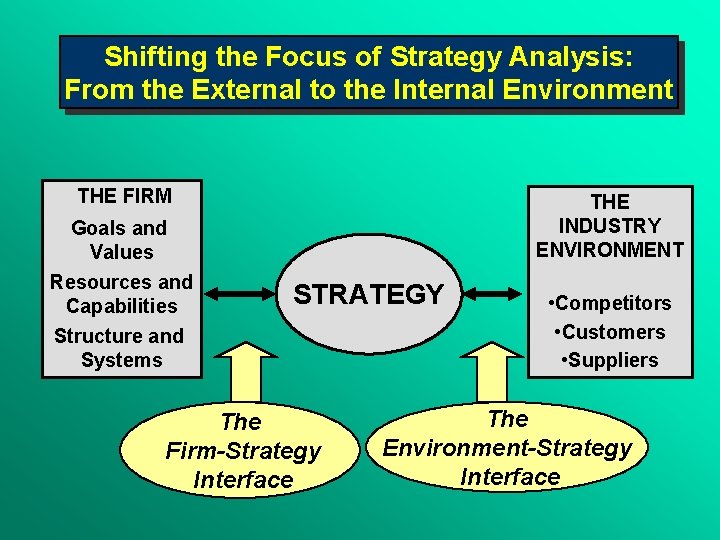
Shifting the Focus of Strategy Analysis: From the External to the Internal Environment THE FIRM Goals and Values Resources and Capabilities Structure and Systems THE INDUSTRY ENVIRONMENT STRATEGY The Firm-Strategy Interface • Competitors • Customers • Suppliers The Environment-Strategy Interface
Rationale for the Resource-based Approach to Strategy • When the external environment is subject to rapid change, internal resources and capabilities offer a more secure basis for strategy than market focus. • Resources and capabilities are the primary sources of profitability.
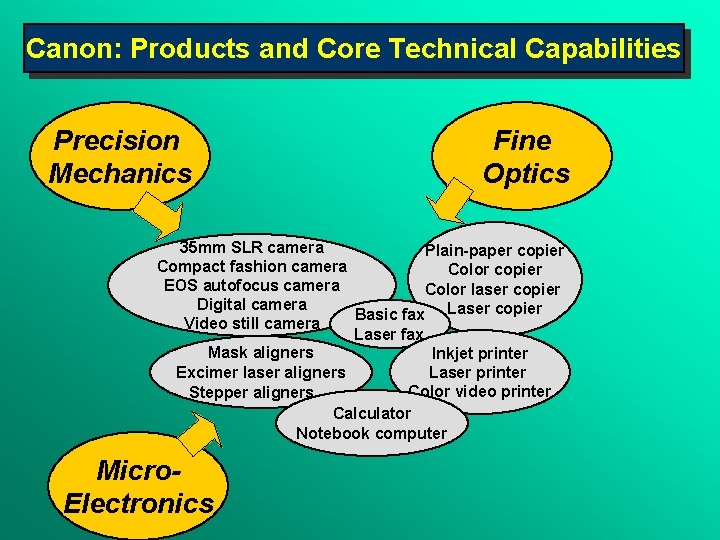
Canon: Products and Core Technical Capabilities Precision Mechanics Fine Optics 35 mm SLR camera Plain-paper copier Compact fashion camera Color copier EOS autofocus camera Color laser copier Digital camera Basic fax Laser copier Video still camera Laser fax Mask aligners Inkjet printer Excimer laser aligners Laser printer Color video printer Stepper aligners Calculator Notebook computer Micro. Electronics
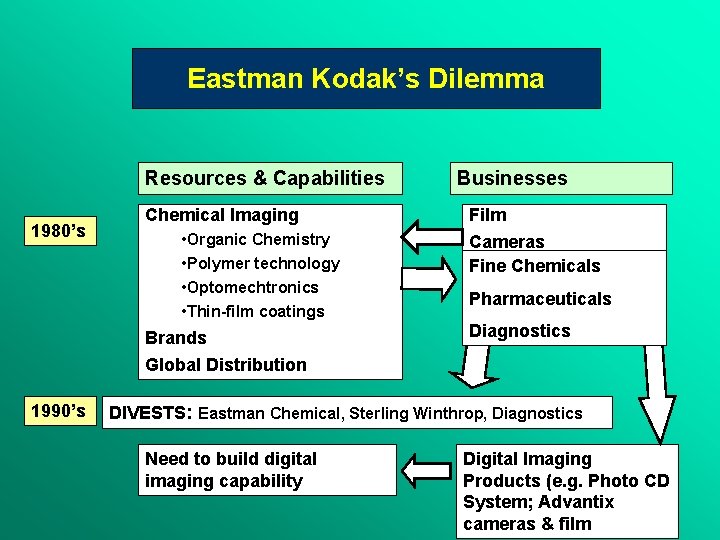
Eastman Kodak’s Dilemma Resources & Capabilities 1980’s Chemical Imaging • Organic Chemistry • Polymer technology • Optomechtronics • Thin-film coatings Brands Businesses Film Cameras Fine Chemicals Pharmaceuticals Diagnostics Global Distribution 1990’s DIVESTS: Eastman Chemical, Sterling Winthrop, Diagnostics Need to build digital imaging capability Digital Imaging Products (e. g. Photo CD System; Advantix cameras & film
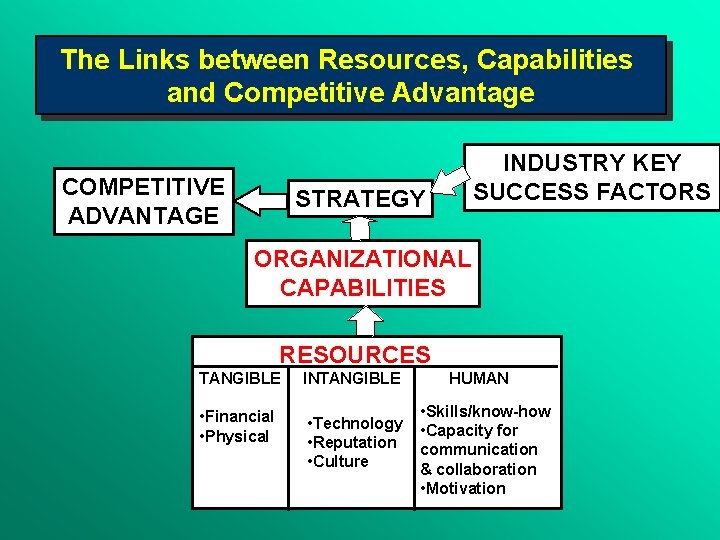
The Links between Resources, Capabilities and Competitive Advantage COMPETITIVE ADVANTAGE STRATEGY INDUSTRY KEY SUCCESS FACTORS ORGANIZATIONAL CAPABILITIES RESOURCES TANGIBLE INTANGIBLE HUMAN • Financial • Physical • Technology • Reputation • Culture • Skills/know-how • Capacity for communication & collaboration • Motivation
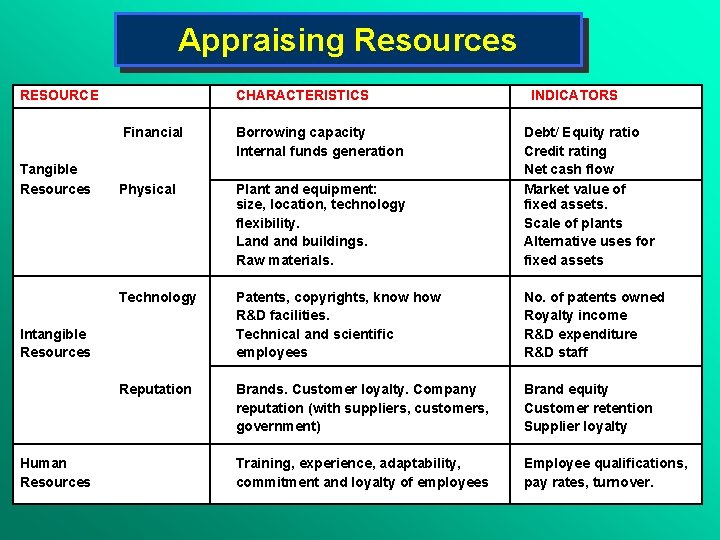
Appraising Resources RESOURCE Financial Plant and equipment: size, location, technology flexibility. Land buildings. Raw materials. Technology Patents, copyrights, know how R&D facilities. Technical and scientific employees No. of patents owned Royalty income R&D expenditure R&D staff Reputation Brands. Customer loyalty. Company reputation (with suppliers, customers, government) Brand equity Customer retention Supplier loyalty Training, experience, adaptability, commitment and loyalty of employees Employee qualifications, pay rates, turnover. Intangible Resources Borrowing capacity Internal funds generation INDICATORS Debt/ Equity ratio Credit rating Net cash flow Market value of fixed assets. Scale of plants Alternative uses for fixed assets Tangible Resources Physical Human Resources CHARACTERISTICS
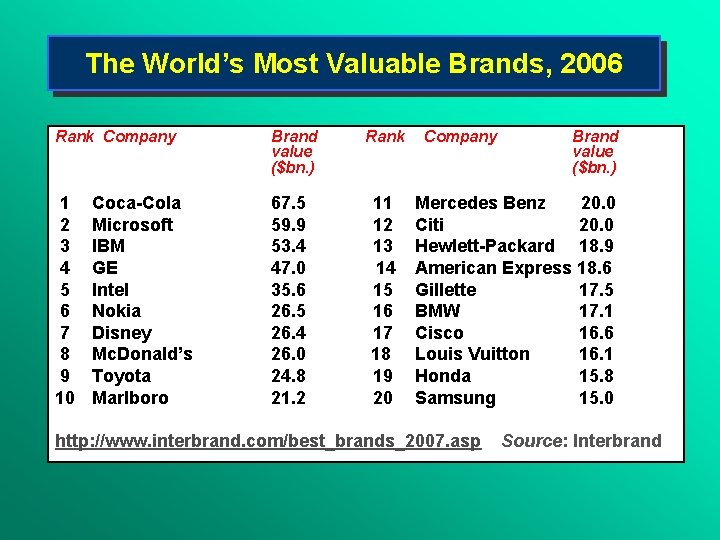
The World’s Most Valuable Brands, 2006 Rank Company Brand value ($bn. ) 1 2 3 4 5 6 7 8 9 10 67. 5 11 Mercedes Benz 20. 0 59. 9 12 Citi 20. 0 53. 4 13 Hewlett-Packard 18. 9 47. 0 14 American Express 18. 6 35. 6 15 Gillette 17. 5 26. 5 16 BMW 17. 1 26. 4 17 Cisco 16. 6 26. 0 18 Louis Vuitton 16. 1 24. 8 19 Honda 15. 8 21. 2 20 Samsung 15. 0 Coca-Cola Microsoft IBM GE Intel Nokia Disney Mc. Donald’s Toyota Marlboro Rank Company Brand value ($bn. ) http: //www. interbrand. com/best_brands_2007. asp Source: Interbrand
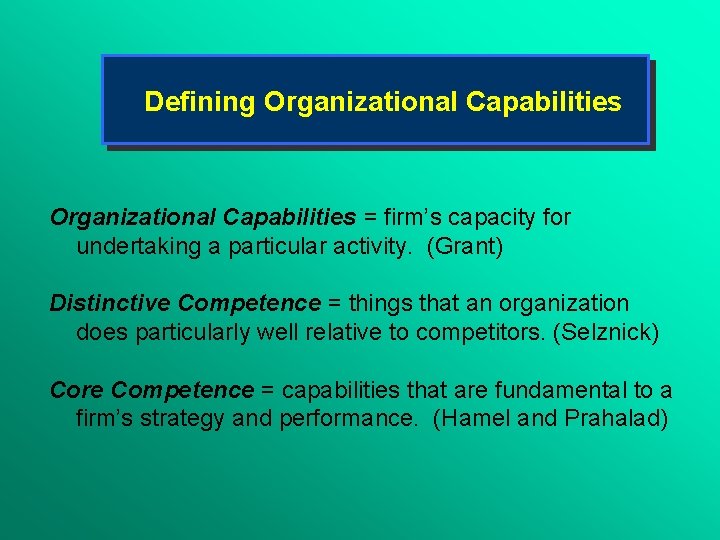
Defining Organizational Capabilities = firm’s capacity for undertaking a particular activity. (Grant) Distinctive Competence = things that an organization does particularly well relative to competitors. (Selznick) Core Competence = capabilities that are fundamental to a firm’s strategy and performance. (Hamel and Prahalad)
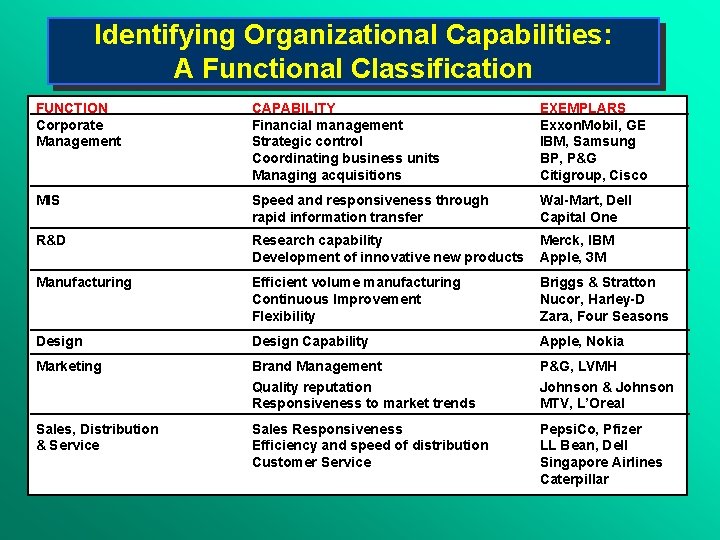
Identifying Organizational Capabilities: A Functional Classification FUNCTION Corporate Management CAPABILITY Financial management Strategic control Coordinating business units Managing acquisitions EXEMPLARS Exxon. Mobil, GE IBM, Samsung BP, P&G Citigroup, Cisco MIS Speed and responsiveness through rapid information transfer Wal-Mart, Dell Capital One R&D Research capability Development of innovative new products Merck, IBM Apple, 3 M Manufacturing Efficient volume manufacturing Continuous Improvement Flexibility Briggs & Stratton Nucor, Harley-D Zara, Four Seasons Design Capability Apple, Nokia Marketing Brand Management Quality reputation Responsiveness to market trends P&G, LVMH Johnson & Johnson MTV, L’Oreal Sales, Distribution & Service Sales Responsiveness Efficiency and speed of distribution Customer Service Pepsi. Co, Pfizer LL Bean, Dell Singapore Airlines Caterpillar
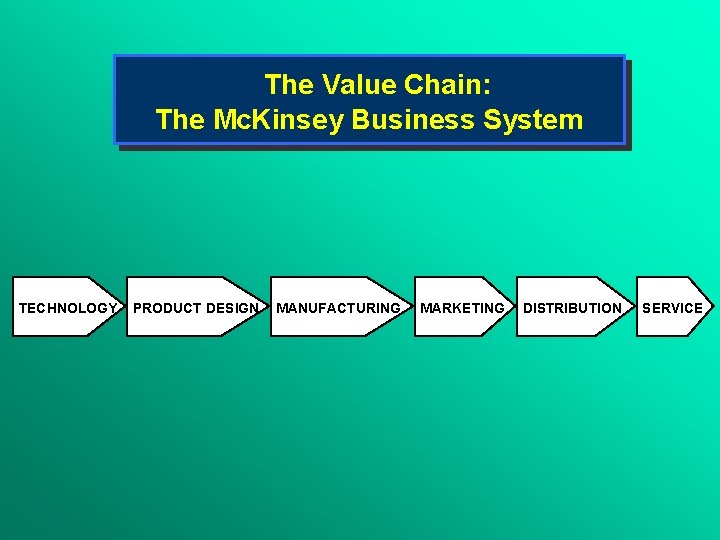
The Value Chain: The Mc. Kinsey Business System TECHNOLOGY PRODUCT DESIGN MANUFACTURING MARKETING DISTRIBUTION SERVICE
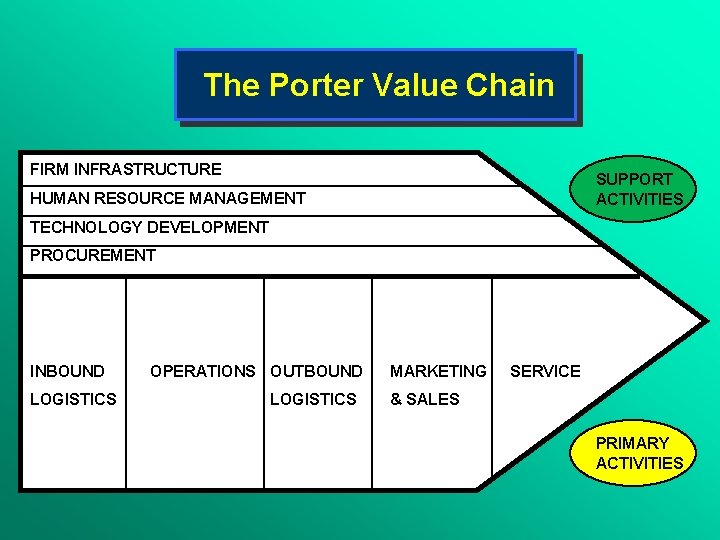
The Porter Value Chain FIRM INFRASTRUCTURE SUPPORT ACTIVITIES HUMAN RESOURCE MANAGEMENT TECHNOLOGY DEVELOPMENT PROCUREMENT INBOUND LOGISTICS OPERATIONS OUTBOUND LOGISTICS MARKETING SERVICE & SALES PRIMARY ACTIVITIES
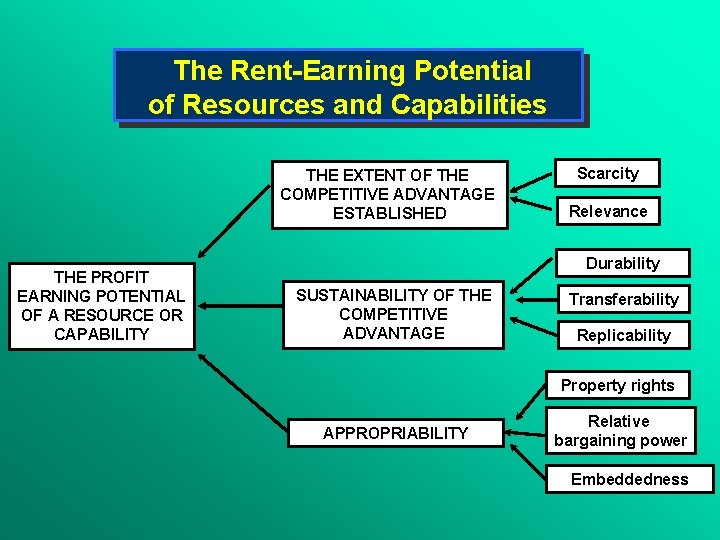
The Rent-Earning Potential of Resources and Capabilities THE EXTENT OF THE COMPETITIVE ADVANTAGE ESTABLISHED THE PROFIT EARNING POTENTIAL OF A RESOURCE OR CAPABILITY Scarcity Relevance Durability SUSTAINABILITY OF THE COMPETITIVE ADVANTAGE Transferability Replicability Property rights APPROPRIABILITY Relative bargaining power Embeddedness
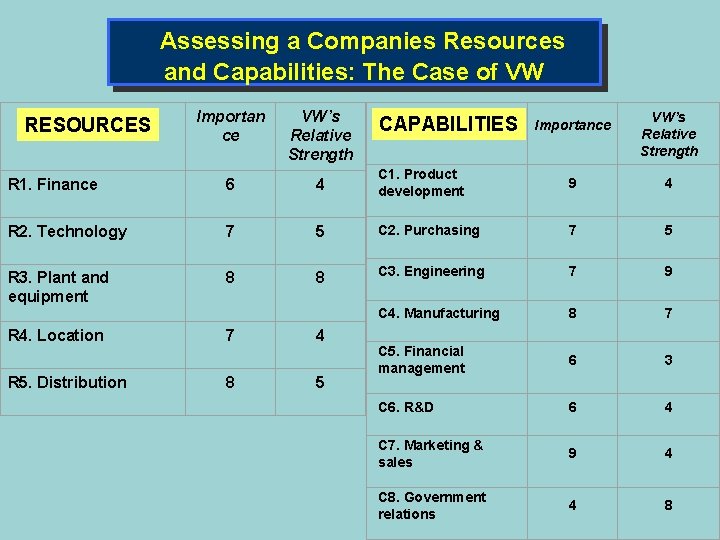
Assessing a Companies Resources and Capabilities: The Case of VW Importan ce VW’s Relative Strength R 1. Finance 6 4 C 1. Product development 9 4 R 2. Technology 7 5 C 2. Purchasing 7 5 R 3. Plant and equipment 8 8 C 3. Engineering 7 9 C 4. Manufacturing 8 7 R 4. Location 7 C 5. Financial management 6 3 C 6. R&D 6 4 C 7. Marketing & sales 9 4 C 8. Government relations 4 8 RESOURCES R 5. Distribution 8 4 5 CAPABILITIES Importance VW’s Relative Strength
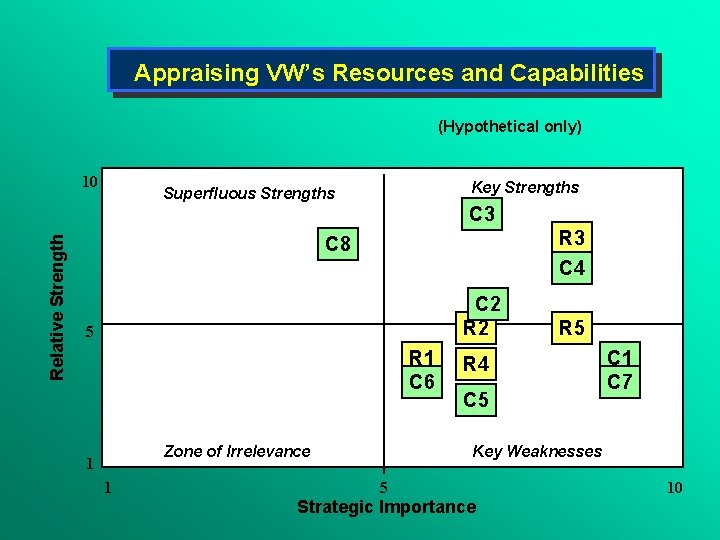
Appraising VW’s Resources and Capabilities (Hypothetical only) 10 Key Strengths Superfluous Strengths Relative Strength C 3 R 3 C 4 C 8 C 2 R 2 5 R 1 C 6 Zone of Irrelevance 1 1 R 5 R 4 C 5 C 1 C 7 Key Weaknesses 5 Strategic Importance 10
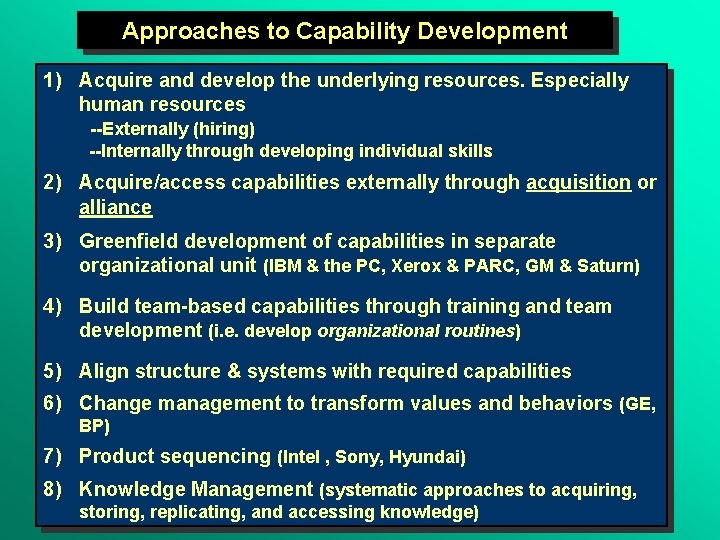
Approaches to Capability Development 1) Acquire and develop the underlying resources. Especially human resources --Externally (hiring) --Internally through developing individual skills 2) Acquire/access capabilities externally through acquisition or alliance 3) Greenfield development of capabilities in separate organizational unit (IBM & the PC, Xerox & PARC, GM & Saturn) 4) Build team-based capabilities through training and team development (i. e. develop organizational routines) 5) Align structure & systems with required capabilities 6) Change management to transform values and behaviors (GE, BP) 7) Product sequencing (Intel , Sony, Hyundai) 8) Knowledge Management (systematic approaches to acquiring, storing, replicating, and accessing knowledge)
COMPETITIVE ADVANTAGE AND THE SCOPE OF THE FIRM
From Business Strategy to Corporate Strategy: The Scope of the Firm • Business Strategy is concerned with how a firm computes within a particular market • Corporate Strategy is concerned with where a firm competes, i. e. the scope of its activities • The dimensions of scope are • product scope • vertical scope • geographical scope
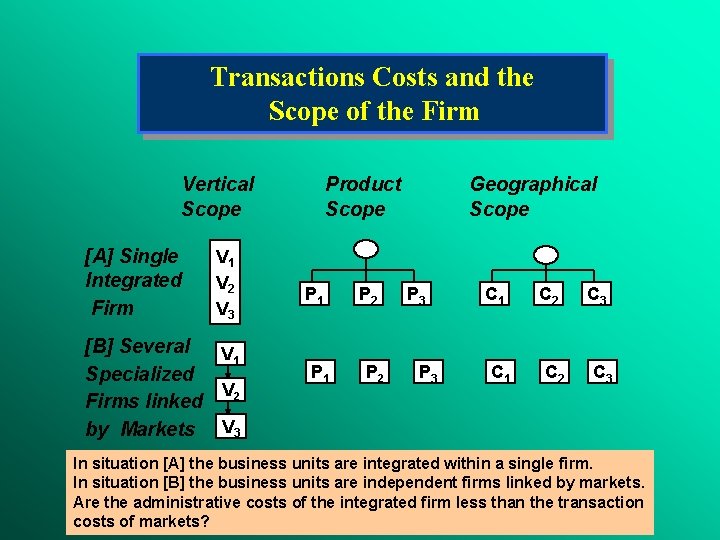
Transactions Costs and the Scope of the Firm Vertical Scope [A] Single Integrated Firm V 1 V 2 V 3 [B] Several V 1 Specialized V 2 Firms linked by Markets V 3 Product Scope P 1 P 2 Geographical Scope P 3 C 1 C 2 C 3 In situation [A] the business units are integrated within a single firm. In situation [B] the business units are independent firms linked by markets. Are the administrative costs of the integrated firm less than the transaction costs of markets?
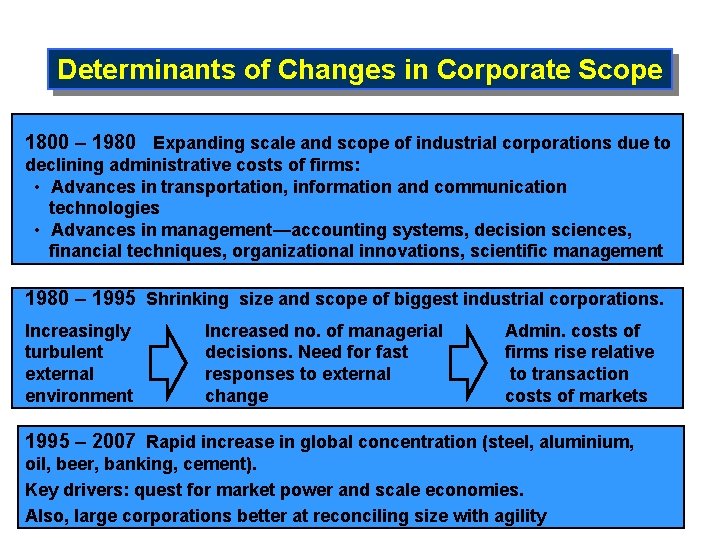
Determinants of Changes in Corporate Scope 1800 – 1980 Expanding scale and scope of industrial corporations due to declining administrative costs of firms: • Advances in transportation, information and communication technologies • Advances in management—accounting systems, decision sciences, financial techniques, organizational innovations, scientific management 1980 – 1995 Shrinking size and scope of biggest industrial corporations. Increasingly turbulent external environment Increased no. of managerial decisions. Need for fast responses to external change Admin. costs of firms rise relative to transaction costs of markets 1995 – 2007 Rapid increase in global concentration (steel, aluminium, oil, beer, banking, cement). Key drivers: quest for market power and scale economies. Also, large corporations better at reconciling size with agility
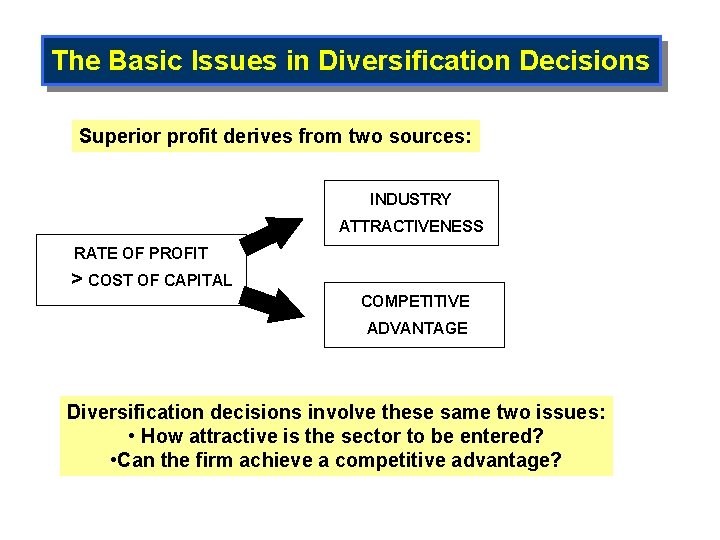
The Basic Issues in Diversification Decisions Superior profit derives from two sources: INDUSTRY ATTRACTIVENESS RATE OF PROFIT > COST OF CAPITAL COMPETITIVE ADVANTAGE Diversification decisions involve these same two issues: • How attractive is the sector to be entered? • Can the firm achieve a competitive advantage?
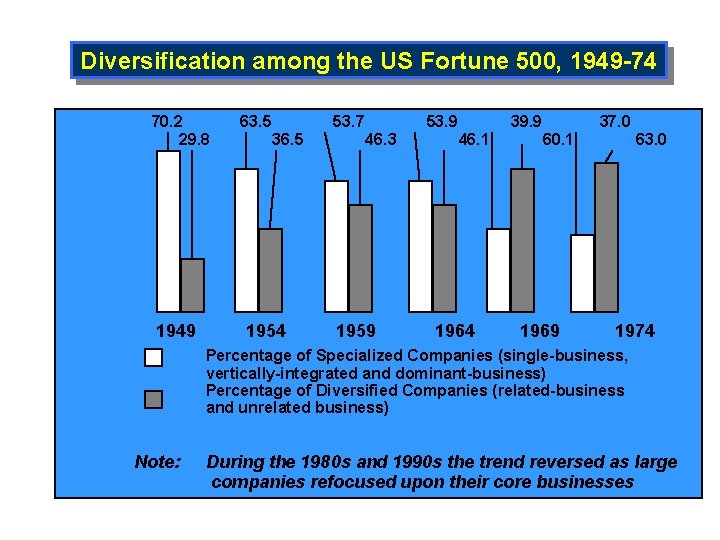
Diversification among the US Fortune 500, 1949 -74 70. 2 63. 5 53. 7 53. 9 39. 9 37. 0 29. 8 36. 5 46. 3 46. 1 60. 1 63. 0 1949 1954 1959 1964 1969 1974 Percentage of Specialized Companies (single-business, vertically-integrated and dominant-business) Percentage of Diversified Companies (related-business and unrelated business) Note: During the 1980 s and 1990 s the trend reversed as large companies refocused upon their core businesses
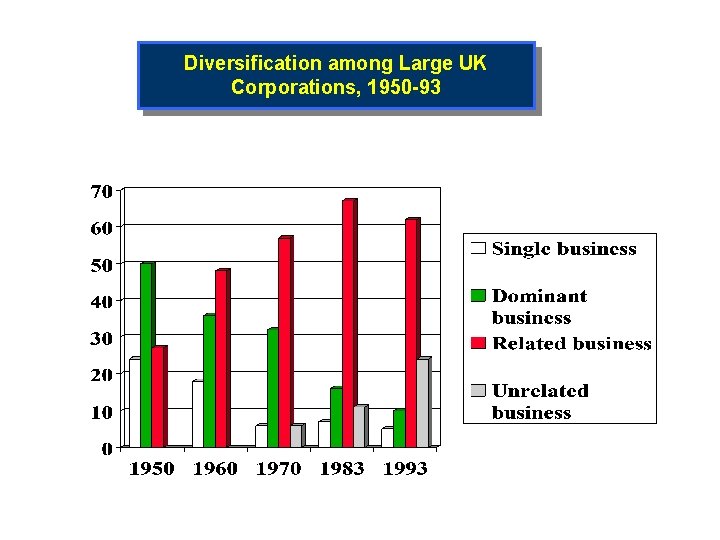
Diversification among Large UK Corporations, 1950 -93
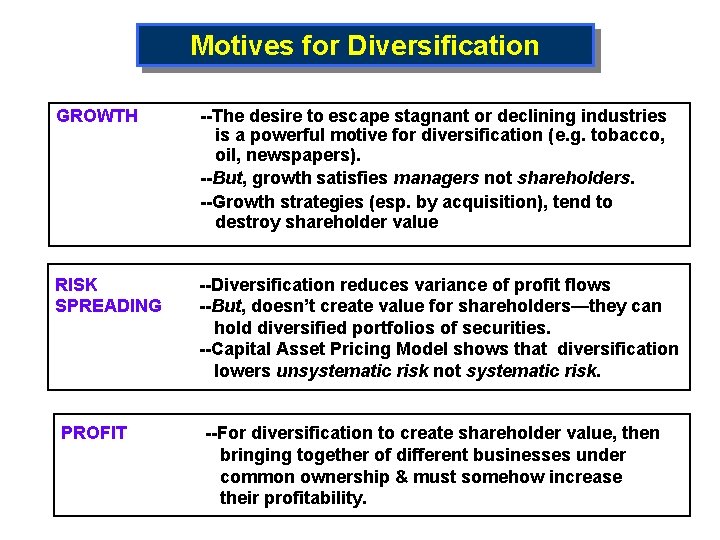
Motives for Diversification GROWTH RISK SPREADING PROFIT --The desire to escape stagnant or declining industries is a powerful motive for diversification (e. g. tobacco, oil, newspapers). --But, growth satisfies managers not shareholders. --Growth strategies (esp. by acquisition), tend to destroy shareholder value --Diversification reduces variance of profit flows --But, doesn’t create value for shareholders—they can hold diversified portfolios of securities. --Capital Asset Pricing Model shows that diversification lowers unsystematic risk not systematic risk. --For diversification to create shareholder value, then bringing together of different businesses under common ownership & must somehow increase their profitability.
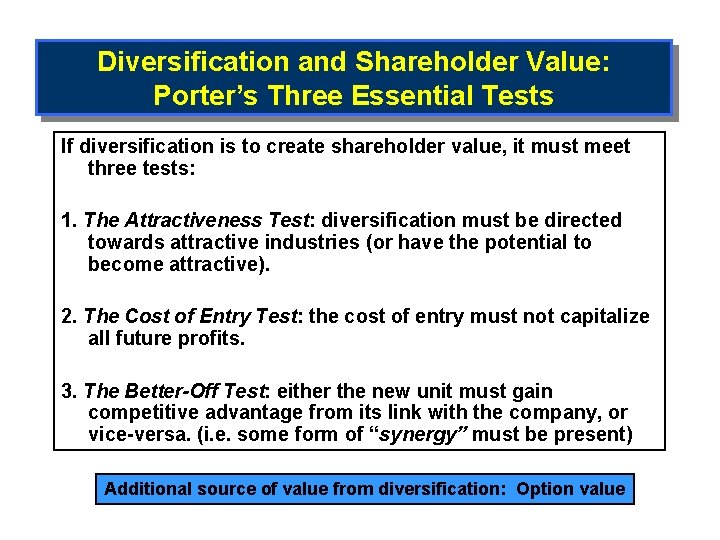
Diversification and Shareholder Value: Porter’s Three Essential Tests If diversification is to create shareholder value, it must meet three tests: 1. The Attractiveness Test: diversification must be directed towards attractive industries (or have the potential to become attractive). 2. The Cost of Entry Test: the cost of entry must not capitalize all future profits. 3. The Better-Off Test: either the new unit must gain competitive advantage from its link with the company, or vice-versa. (i. e. some form of “synergy” must be present) Additional source of value from diversification: Option value
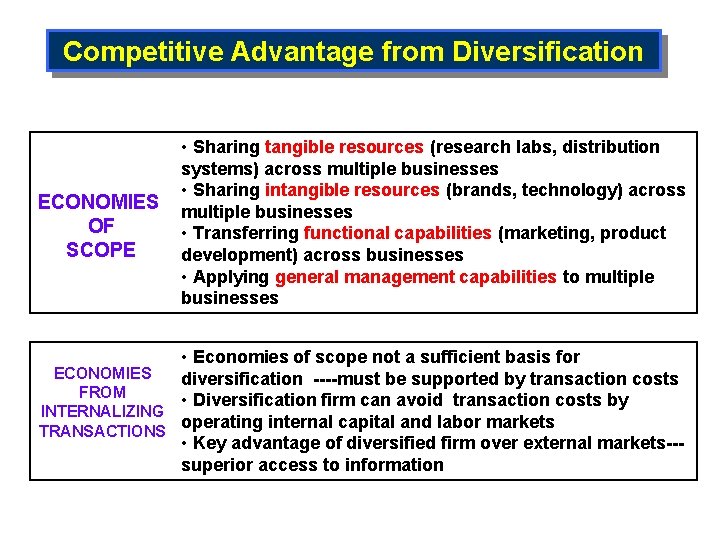
Competitive Advantage from Diversification • Sharing tangible resources (research labs, distribution systems) across multiple businesses • Sharing intangible resources (brands, technology) across ECONOMIES multiple businesses OF • Transferring functional capabilities (marketing, product SCOPE development) across businesses • Applying general management capabilities to multiple businesses • Economies of scope not a sufficient basis for ECONOMIES diversification ----must be supported by transaction costs FROM • Diversification firm can avoid transaction costs by INTERNALIZING operating internal capital and labor markets TRANSACTIONS • Key advantage of diversified firm over external markets--- superior access to information
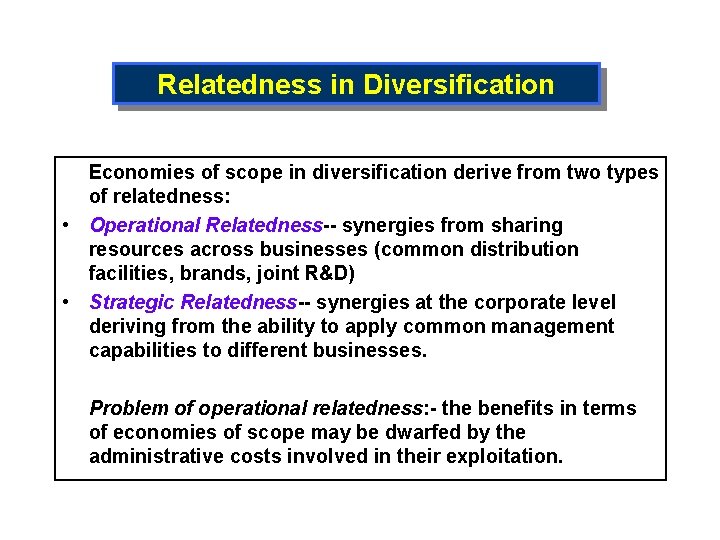
Relatedness in Diversification Economies of scope in diversification derive from two types of relatedness: • Operational Relatedness-- synergies from sharing resources across businesses (common distribution facilities, brands, joint R&D) • Strategic Relatedness-- synergies at the corporate level deriving from the ability to apply common management capabilities to different businesses. Problem of operational relatedness: - the benefits in terms of economies of scope may be dwarfed by the administrative costs involved in their exploitation.
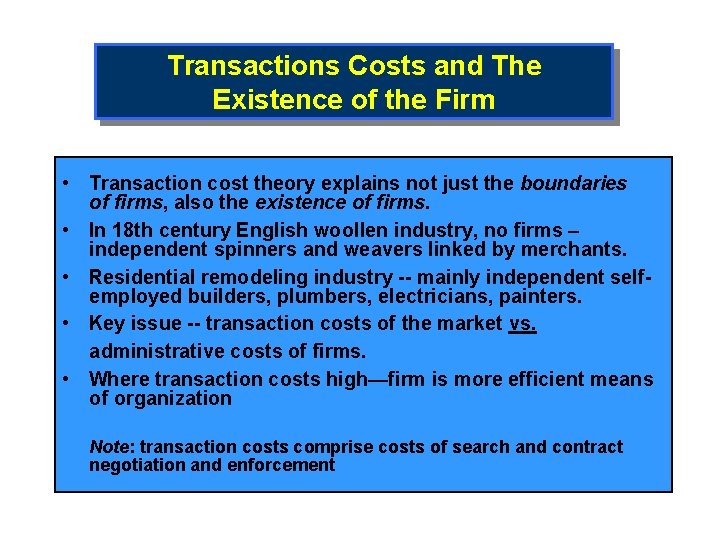
Transactions Costs and The Existence of the Firm • Transaction cost theory explains not just the boundaries of firms, also the existence of firms. • In 18 th century English woollen industry, no firms – independent spinners and weavers linked by merchants. • Residential remodeling industry -- mainly independent self employed builders, plumbers, electricians, painters. • Key issue -- transaction costs of the market vs. administrative costs of firms. • Where transaction costs high—firm is more efficient means of organization Note: transaction costs comprise costs of search and contract negotiation and enforcement
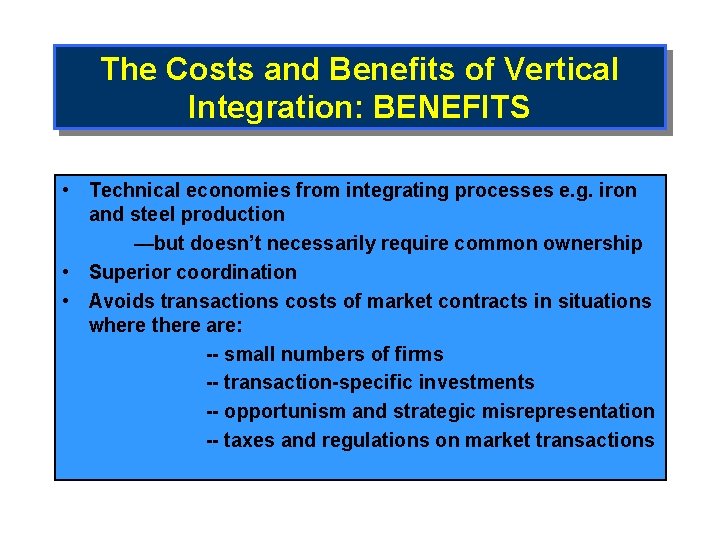
The Costs and Benefits of Vertical Integration: BENEFITS • Technical economies from integrating processes e. g. iron and steel production —but doesn’t necessarily require common ownership • Superior coordination • Avoids transactions costs of market contracts in situations where there are: -- small numbers of firms -- transaction-specific investments -- opportunism and strategic misrepresentation -- taxes and regulations on market transactions
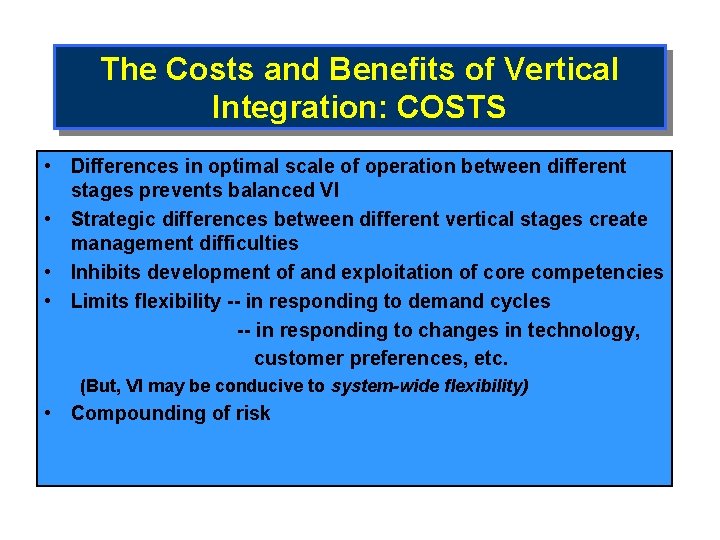
The Costs and Benefits of Vertical Integration: COSTS • Differences in optimal scale of operation between different stages prevents balanced VI • Strategic differences between different vertical stages create management difficulties • Inhibits development of and exploitation of core competencies • Limits flexibility -- in responding to demand cycles -- in responding to changes in technology, customer preferences, etc. (But, VI may be conducive to system-wide flexibility) • Compounding of risk
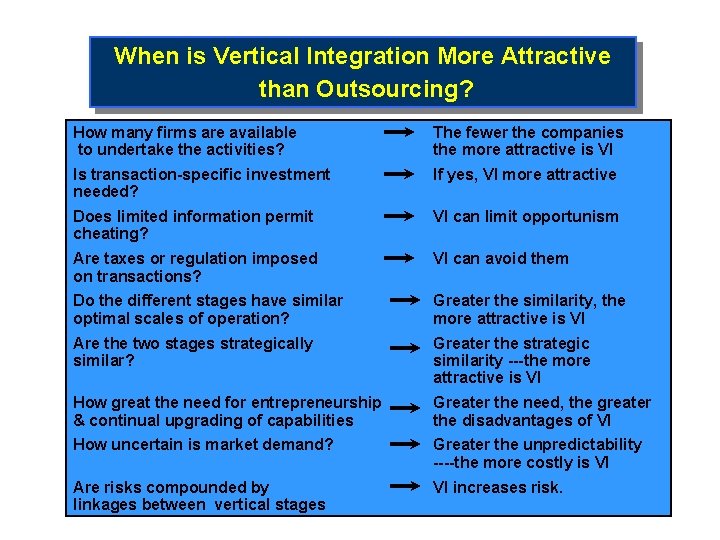
When is Vertical Integration More Attractive than Outsourcing? How many firms are available to undertake the activities? The fewer the companies the more attractive is VI Is transaction-specific investment needed? If yes, VI more attractive Does limited information permit cheating? VI can limit opportunism Are taxes or regulation imposed on transactions? VI can avoid them Do the different stages have similar optimal scales of operation? Greater the similarity, the more attractive is VI Are the two stages strategically similar? Greater the strategic similarity ---the more attractive is VI How great the need for entrepreneurship & continual upgrading of capabilities Greater the need, the greater the disadvantages of VI How uncertain is market demand? Greater the unpredictability ----the more costly is VI Are risks compounded by linkages between vertical stages VI increases risk.
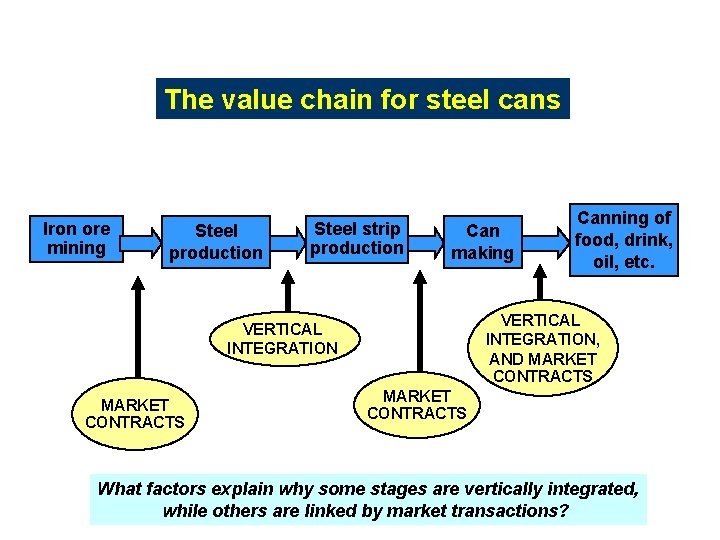
The value chain for steel cans Iron ore mining Steel production Steel strip production Can making VERTICAL INTEGRATION, AND MARKET CONTRACTS VERTICAL INTEGRATION MARKET CONTRACTS Canning of food, drink, oil, etc. MARKET CONTRACTS What factors explain why some stages are vertically integrated, while others are linked by market transactions?
Designing Vertical Relationships: Long-Term Contracts and Quasi-Vertical Integration • Intermediate between spot transactions and vertical integration are several types of vertical relationships ---such relationships may combine benefits of both market transactions and internalization • Key issues in designing vertical relationships -- How is risk allocated between the parties? -- Are the incentives appropriate?
Recent Trends in Vertical Relationships • From competitive contracting to supplier partnerships, e. g. in autos • From vertical integration to outsourcing (not just components, also IT, distribution, and administrative services). • Diffusion of franchising • Technology partnerships (e. g. IBM- Apple; Canon- HP) • Inter-firm networks General conclusion: boundaries between firms and markets becoming increasingly blurred.
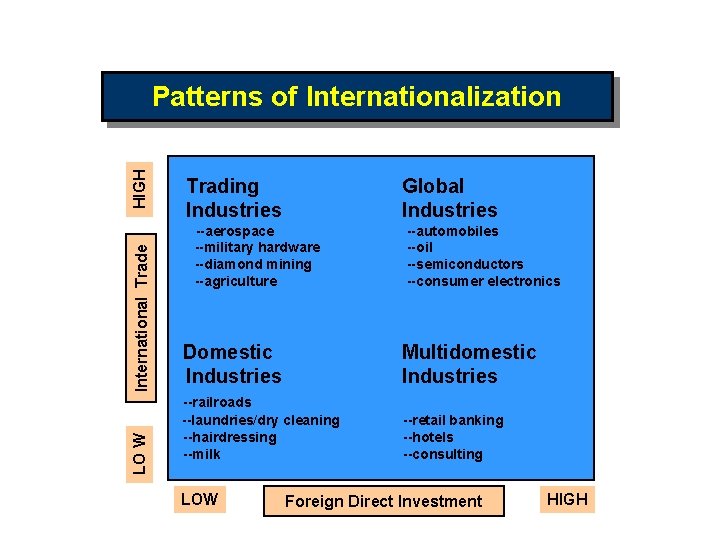
LO W International Trade HIGH Patterns of Internationalization Trading Industries Global Industries --aerospace --automobiles --oil --semiconductors --consumer electronics --military hardware --diamond mining --agriculture Domestic Industries --railroads --laundries/dry cleaning --hairdressing --milk LOW Multidomestic Industries --retail banking --hotels --consulting Foreign Direct Investment HIGH
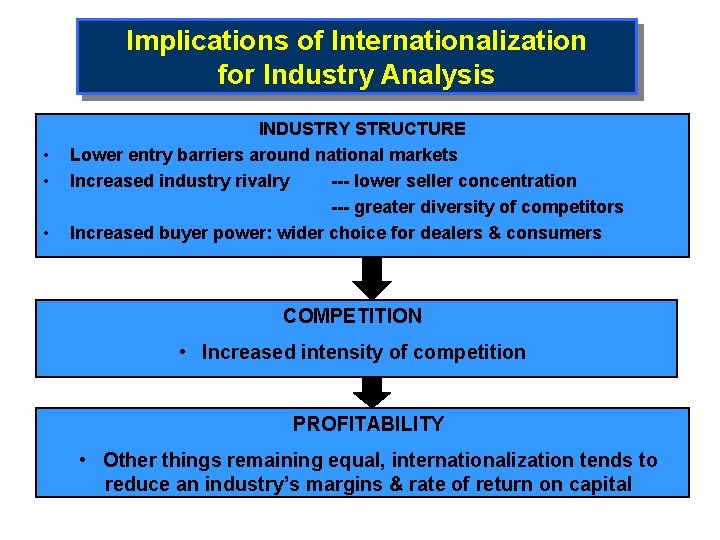
Implications of Internationalization for Industry Analysis • • • INDUSTRY STRUCTURE Lower entry barriers around national markets Increased industry rivalry --- lower seller concentration --- greater diversity of competitors Increased buyer power: wider choice for dealers & consumers COMPETITION • Increased intensity of competition PROFITABILITY • Other things remaining equal, internationalization tends to reduce an industry’s margins & rate of return on capital
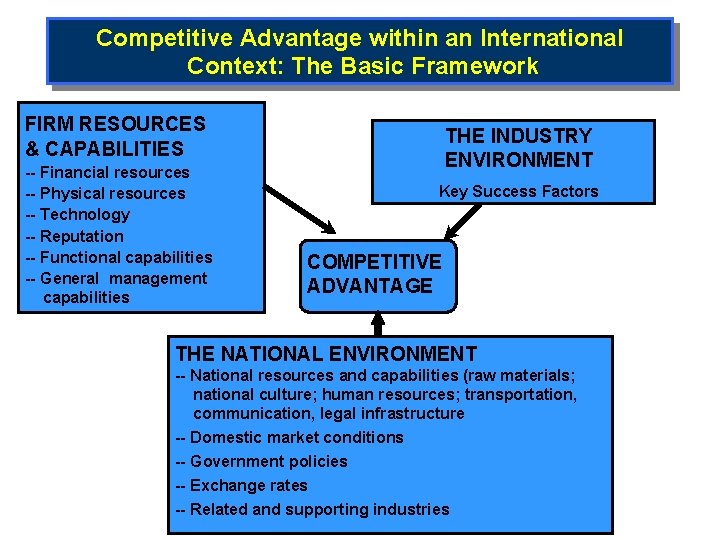
Competitive Advantage within an International Context: The Basic Framework FIRM RESOURCES & CAPABILITIES -- Financial resources -- Physical resources -- Technology -- Reputation -- Functional capabilities -- General management capabilities THE INDUSTRY ENVIRONMENT Key Success Factors COMPETITIVE ADVANTAGE THE NATIONAL ENVIRONMENT -- National resources and capabilities (raw materials; national culture; human resources; transportation, communication, legal infrastructure -- Domestic market conditions -- Government policies -- Exchange rates -- Related and supporting industries
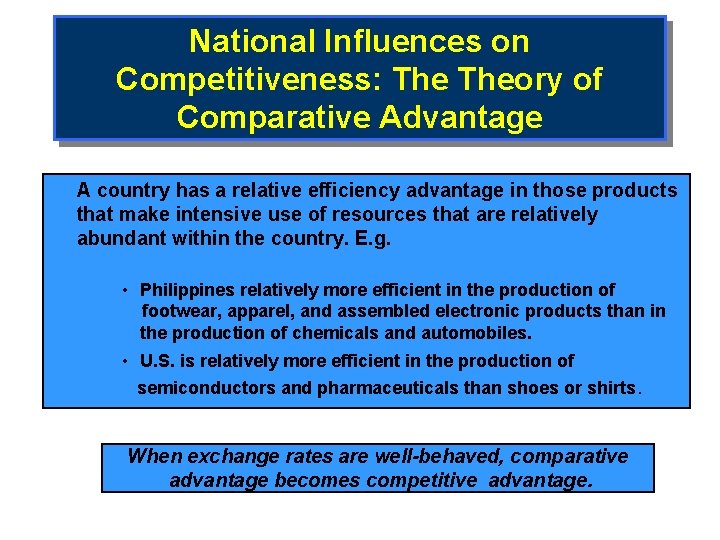
National Influences on Competitiveness: Theory of Comparative Advantage A country has a relative efficiency advantage in those products that make intensive use of resources that are relatively abundant within the country. E. g. • Philippines relatively more efficient in the production of footwear, apparel, and assembled electronic products than in the production of chemicals and automobiles. • U. S. is relatively more efficient in the production of semiconductors and pharmaceuticals than shoes or shirts. When exchange rates are well-behaved, comparative advantage becomes competitive advantage.
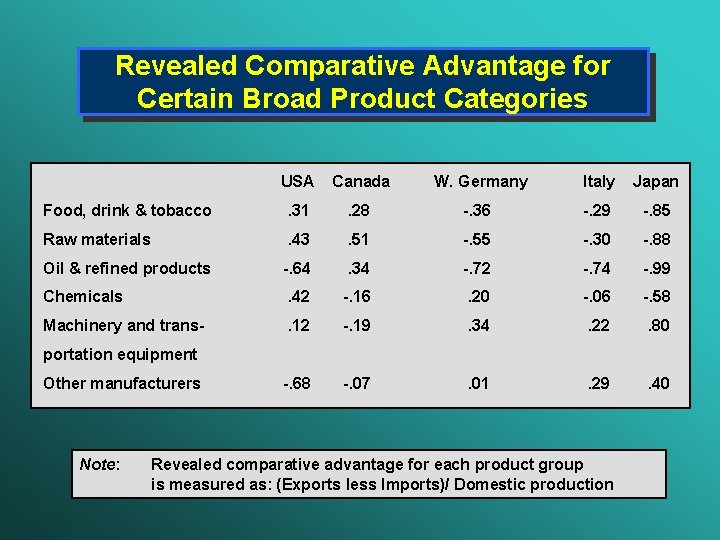
Revealed Comparative Advantage for Certain Broad Product Categories USA Canada W. Germany Italy Japan Food, drink & tobacco . 31 . 28 -. 36 -. 29 -. 85 Raw materials . 43 . 51 -. 55 -. 30 -. 88 Oil & refined products -. 64 . 34 -. 72 -. 74 -. 99 Chemicals . 42 -. 16 . 20 -. 06 -. 58 Machinery and trans- . 12 -. 19 . 34 . 22 . 80 -. 68 -. 07 . 01 . 29 . 40 portation equipment Other manufacturers Note: Revealed comparative advantage for each product group is measured as: (Exports less Imports)/ Domestic production
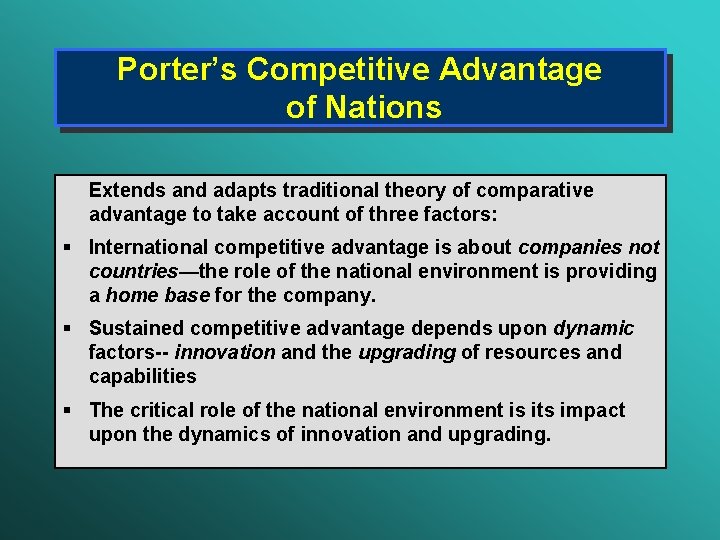
Porter’s Competitive Advantage of Nations Extends and adapts traditional theory of comparative advantage to take account of three factors: § International competitive advantage is about companies not countries—the role of the national environment is providing a home base for the company. § Sustained competitive advantage depends upon dynamic factors-- innovation and the upgrading of resources and capabilities § The critical role of the national environment is its impact upon the dynamics of innovation and upgrading.
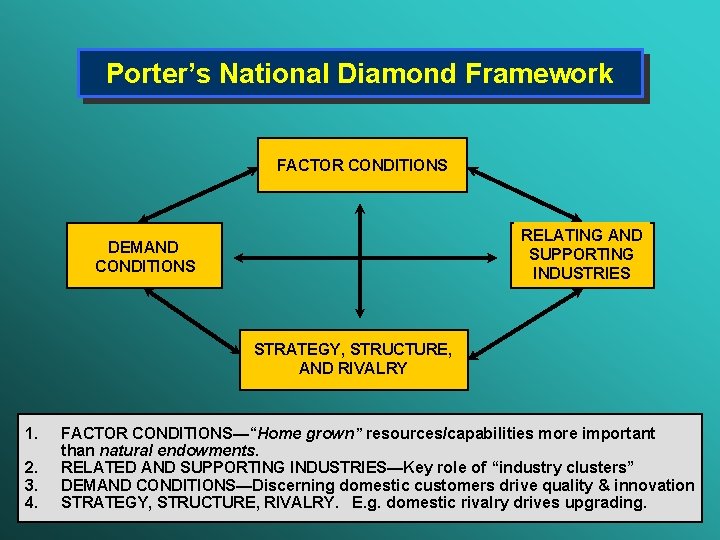
Porter’s National Diamond Framework FACTOR CONDITIONS RELATING AND SUPPORTING INDUSTRIES DEMAND CONDITIONS STRATEGY, STRUCTURE, AND RIVALRY 1. 2. 3. 4. FACTOR CONDITIONS—“Home grown” resources/capabilities more important than natural endowments. RELATED AND SUPPORTING INDUSTRIES—Key role of “industry clusters” DEMAND CONDITIONS—Discerning domestic customers drive quality & innovation STRATEGY, STRUCTURE, RIVALRY. E. g. domestic rivalry drives upgrading.
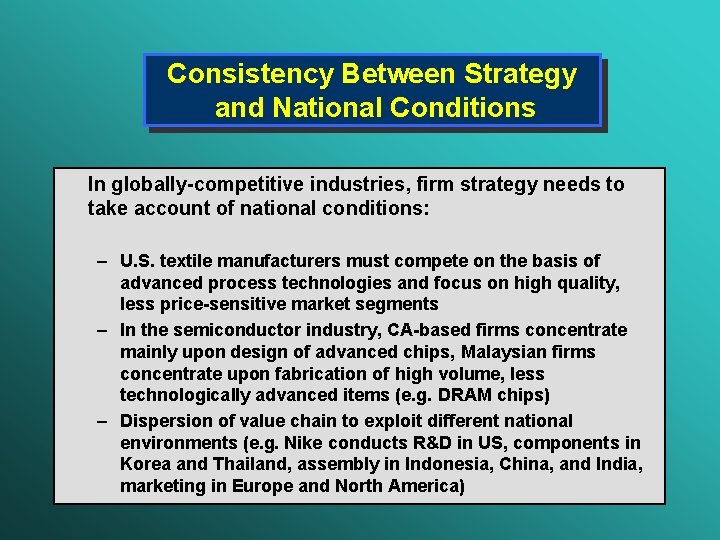
Consistency Between Strategy and National Conditions In globally-competitive industries, firm strategy needs to take account of national conditions: – U. S. textile manufacturers must compete on the basis of advanced process technologies and focus on high quality, less price-sensitive market segments – In the semiconductor industry, CA-based firms concentrate mainly upon design of advanced chips, Malaysian firms concentrate upon fabrication of high volume, less technologically advanced items (e. g. DRAM chips) – Dispersion of value chain to exploit different national environments (e. g. Nike conducts R&D in US, components in Korea and Thailand, assembly in Indonesia, China, and India, marketing in Europe and North America)
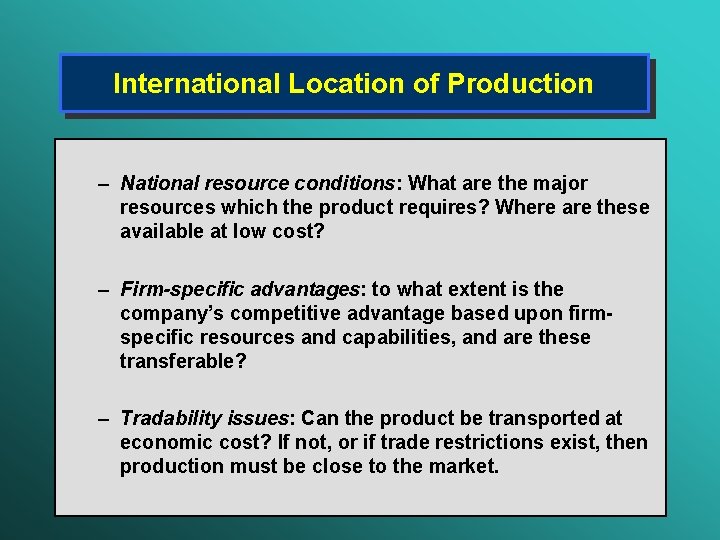
International Location of Production – National resource conditions: What are the major resources which the product requires? Where are these available at low cost? – Firm-specific advantages: to what extent is the company’s competitive advantage based upon firmspecific resources and capabilities, and are these transferable? – Tradability issues: Can the product be transported at economic cost? If not, or if trade restrictions exist, then production must be close to the market.
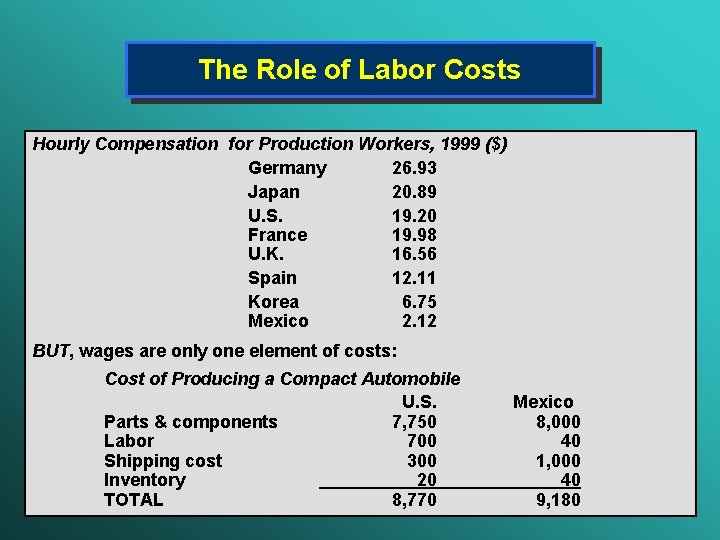
The Role of Labor Costs Hourly Compensation for Production Workers, 1999 ($) Germany 26. 93 Japan 20. 89 U. S. 19. 20 France 19. 98 U. K. 16. 56 Spain 12. 11 Korea 6. 75 Mexico 2. 12 BUT, wages are only one element of costs: Cost of Producing a Compact Automobile U. S. Mexico Parts & components 7, 750 8, 000 Labor 700 40 Shipping cost 300 1, 000 Inventory 20 40 TOTAL 8, 770 9, 180
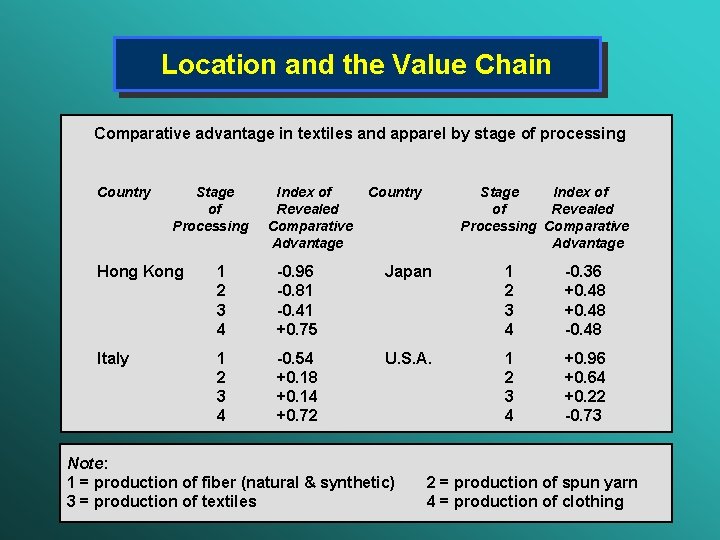
Location and the Value Chain Comparative advantage in textiles and apparel by stage of processing Country Stage of Processing Index of Revealed Comparative Advantage Country Stage Index of of Revealed Processing Comparative Advantage Hong Kong 1 2 3 4 -0. 96 -0. 81 -0. 41 +0. 75 Japan 1 2 3 4 -0. 36 +0. 48 -0. 48 Italy 1 2 3 4 -0. 54 +0. 18 +0. 14 +0. 72 U. S. A. 1 2 3 4 +0. 96 +0. 64 +0. 22 -0. 73 Note: 1 = production of fiber (natural & synthetic) 3 = production of textiles 2 = production of spun yarn 4 = production of clothing
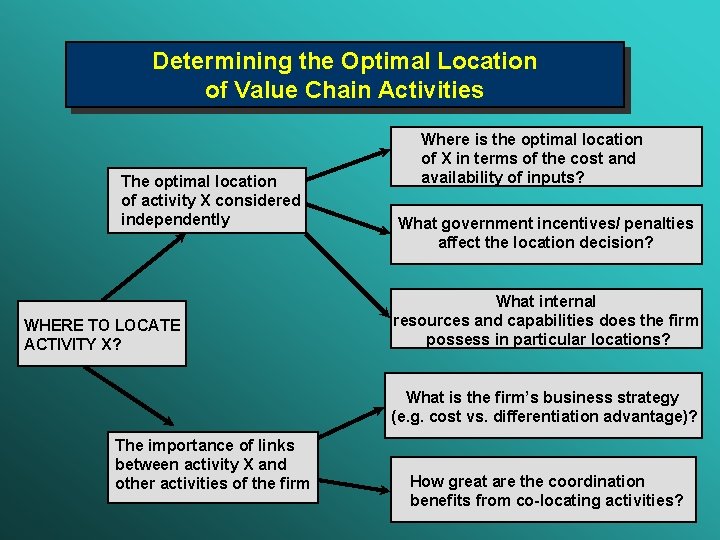
Determining the Optimal Location of Value Chain Activities The optimal location of activity X considered independently WHERE TO LOCATE ACTIVITY X? Where is the optimal location of X in terms of the cost and availability of inputs? What government incentives/ penalties affect the location decision? What internal resources and capabilities does the firm possess in particular locations? What is the firm’s business strategy (e. g. cost vs. differentiation advantage)? The importance of links between activity X and other activities of the firm How great are the coordination benefits from co-locating activities?
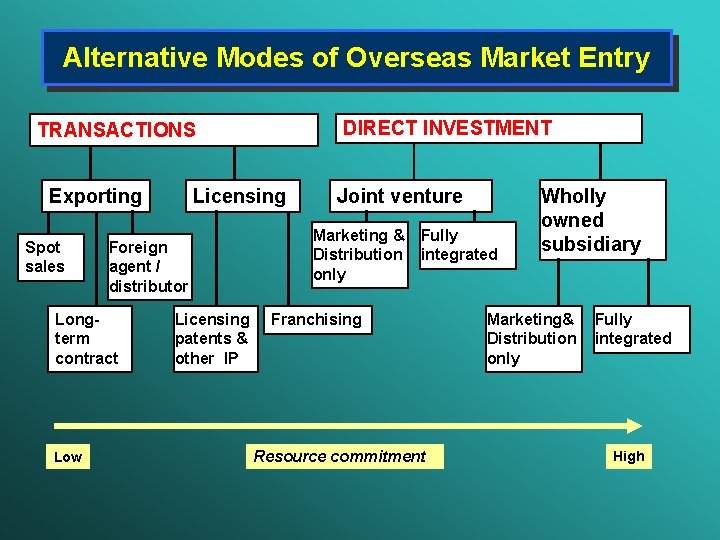
Alternative Modes of Overseas Market Entry DIRECT INVESTMENT TRANSACTIONS Exporting Spot sales Joint venture Marketing & Fully Distribution integrated only Foreign agent / distributor Longterm contract Low Licensing patents & other IP Franchising Resource commitment Wholly owned subsidiary Marketing& Fully Distribution integrated only High
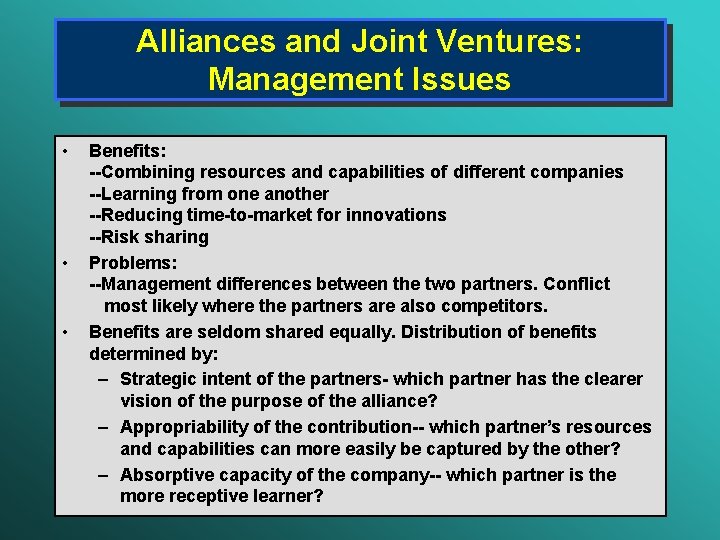
Alliances and Joint Ventures: Management Issues • • • Benefits: --Combining resources and capabilities of different companies --Learning from one another --Reducing time-to-market for innovations --Risk sharing Problems: --Management differences between the two partners. Conflict most likely where the partners are also competitors. Benefits are seldom shared equally. Distribution of benefits determined by: – Strategic intent of the partners- which partner has the clearer vision of the purpose of the alliance? – Appropriability of the contribution-- which partner’s resources and capabilities can more easily be captured by the other? – Absorptive capacity of the company-- which partner is the more receptive learner?
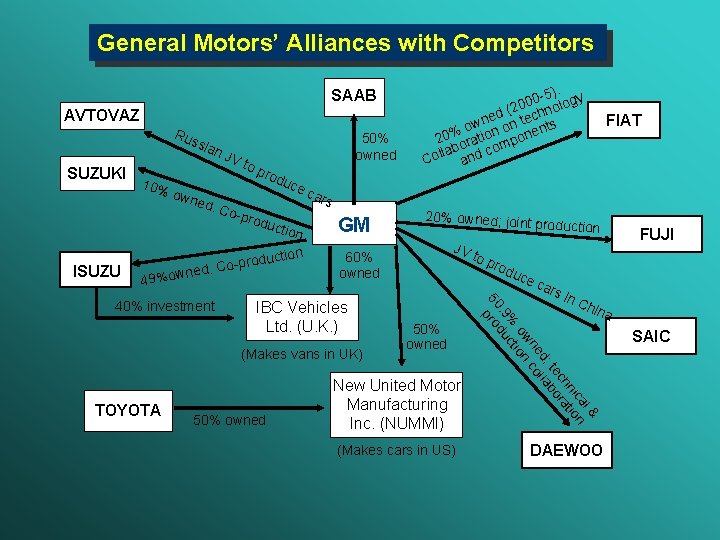
General Motors’ Alliances with Competitors SAAB AVTOVAZ Ru ssia SUZUKI ISUZU 10% n. J own ed. C V to 50% owned pro d uce o-pr o duct io n tion produc d. Co%owne 49 s GM IBC Vehicles Ltd. (U. K. ) 50% owned 20% owned; join t production JV 60% owned (Makes vans in UK) TOYOTA FIAT car to p rod uce 50% owned New United Motor Manufacturing Inc. (NUMMI) (Makes cars in US) car s in FUJI Ch ina l& ca n ni tio ch ra te bo d; lla ne co ow on % cti. 9 du 50 pro 40% investment -5). gy 0 0 (20 chnolo d e wn on te nts o 20%oration mpone co lab Col and DAEWOO SAIC
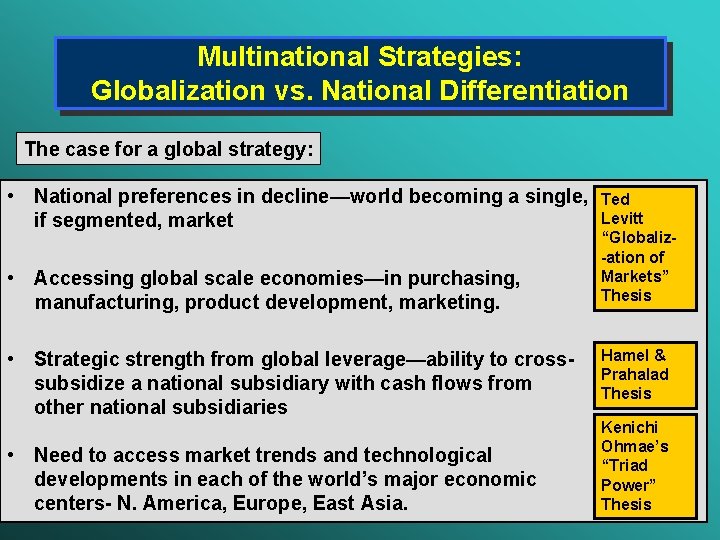
Multinational Strategies: Globalization vs. National Differentiation The case for a global strategy: • National preferences in decline—world becoming a single, if segmented, market • Accessing global scale economies—in purchasing, manufacturing, product development, marketing. • Strategic strength from global leverage—ability to cross subsidize a national subsidiary with cash flows from other national subsidiaries • Need to access market trends and technological developments in each of the world’s major economic centers- N. America, Europe, East Asia. Ted Levitt “Globaliz-ation of Markets” Thesis Hamel & Prahalad Thesis Kenichi Ohmae’s “Triad Power” Thesis
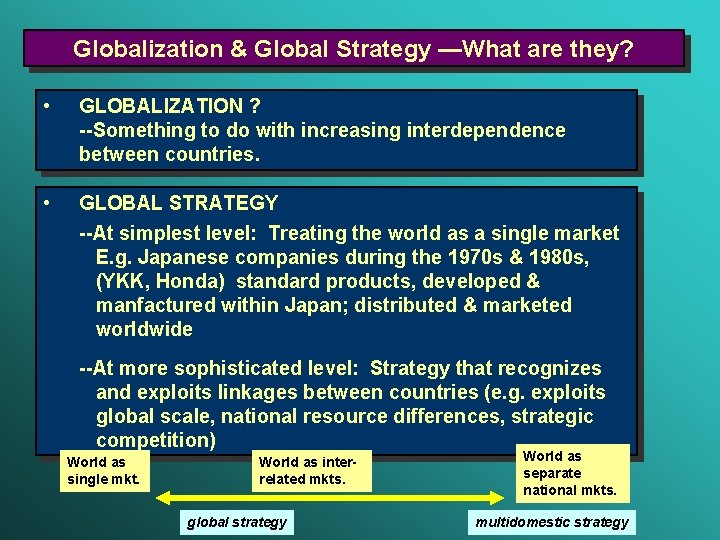
Globalization & Global Strategy —What are they? • GLOBALIZATION ? --Something to do with increasing interdependence between countries. • GLOBAL STRATEGY --At simplest level: Treating the world as a single market E. g. Japanese companies during the 1970 s & 1980 s, (YKK, Honda) standard products, developed & manfactured within Japan; distributed & marketed worldwide --At more sophisticated level: Strategy that recognizes and exploits linkages between countries (e. g. exploits global scale, national resource differences, strategic competition) World as single mkt. World as interrelated mkts. global strategy World as separate national mkts. multidomestic strategy
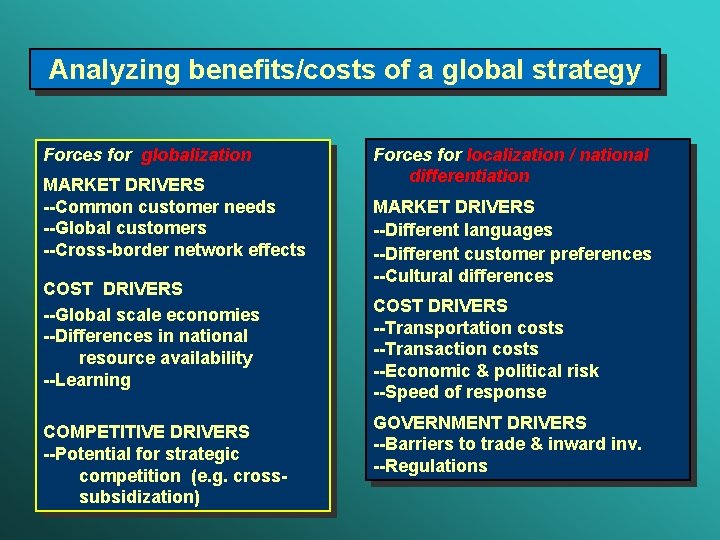
Analyzing benefits/costs of a global strategy Forces for globalization MARKET DRIVERS --Common customer needs --Global customers --Cross-border network effects COST DRIVERS --Global scale economies --Differences in national resource availability --Learning COMPETITIVE DRIVERS --Potential for strategic competition (e. g. cross- subsidization) Forces for localization / national differentiation MARKET DRIVERS --Different languages --Different customer preferences --Cultural differences COST DRIVERS --Transportation costs --Transaction costs --Economic & political risk --Speed of response GOVERNMENT DRIVERS --Barriers to trade & inward inv. --Regulations
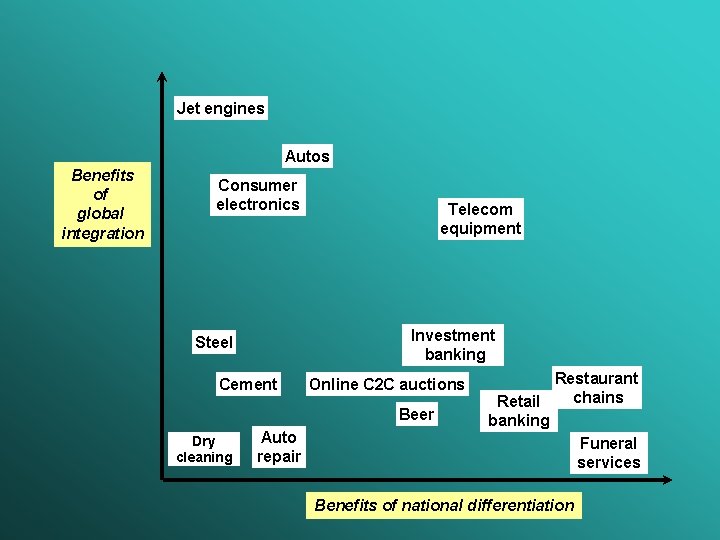
Jet engines Autos Benefits of global integration Consumer electronics Telecom equipment Investment banking Steel Cement Online C 2 C auctions Beer Dry cleaning Auto repair Restaurant chains Retail banking Funeral services Benefits of national differentiation
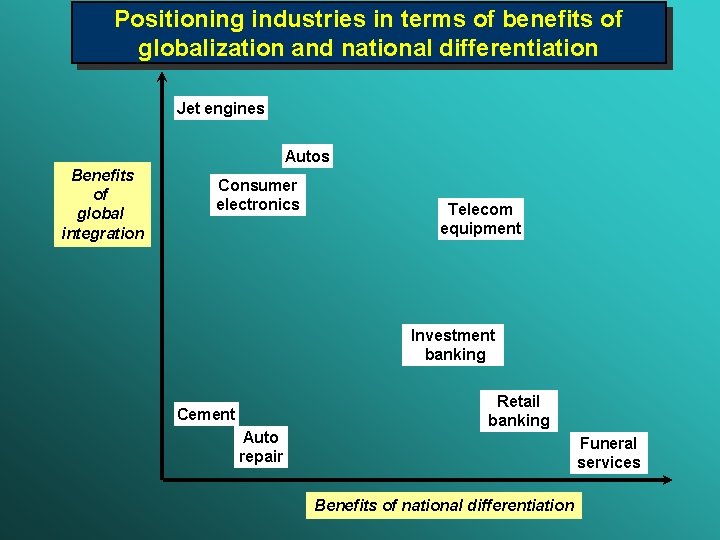
Positioning industries in terms of benefits of globalization and national differentiation Jet engines Autos Benefits of global integration Consumer electronics Telecom equipment Investment banking Cement Auto repair Retail banking Funeral services Benefits of national differentiation
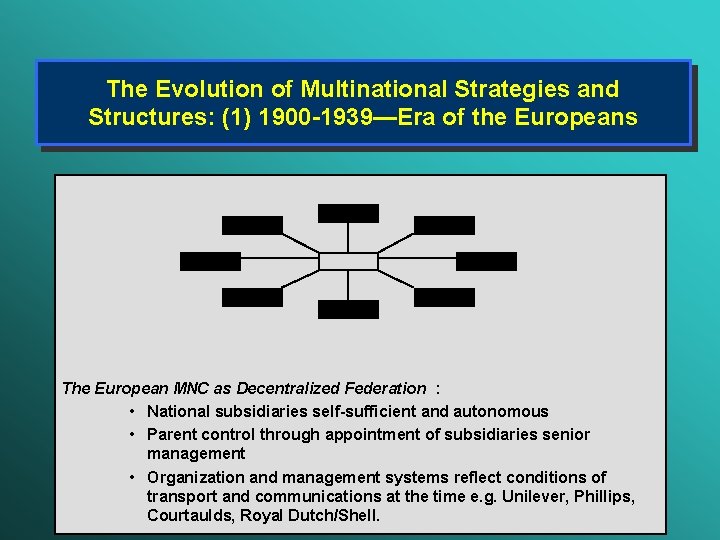
The Evolution of Multinational Strategies and Structures: (1) 1900 -1939—Era of the Europeans The European MNC as Decentralized Federation : • National subsidiaries self-sufficient and autonomous • Parent control through appointment of subsidiaries senior management • Organization and management systems reflect conditions of transport and communications at the time e. g. Unilever, Phillips, Courtaulds, Royal Dutch/Shell.
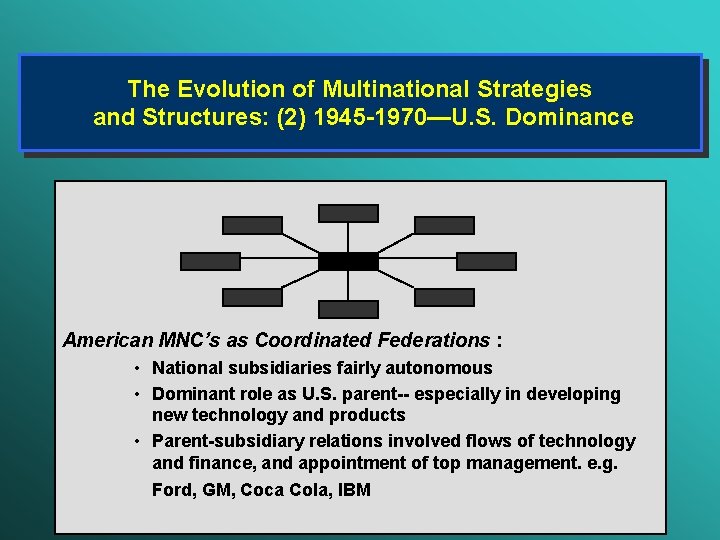
The Evolution of Multinational Strategies and Structures: (2) 1945 -1970—U. S. Dominance American MNC’s as Coordinated Federations : • National subsidiaries fairly autonomous • Dominant role as U. S. parent-- especially in developing new technology and products • Parent-subsidiary relations involved flows of technology and finance, and appointment of top management. e. g. Ford, GM, Coca Cola, IBM
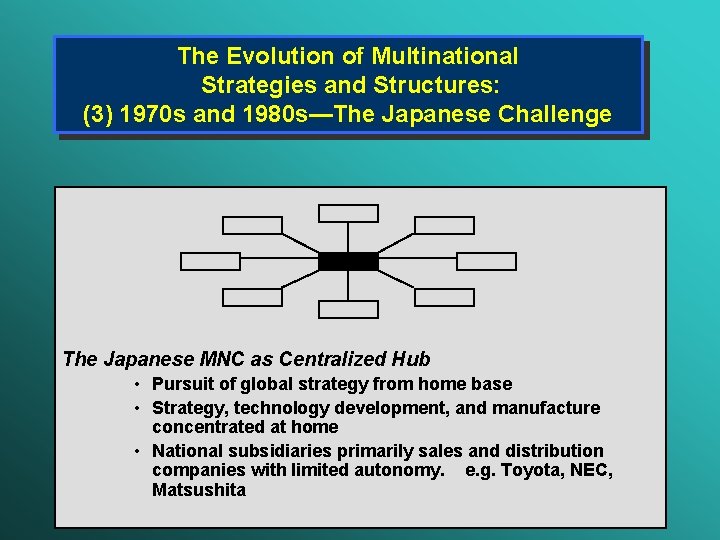
The Evolution of Multinational Strategies and Structures: (3) 1970 s and 1980 s—The Japanese Challenge The Japanese MNC as Centralized Hub • Pursuit of global strategy from home base • Strategy, technology development, and manufacture concentrated at home • National subsidiaries primarily sales and distribution companies with limited autonomy. e. g. Toyota, NEC, Matsushita
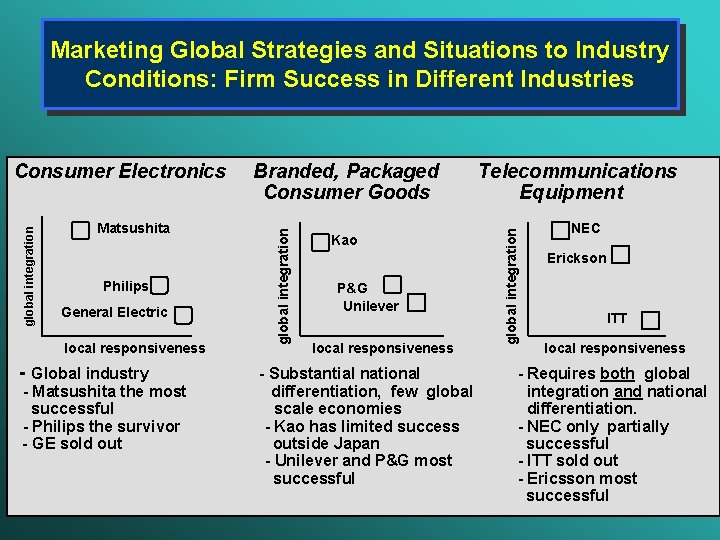
Marketing Global Strategies and Situations to Industry Conditions: Firm Success in Different Industries Philips General Electric local responsiveness Telecommunications Equipment Kao P&G Unilever local responsiveness - Global industry - Substantial national - Matsushita the most differentiation, few global successful scale economies - Philips the survivor - Kao has limited success - GE sold out outside Japan - Unilever and P&G most successful global integration Matsushita Branded, Packaged Consumer Goods global integration Consumer Electronics NEC Erickson ITT local responsiveness - Requires both global integration and national differentiation. - NEC only partially successful - ITT sold out - Ericsson most successful
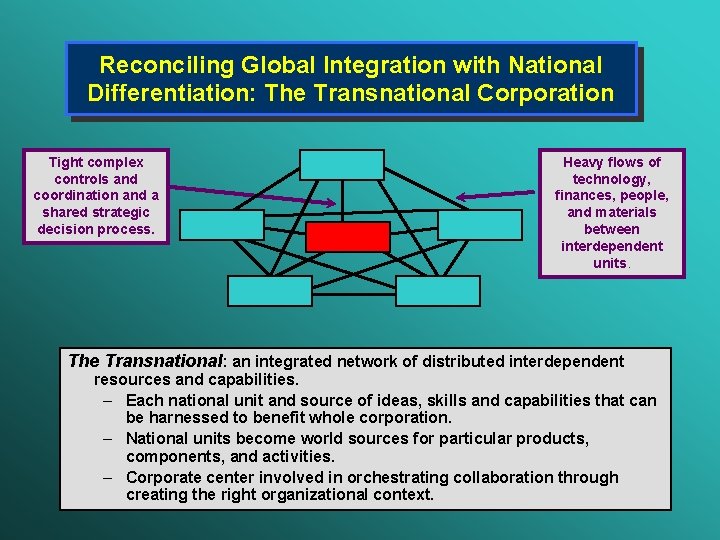
Reconciling Global Integration with National Differentiation: The Transnational Corporation Tight complex controls and coordination and a shared strategic decision process. Heavy flows of technology, finances, people, and materials between interdependent units. The Transnational: an integrated network of distributed interdependent resources and capabilities. – Each national unit and source of ideas, skills and capabilities that can be harnessed to benefit whole corporation. – National units become world sources for particular products, components, and activities. – Corporate center involved in orchestrating collaboration through creating the right organizational context.
Designing the MNC: Key Learning 1. 2. 3. 4. 5. On what basis to organize—products, geography, functions? --Where is coordination most important? --How global is the industry? How global is the firm’s strategy? If one dimension is dominant, how to coordination along the other dimensions? --Maintain single line accountability --Other dimensions of coordination can be “dotted line” relations What’s the role of HQ? --Control function --Coordination function --Exploiting scale economies in centralized provision of services The need for internal differentiation --By product/business --By function --By country Formal & informal organization
- Slides: 110