May 2006 Upgrade of the NCEP Global Ensemble
 Yuejian Zhu, Zoltan")
May 2006 Upgrade of the NCEP Global Ensemble Forecast System (NAEFS) Yuejian Zhu, Zoltan Toth, Richard Wobus, Mozheng Wei and Bo Cui Environmental Modeling Center NOAA/NWS/NCEP Acknowledgements: Ding. Chen Hou and Ken Campana EMC David Michaud, Brent Gorden and Luke Lin NCO

Planned Changes - Summary 1. Increasing the number of perturbation runs 1. 14 (20 later) perturbation runs for each cycle 2. Adding control runs for 0600, 1200 and 1800 cycles. 3. Use Ensemble Transform (ET) breeding method instead of breeding method 1. ET breeding method will create initial orthogonal vectors instead of independent vectors 4. NAEFS new products from NCEP-CMC joint ensemble 1. Bias corrected forecast 2. Forecast anomalies 3. Weights

GEFS configurations Current Plan Model GFS Initial uncertainty BV ETBV Model uncertainty None Tropical storm Relocation same Daily frequency 00, 06, 12 and 18 UTC same Hi-re control (GFS) T 382 L 64 (d 0 -d 7. 5) T 190 L 64 (d 7. 5 -d 16) same Low-re control (ensemble control) T 126 L 28 (d 0 -d 16) 00 UTC only T 126 L 28 (d 0 -d 16) 00, 06, 12 and 18 UTC Perturbed members 10 for each cycle 14 (20) for each cycle Forecast length 16 days (384 hours) same Implementation August 17 th 2005 May 30 th 2006

Planned Changes - 1 • Increasing the number of perturbation runs – This change is intended to improve ensemble based probabilistic forecast over all and to support NAEFS (North American Ensemble Forecast System) project. – Results: • Improving probabilistic skills • Slightly improving ensemble mean skills (seasonal dependent)

Planned Changes - 2 • Adding control runs for 0600, 1200 and 1800 cycles. – This change is intended to enable for relocation of perturbed tropical storm, to respond the ensemble initial perturbation changes from pairs to one side only. After this implementation, there will be complete ensemble package with control for each cycle. It is useful to compare different cycles and leg forecast.
 breeding method instead of breeding")
Planned Changes - 3 • Use Ensemble Transform (ET) breeding method instead of breeding method – There is no pair anymore after this implementation (see next slide for details) – This change is intended to improve probabilistic forecast skills for all lead-time. – Results: • Slightly reducing ensemble mean track errors (retrospective runs) for 12 -96 hours • Improving probabilistic forecast skills
 Bred Vector (Current) Rescaling ANL P 1 Rescaling P")
Ensemble Transform Bred Vector (Plan) Bred Vector (Current) Rescaling ANL P 1 Rescaling P 1 forecast P 2 forecast ANL N 1 P 3 forecast t=t 0 t=t 1 t=t 2 P 4 forecast t=t 0 t=t 1 t=t 2 P#, N# are the pairs of positive and negative P 1, P 2, P 3, P 4 are orthogonal vectors P 1 and P 2 are independent vectors No pairs any more Simple scaling down (no direction change) To centralize all perturbed vectors (sum of all vectors are equal to zero) P 2 Scaling down by applying mask, The direction of vectors will be tuned by ET. ANL N 2

Planned Changed 4 – NAEFS Post Products • NAEFS basic product list – Bias corrected members of joint MSC-NCEP ensemble • 35 of NAEFS variables • 32(00 Z), 15(06 Z), 32(12 Z) and 15(18 Z) joint ensemble members • Bias correction against each center’s own operational analysis – Weights for each member for creating joint ensemble (equal weights right now) • Weights don’t depend on the variables • Weights depend on geographical location (low precision packing) • Weights depend on the lead time – Climate anomaly percentiles for each member • 19 of NAEFS variables • 32(00 Z), 15(06 Z), 32(12 Z) and 15(18 Z) joint ensemble members • Use NCEP/NCAR 40 -year reanalysis • Considering the difference between current analysis and reanalysis • Non-dimensional unit, allows downscaling of scalar variables to any local climatology

List of Variables for Bias Correction, Weights and Forecast Anomalies for CMC & NCEP Ensemble

NCO parallel • Start from 01/15/2006 – 14 perturbed runs and control for each cycle – With new file structures • Start from 02/01/2006 – Adding ET scheme (03/07/2006) – Tuning TS relocation (? ) • Start from 04/01/2006 – Use GEFS new system (May implementation) – Create bias correction forecast – Forecast anomalies • Evaluations

Statistic results • NCO real-time parallel verification statistics are posted at: – http: //wwwt. emc. ncep. noaa. gov/gmb/yzhu/html/opr/prx _daily. html (available now) – Updated every morning • Retrospective experimental verification statistics are posted at: – http: //www. emc. ncep. noaa. gov/gmb/yzhu/html/opr/et 1 4 m_daily. html (available now) – Updated as required

Northern Hemisphere Southern Hemisphere Early studies for ET Tropical Winter of 2002 -2003 ROC scores for 32 cases ENS-o control runs ENS-s ET-20 members ENS-x ET-10 members

Summary of Retrospective Runs • Period: 08/20/2005 – 09/30/2005 • Statistics for – Hurricane track errors • Atlantic-, East Pacific-, West Pacific- basins, total basins – – AC scores (Northern Hemisphere) RMS errors (Southern Hemisphere) Outlier for Northern Hemisphere ROC scores for NH and SH • Conclusion – Tropical – mean of track error (slightly improved) • Improved (48 -, 72 -, 96 -hours over all) – NH – mean (improved), probabilistic (improved) – SH – mean (slightly), probabilistic (improved)
 AEMN-operational ensemble ETIM-retrospective runs ETIM is better")
Hurricane Track Errors (Atlantic Basin: 08/20 -09/30/2005) AEMN-operational ensemble ETIM-retrospective runs ETIM is better than AEMN Hours Cases 174 157 141 128 101 75 48
 Ensemble need to improve in East")
Hurricane Track Errors (East Pacific Basin: 08/20 -09/30/2005) Ensemble need to improve in East Pacific Basin in the future Hours Cases 181 165 149 135 109 85 69
 ETIM is better than AEMN Hours")
Hurricane Track Errors (West Pacific Basin: 08/20 -09/30/2005) ETIM is better than AEMN Hours Cases 177 161 145 129 101 66 44
 Overall, ensemble mean beat GFS from/after 72")
Hurricane Track Errors (All Basins: 08/20 -09/30/2005) Overall, ensemble mean beat GFS from/after 72 hours for hurricane tracks, it is similar to NH/SH 500 h. Pa height rms errors Hours Cases 532 483 435 392 311 226 161

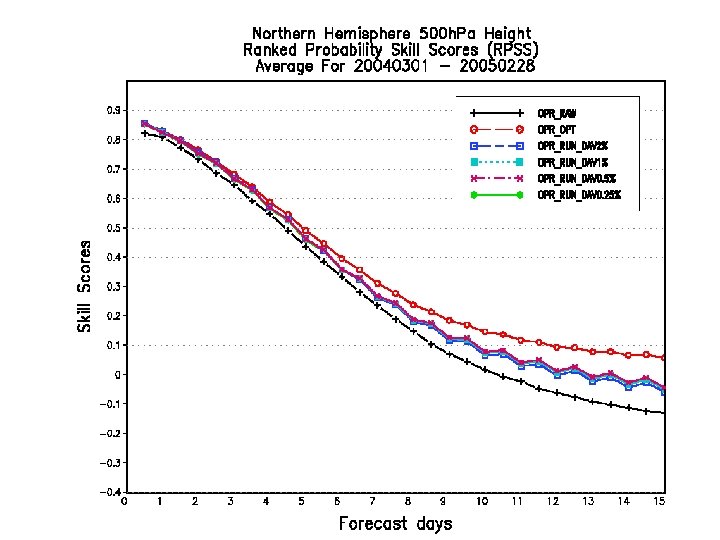
Improving skills from/after day 3 65% AC scores – useful skill Ens. extended another 20 hours Much better than GFS after 72 hours ENS_s – operational ensemble ENS_x – retrospective runs

Reduced errors after day 6 Reduced initial spread Growing faster than operational

Outlier zero is perfect Due to reduce initial perturbation Better after day 4

ENS_s – operational ensemble ENS_x – retrospective runs Improved ROC scores for Northern Hemisphere

Improved ROC scores for Southern Hemisphere
 • Statistics")
Summary of NCO Parallel • Period: 03/01/2006 -current (more than 50 days) • Statistics for – – RMS errors (Northern Hemisphere) AC scores (Southern Hemisphere) AC scores for tropical ROC scores for NH, SH and tropical • Conclusion – Tropical – no significant changes – NH – mean (even), probabilistic (improved) – SH – mean (improved), probabilistic (improved)

Rms errors are slightly better for short lead time Less spread at initial, but growing faster

Significant improvement for Southern Hemisphere Ensemble mean beat GFS from/after day 3

There is no big effect in Tropical by apply ET in generally

Improving for all lead time Most considerable improvement for medium range

Improvement for all lead time It is very similar to NH

There is no big difference for Tropical region
 Retrospective runs NCO parallel runs")
Perturbation versus Error Correlation Analysis (PECA) Retrospective runs NCO parallel runs

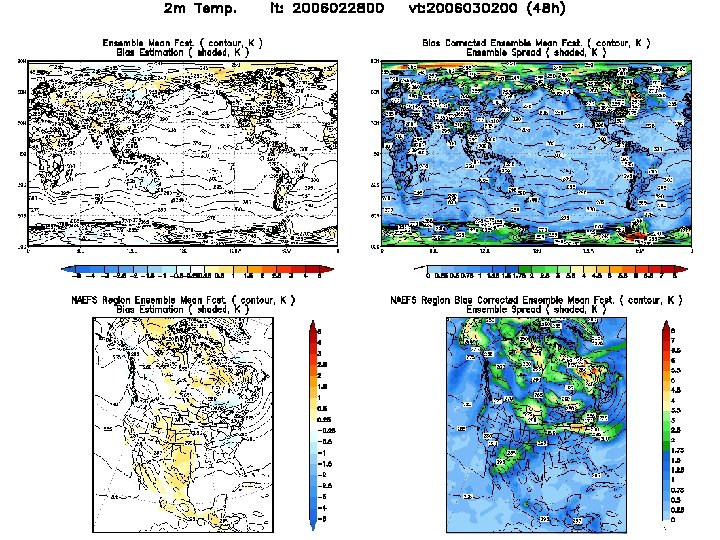
Summary of NAEFS new products - Post process • Early studies • NCO parallel: 04/01/2006 -current • No new stats yet

Ensemble size = 10 members
 & 90 -PERCENTILE FORECAST VALUES (BLACK CONTOURS) AND")
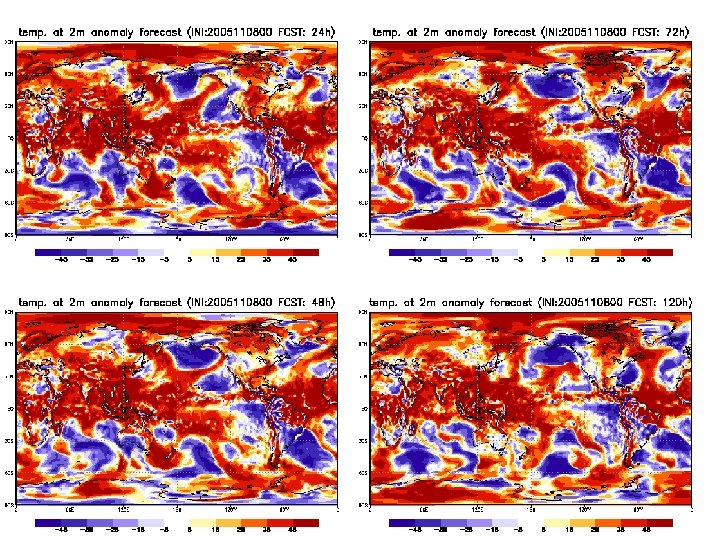
ENSEMBLE 10 -, 50 - (MEDIAN) & 90 -PERCENTILE FORECAST VALUES (BLACK CONTOURS) AND CORRESPONDING CLIMATE PERCENTILES (SHADES OF COLOR) Example of percentile forecast in terms of climate percentiles Proposal future NDGD products

Background !!!!!

RAW & BASIC PRODUCT AVAILABILITY 2005, 2006, 2007, 2008

END PRODUCTS • End product generation – Can be center specific – Need to conform with procedures/requirements established at different centers • End products generated at NCEP – Based on prioritized list of requests from NCEP Service Centers • Graphical products (including Caribbean, South American, and AMMA areas) – NCEP official web site (gif – NA, Caribbean, SA, AMMA) – NCEP Service Centers (NAWIPS metafile) • Gridded products – NAWIPS grids » NCEP Service Centers (list of 661 products) – GRIB 2 format » Products of general interest (Possible ftp distribution, no decision yet on products) » NDGD (10 -50 -90 percentile forecast value + associated climate percentile) • End products generated at MSC – TBD • End products generated jointly – Experimental probabilistic Week-2 forecast • Fully automated, based on basic products: bias corrected, weighted climate anomalies – Can become official product once performance reaches current operational level

ENSEMBLE PRODUCTS - FUNCTIONALITIES List of centrally/locally/interactively generated products required by NCEP Service Centers for each functionality are provided in attached tables (eg. , MSLP, Z, T, U, V, RH, etc, at 925, 850, 700, 500, 400, 300, 250, 100, etc h. Pa) FUNCTIONALITY CENTRALLY GENERATED 1 Mean of selected members Done 2 Spread of selected members Done 3 Median of selected values Sept. 2005 4 Lowest value in selected members Sept. 2005 5 Highest value in selected members Sept. 2005 6 Range between lowest and highest values Sept. 2005 7 Univariate exceedance probabilities for a selectable threshold value FY 06? 8 Multivariate (up to 5) exceedance probabilities for a selectable threshold value FY 06? 9 Forecast value associated with selected univariate percentile value Sept. 2005 - FY 06? 10 Tracking center of maxima or minima in a gridded field (eg – low pressure centers) Sept. 2005, Data flow FY 06? 11 Objective grouping of members FY 08? 12 Plot Frequency / Fitted probability density function at selected location/time (lower priority) FY 07? 13 Plot Frequency / Fitted probability density as a function of forecast lead time, at selected location (lower priority) FY 07? Additional basic GUI functionalities: - Ability to manually select/identify members - Ability to weight selected members Sept. 2005 LOCALLY GENERATED INTERACTIVE ACCESS Potentially useful functionalities that need further development: - Mean/Spread/Median/Ranges for amplitude of specific features - Mean/Spread/Median/Ranges for phase of specific features

ENSEMBLE PRODUCT REQUEST LIST NCEP SERVICE CENTERS, OTHER PROJECTS

NDGD FORECAST UNCERTAINTY - DOWNSCALING • Ensemble uncertainty information – Sent on NDGD grid for convenience (if no big overhead) – Valid on model grids (32 km for regional, 110 km for global ensemble) – How to bridge gap between model and NDGD grids? • Anomaly uncertainty information – proposed methodology – Establish reanalysis climatology • In progress for global (NAEFS), methods can be transferred to regional reanalysis – Bias correct ensemble forecasts (wrt operational analysis) – Take 10 -50 -90 percentile values from bias corrected ensemble – (For establishing anomaly forecasts, adjust 10 -50 -90 percentile values to look like re-analysis) – Check climatological percentile corresponding to 10 -50 -90 forecast percentiles • Provide climatological percentiles corresponding to 10 -50 -90 percentile forecast values as second set of guidance products
 Hours Cases 355 322 290 263")
Hurricane Track Errors (Atlantic+East Pacific Basins: 08/20 -09/30/2005) Hours Cases 355 322 290 263 210 160 117
 From Timothy Marchok (GFDL) Reduced")
Track errors and spreads 2004 Atlantic Basin (8/23 -10/1) From Timothy Marchok (GFDL) Reduced mean track errors and spreads
 Percentage improvement to Track errors (miles)")
Hurricane track errors 2 basins (Atlantic and e-Pacific) Percentage improvement to Track errors (miles) operational ensemble Period: 20040824 -20040930 (53 -103 cases)
- Slides: 45