Maximum likelihood estimation Michail Tsagris Ioannis Tsamardinos Histograms


 t distribution (William Gosset)")
 t distribution (William Gosset)")

% confidence interval for the mean")
% confidence interval for the mean")

% confidence interval for the mean")
% confidence interval for the proportion")
% confidence interval for the proportion")
- Slides: 27
Maximum likelihood estimation Michail Tsagris & Ioannis Tsamardinos
Histograms revisited Looks symmetric and unimodal.
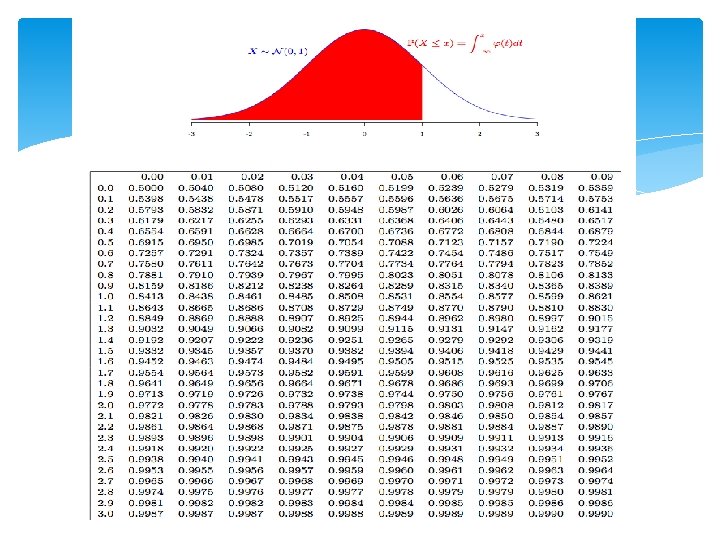
Normal distribution
MLE of normal distribution
MLE of normal distribution
MLE of normal distribution
MLE of normal distribution
MLE of mean, median and proportion So, the MLE of the mean is simply the sample mean of the data. The sample median serves as the MLE of the median. What about proportions? Suppose that a dose of 1μL kills 5 of the 30 mice in a wet lab experiment. The estimated rate of killing of the dose of this specific drug is 5/30 = 0. 167 or 16. 67%.
MLE of mean and median
Confidence intervals Suppose one calculates the proportion of mice killed at a given drug dose. Is it enough to present just a number? What else can he say? The uncertainty must be quantified via a range of most likely values, an interval of high confidence. The most common sentence is 95% confidence interval. The 5% is the standard, the most popular, but not the unique number.
Confidence intervals We performed a study, found some summary statistics and constructed a 95% confidence interval for the mean or the proportion. This means that with 95% probability the true means lies within the computed range.
Confidence intervals We performed a study, found some summary statistics and constructed a 95% confidence interval for the mean or the proportion. This means that with 95% probability the true means lies within the computed range. Wrong!!!
Confidence intervals We performed a study, found some summary statistics and constructed a 95% confidence interval for the mean or the proportion. But we only did the analysis once. In other words, our confidence interval has a 95% probability (we expect it is one of the 95% intervals) to have included the true mean or proportion or any parameter in general.
Confidence intervals We performed a study, found some summary statistics and constructed a 95% confidence interval for the mean or the proportion. If we were to repeat this analysis many times, we would expect that 95% of the times we would have included the true mean. Correct!!!
Confidence intervals
Confidence intervals
Confidence intervals
(Student’s) t distribution (William Gosset)
(Student’s) t distribution (William Gosset)
Population and sample revisit
(1 -α)% confidence interval for the mean
(1 -α)% confidence interval for the mean
t distribution tables
(1 -α)% confidence interval for the mean
(1 -α)% confidence interval for the proportion
(1 -α)% confidence interval for the proportion