
Matthew Vaughan Brian Tang and Lance Bosart Department

Matthew Vaughan, Brian Tang, and Lance Bosart Department of Atmospheric and Environmental Sciences University at Albany/SUNY Albany, NY 12222 NROW XV Nano-scale College South Auditorium Albany, New York Thursday 13 November 2014 Supported by the NOAA Collaborative Science, Technology and Applied Research Program
� CSTAR initiative to investigate severe convection with low predictive skill �Cooperation between SUNY-Albany and NWS offices at ALB, BGM, and PIT � Improve forecasting skill of severe convection by focusing study on environments with poor predictive skill

� Identify and evaluate poor forecast performance � Use forecasting performance as a proxy for predictability � Underlying assumption: If forecasters had trouble, the event had low predictability.
� Create skill Northeast domain to evaluate forecast � Plot SPC convective outlook contours over the domains. � Verify SLIGHT contours with storm reports � Sound � familiar? Hitchens and Brooks (2012) evaluated SLIGHT contours over CONUS domain MOD and HIGH contours were treated the same as SLIGHT
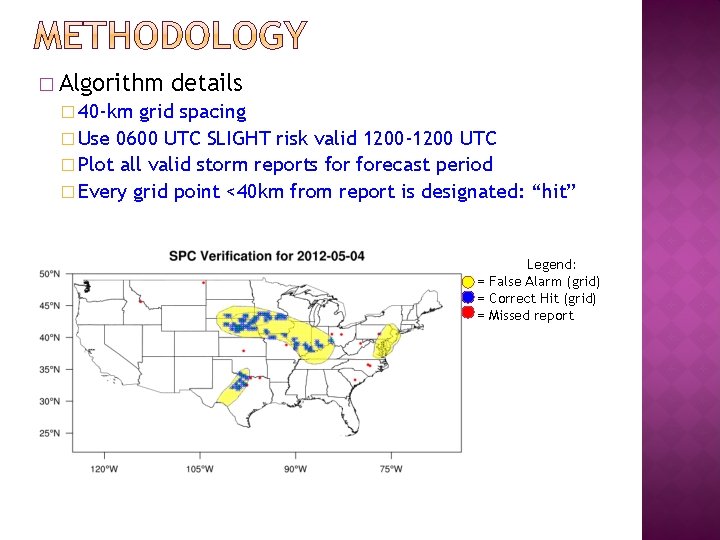
� Algorithm details � 40 -km grid spacing � Use 0600 UTC SLIGHT risk valid 1200 -1200 UTC � Plot all valid storm reports forecast period � Every grid point <40 km from report is designated: “hit” Legend: = False Alarm (grid) = Correct Hit (grid) = Missed report
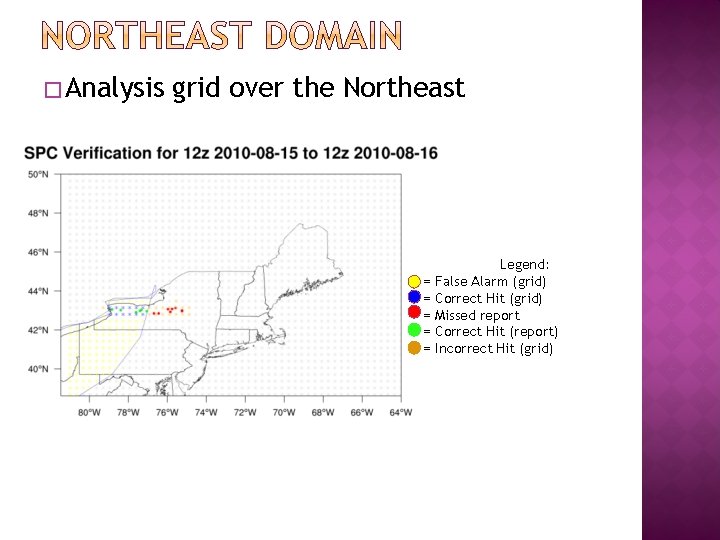
�Analysis grid over the Northeast = = = Legend: False Alarm (grid) Correct Hit (grid) Missed report Correct Hit (report) Incorrect Hit (grid)
� For inclusion in the 1980 -2013 dataset, an event must meet 1 of 2 criteria: �Have a SLIGHT risk contour within the NE domain �Contain at least 20 reports within the domain Given a SLIGHT in NE, 20 reports = 55 th percentile
� Event days = 1508 � SLIGHT � Events days = 1331 >20 reports without SLIGHT = 177
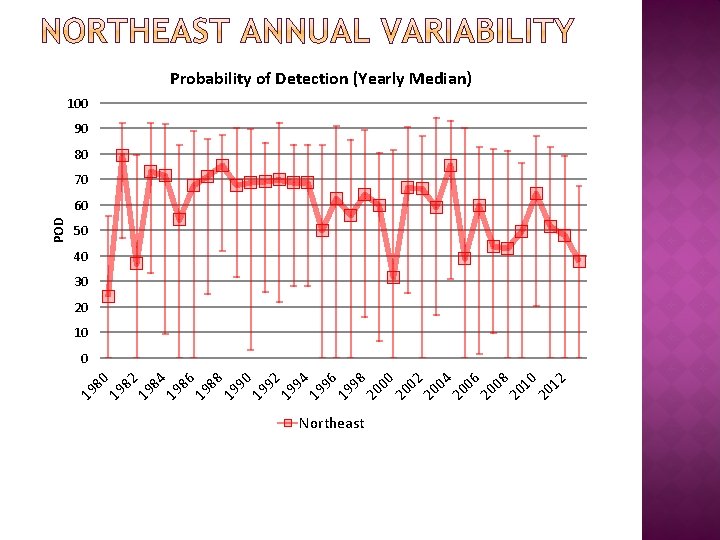
Probability of Detection (Yearly Median) 100 90 80 70 50 40 30 20 10 80 19 82 19 84 19 86 19 88 19 90 19 92 19 94 19 96 19 98 20 00 20 02 20 04 20 06 20 08 20 10 20 12 0 19 POD 60 Northeast
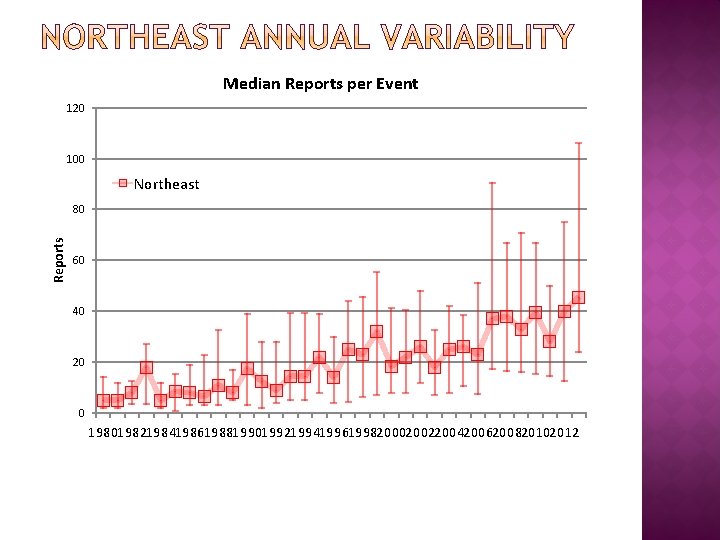
Median Reports per Event 120 100 Northeast Reports 80 60 40 20 0 19801982198419861988199019921994199619982000200220042006200820102012
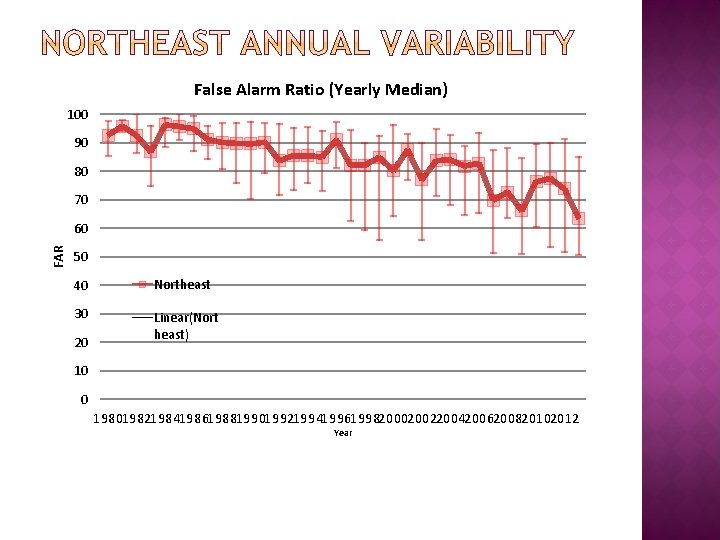
False Alarm Ratio (Yearly Median) 100 90 80 70 FAR 60 50 40 Northeast 30 Linear(Nort heast) 20 10 0 19801982198419861988199019921994199619982000200220042006200820102012 Year
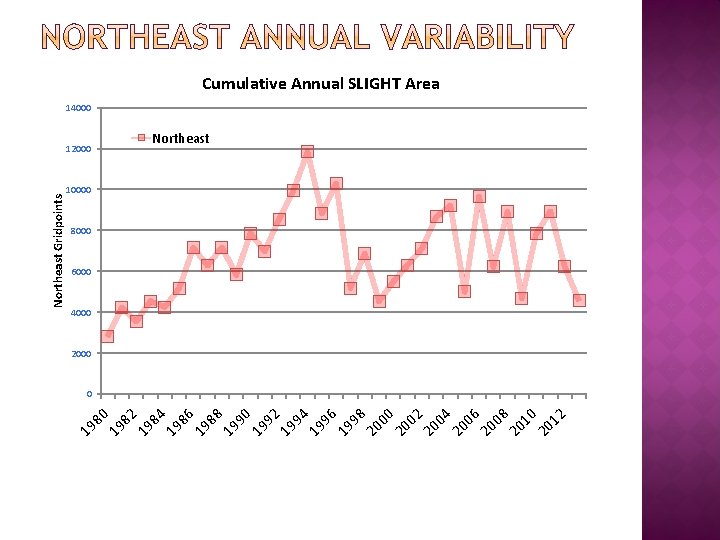
80 19 82 19 84 19 86 19 88 19 90 19 92 19 94 19 96 19 98 20 00 20 02 20 04 20 06 20 08 20 10 20 12 19 Northeast Gridpoints Cumulative Annual SLIGHT Area 14000 12000 Northeast 10000 8000 6000 4000 2000 0
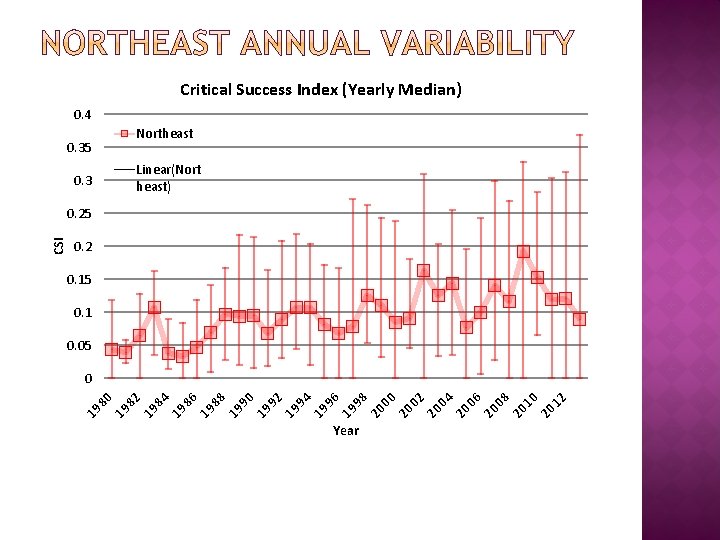
Critical Success Index (Yearly Median) 0. 4 Northeast 0. 35 Linear(Nort heast) 0. 3 0. 2 0. 15 0. 1 0. 05 Year 12 20 10 20 08 20 06 20 04 20 02 20 00 20 98 19 96 19 94 19 92 19 90 19 88 19 86 19 84 19 82 19 80 0 19 CSI 0. 25

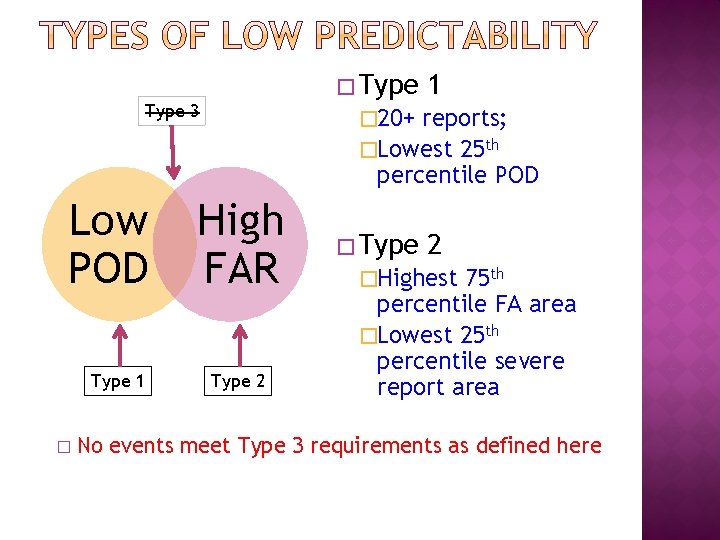
�Type 3 Low POD Type 1 � 20+ reports; �Lowest 25 th percentile POD High FAR Type 2 �Highest 75 th percentile FA area �Lowest 25 th percentile severe report area No events meet Type 3 requirements as defined here
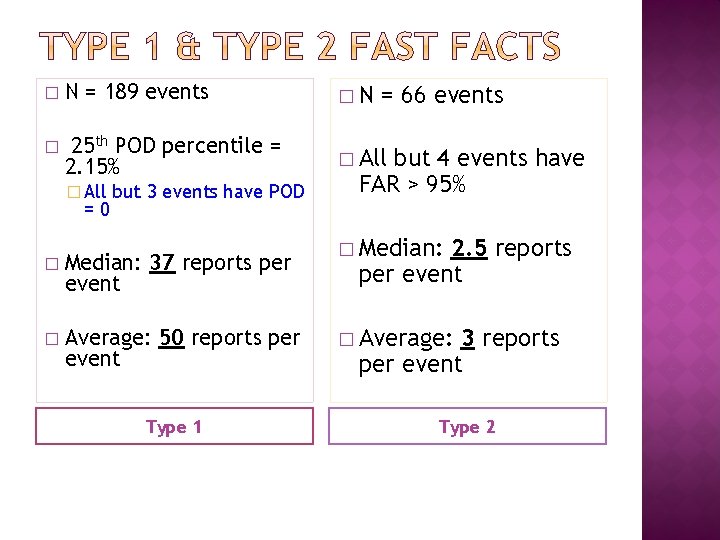
� N = 189 events �N � 25 th POD percentile = 2. 15% � All =0 but 3 events have POD � Median: 37 reports per event � Average: 50 reports per event Type 1 = 66 events but 4 events have FAR > 95% � Median: 2. 5 reports per event � Average: 3 reports per event Type 2
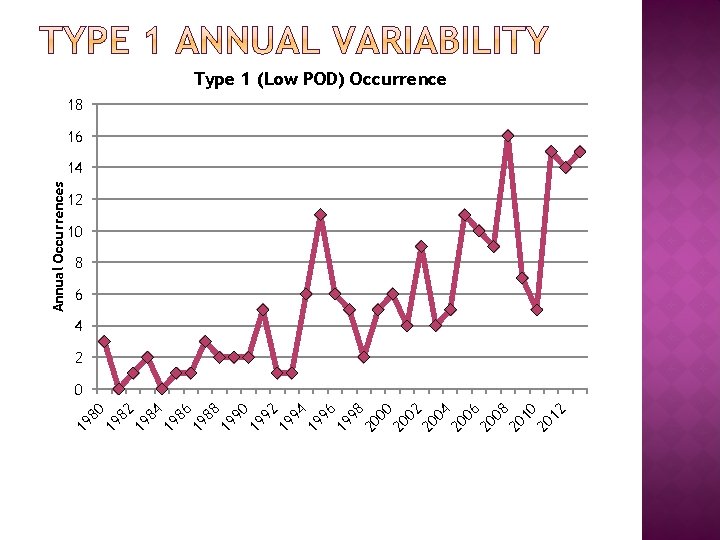
80 19 82 19 84 19 86 19 88 19 90 19 92 19 94 19 96 19 98 20 00 20 02 20 04 20 06 20 08 20 10 20 12 19 Annual Occurrences Type 1 (Low POD) Occurrence 18 16 14 12 10 8 6 4 2 0
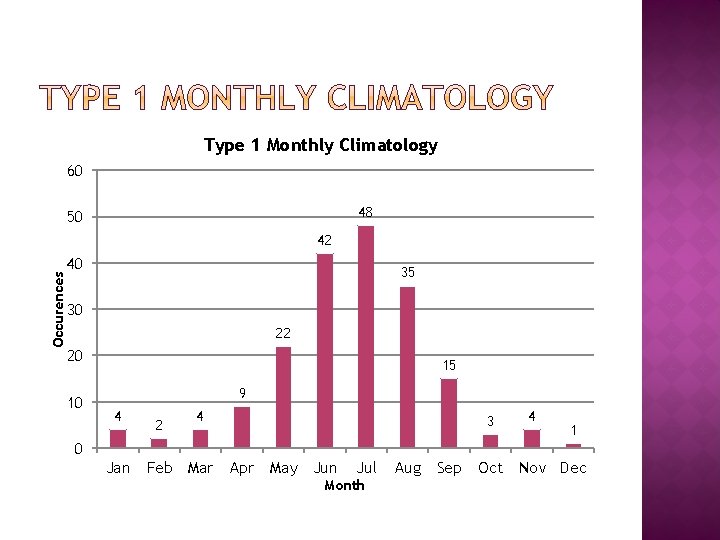
Type 1 Monthly Climatology 60 48 50 Occurences 42 40 35 30 22 20 10 15 9 4 2 4 3 4 1 0 Jan Feb Mar Apr May Jun Jul Month Aug Sep Oct Nov Dec
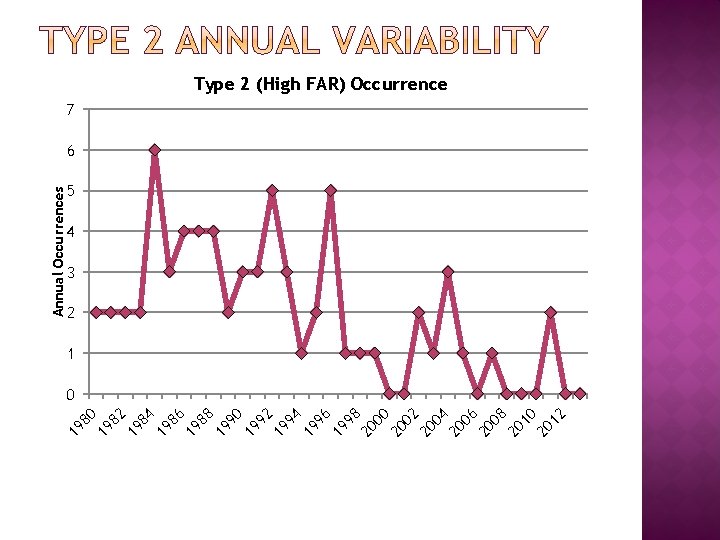
12 20 10 20 08 20 06 20 04 20 02 20 00 20 98 19 96 19 94 19 92 19 90 19 88 19 86 19 84 19 82 19 80 19 Annual Occurrences Type 2 (High FAR) Occurrence 7 6 5 4 3 2 1 0
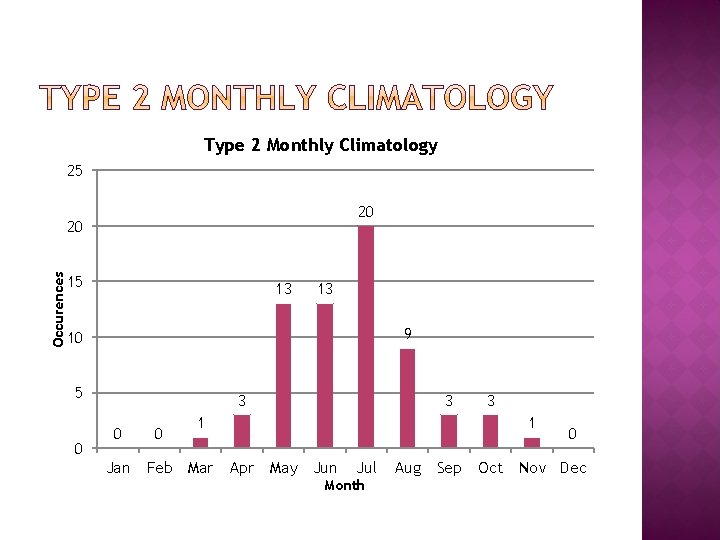
Type 2 Monthly Climatology 25 20 Occurences 20 15 13 13 9 10 5 0 3 0 Jan 0 3 1 Feb Mar 3 1 Apr May Jun Jul Month Aug Sep 0 Oct Nov Dec
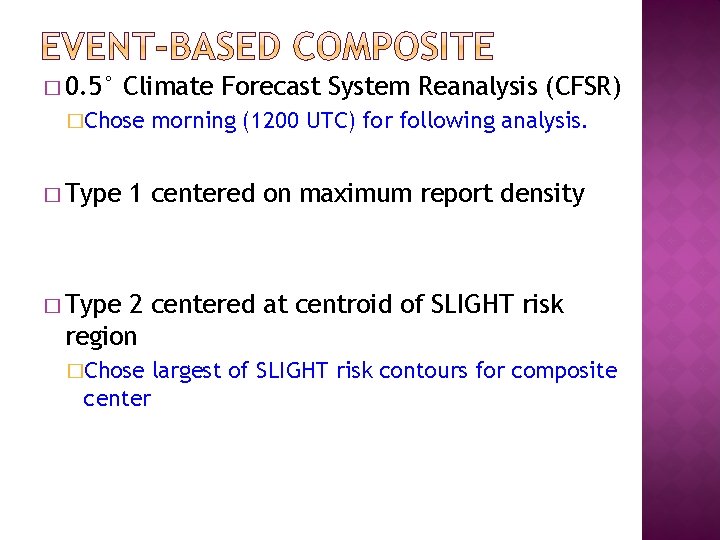
� 0. 5° Climate Forecast System Reanalysis (CFSR) �Chose � Type morning (1200 UTC) for following analysis. 1 centered on maximum report density � Type 2 centered at centroid of SLIGHT risk region �Chose center largest of SLIGHT risk contours for composite
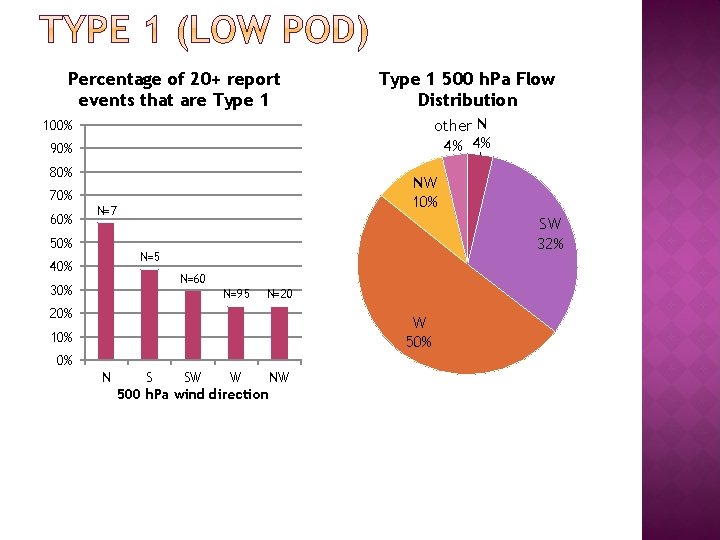
Percentage of 20+ report events that are Type 1 500 h. Pa Flow Distribution other N 4% 4% 100% 90% 80% 70% 60% NW 10% N=7 50% SW 32% N=5 40% N=60 30% N=95 N=20 20% W 50% 10% 0% N S SW W NW 500 h. Pa wind direction
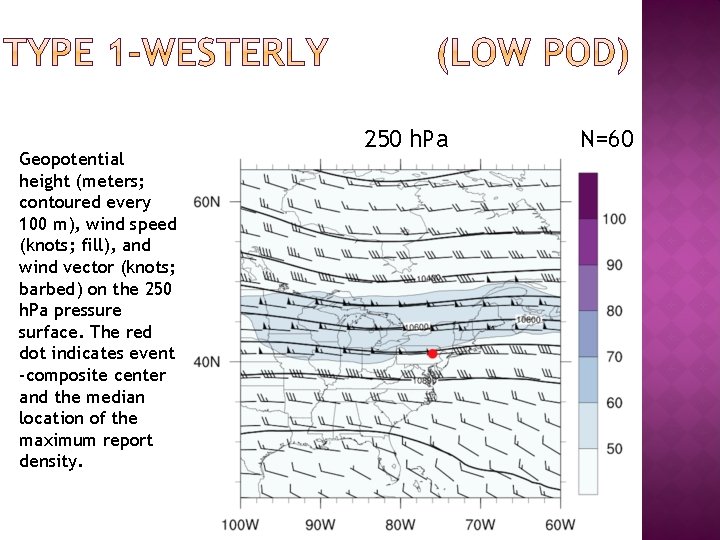
Geopotential height (meters; contoured every 100 m), wind speed (knots; fill), and wind vector (knots; barbed) on the 250 h. Pa pressure surface. The red dot indicates event -composite center and the median location of the maximum report density. 250 h. Pa N=60
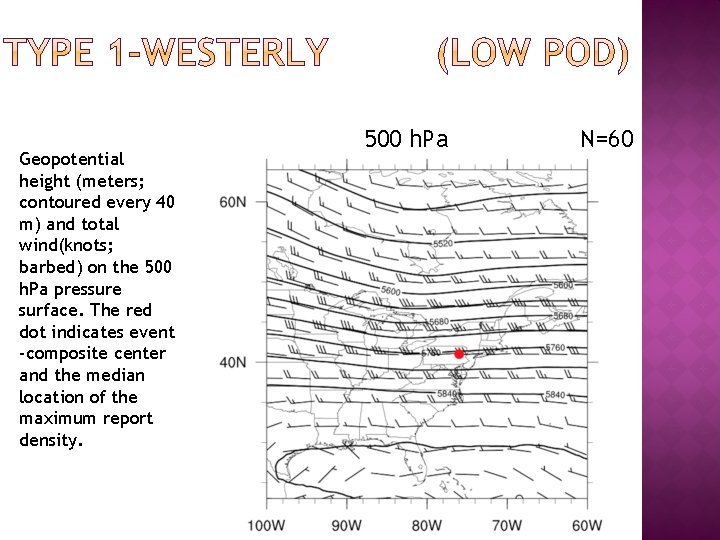
Geopotential height (meters; contoured every 40 m) and total wind(knots; barbed) on the 500 h. Pa pressure surface. The red dot indicates event -composite center and the median location of the maximum report density. 500 h. Pa N=60
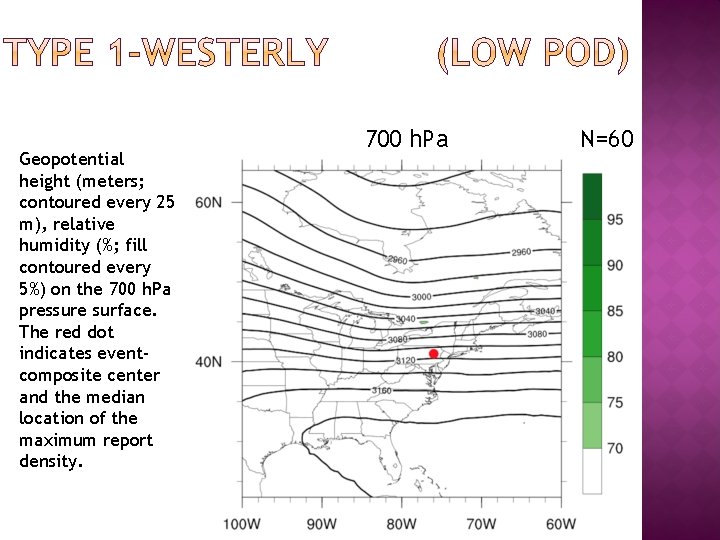
Geopotential height (meters; contoured every 25 m), relative humidity (%; fill contoured every 5%) on the 700 h. Pa pressure surface. The red dot indicates eventcomposite center and the median location of the maximum report density. 700 h. Pa N=60
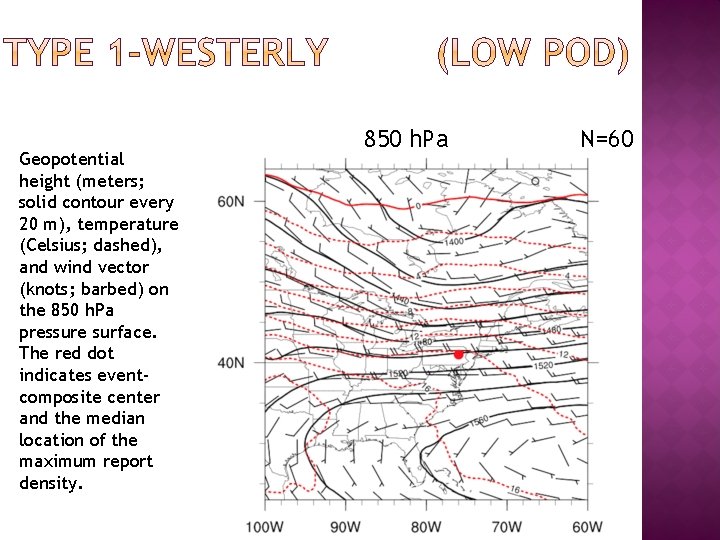
Geopotential height (meters; solid contour every 20 m), temperature (Celsius; dashed), and wind vector (knots; barbed) on the 850 h. Pa pressure surface. The red dot indicates eventcomposite center and the median location of the maximum report density. 850 h. Pa N=60
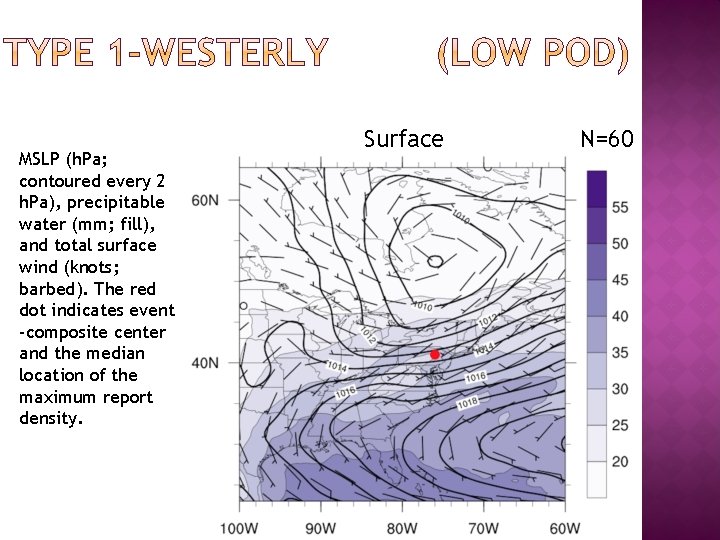
MSLP (h. Pa; contoured every 2 h. Pa), precipitable water (mm; fill), and total surface wind (knots; barbed). The red dot indicates event -composite center and the median location of the maximum report density. Surface N=60
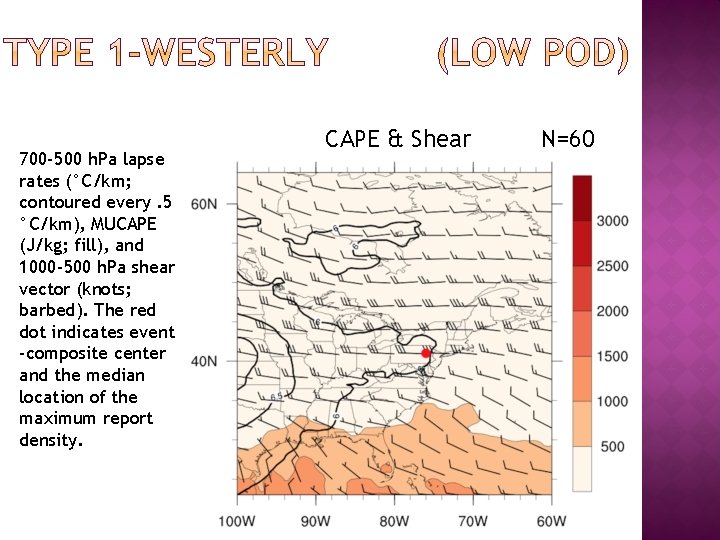
700 -500 h. Pa lapse rates (°C/km; contoured every. 5 °C/km), MUCAPE (J/kg; fill), and 1000 -500 h. Pa shear vector (knots; barbed). The red dot indicates event -composite center and the median location of the maximum report density. CAPE & Shear N=60
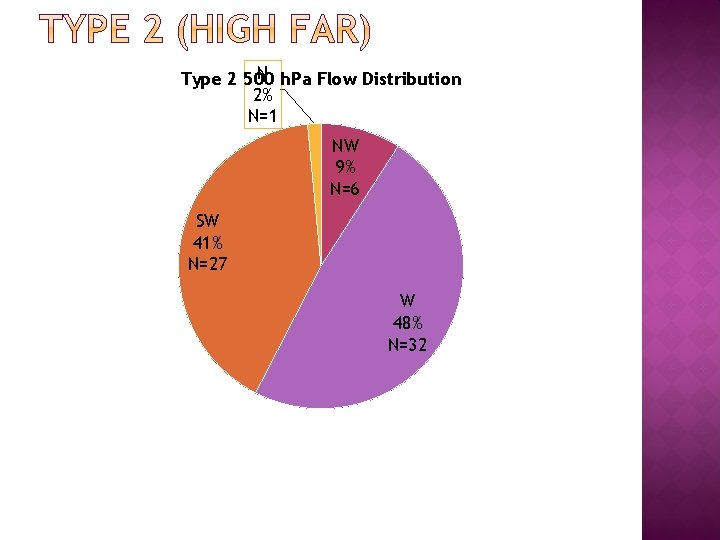
N h. Pa Flow Distribution Type 2 500 2% N=1 NW 9% N=6 SW 41% N=27 W 48% N=32
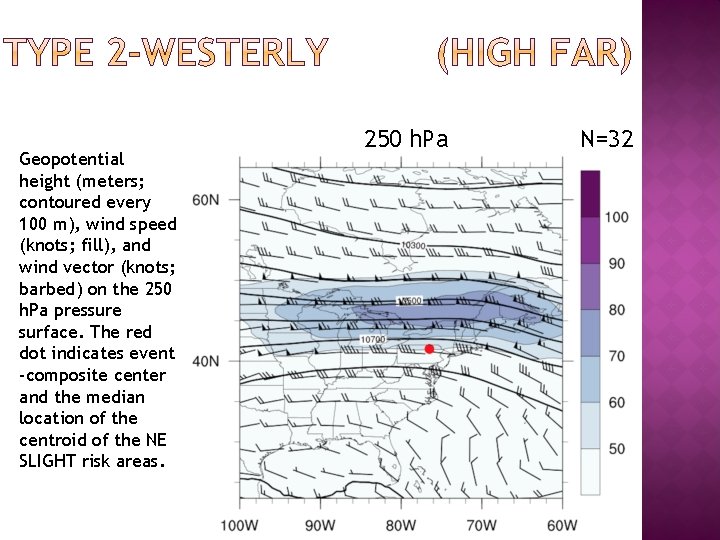
Geopotential height (meters; contoured every 100 m), wind speed (knots; fill), and wind vector (knots; barbed) on the 250 h. Pa pressure surface. The red dot indicates event -composite center and the median location of the centroid of the NE SLIGHT risk areas. 250 h. Pa N=32
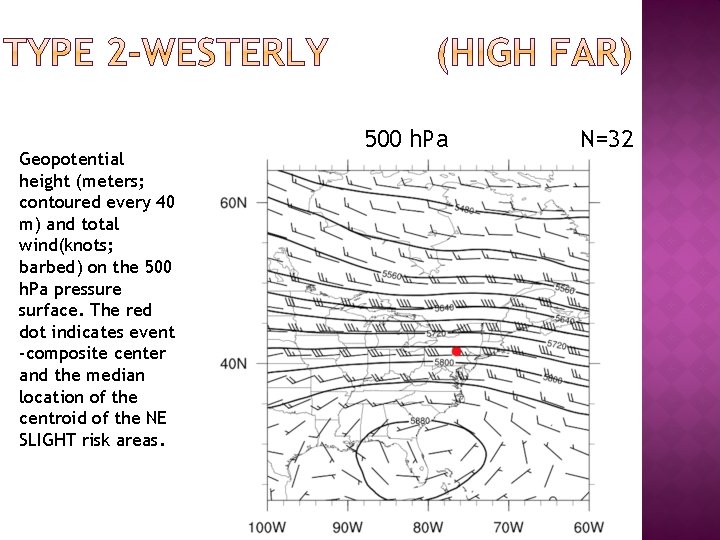
Geopotential height (meters; contoured every 40 m) and total wind(knots; barbed) on the 500 h. Pa pressure surface. The red dot indicates event -composite center and the median location of the centroid of the NE SLIGHT risk areas. 500 h. Pa N=32
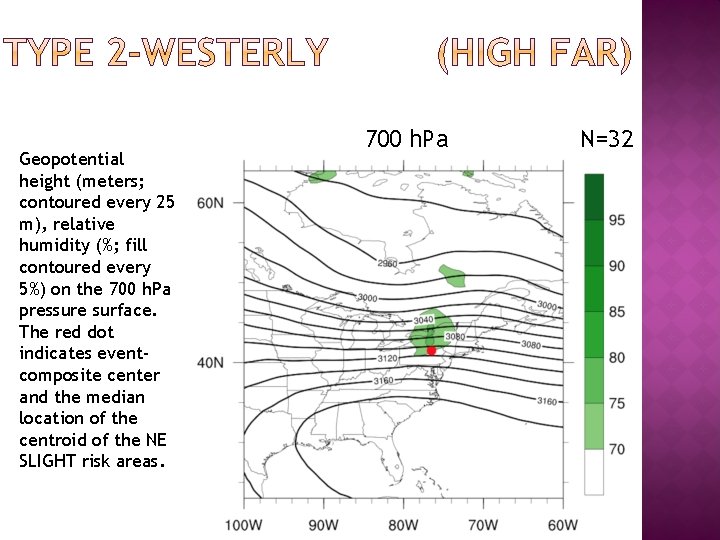
Geopotential height (meters; contoured every 25 m), relative humidity (%; fill contoured every 5%) on the 700 h. Pa pressure surface. The red dot indicates eventcomposite center and the median location of the centroid of the NE SLIGHT risk areas. 700 h. Pa N=32
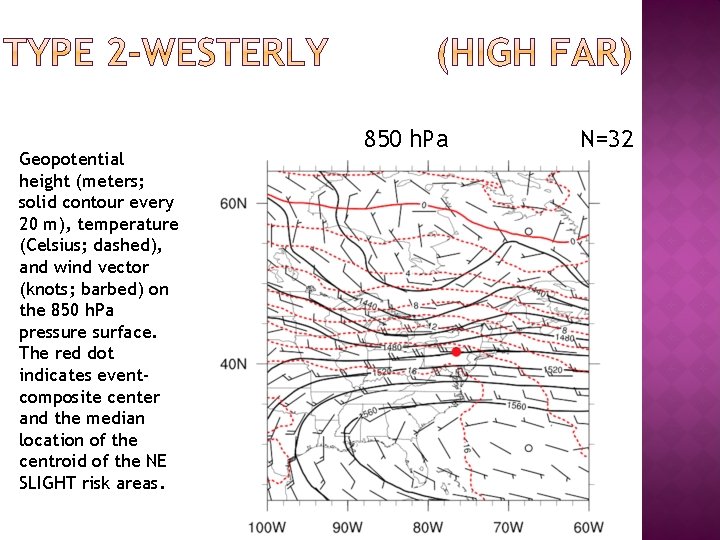
Geopotential height (meters; solid contour every 20 m), temperature (Celsius; dashed), and wind vector (knots; barbed) on the 850 h. Pa pressure surface. The red dot indicates eventcomposite center and the median location of the centroid of the NE SLIGHT risk areas. 850 h. Pa N=32
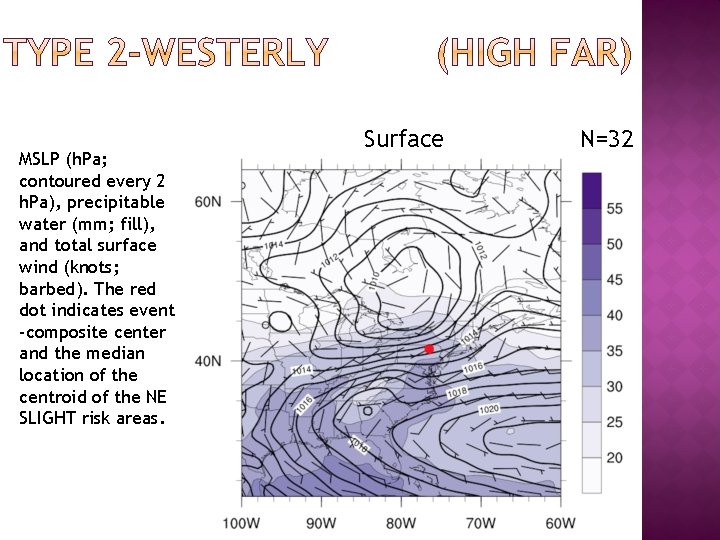
MSLP (h. Pa; contoured every 2 h. Pa), precipitable water (mm; fill), and total surface wind (knots; barbed). The red dot indicates event -composite center and the median location of the centroid of the NE SLIGHT risk areas. Surface N=32
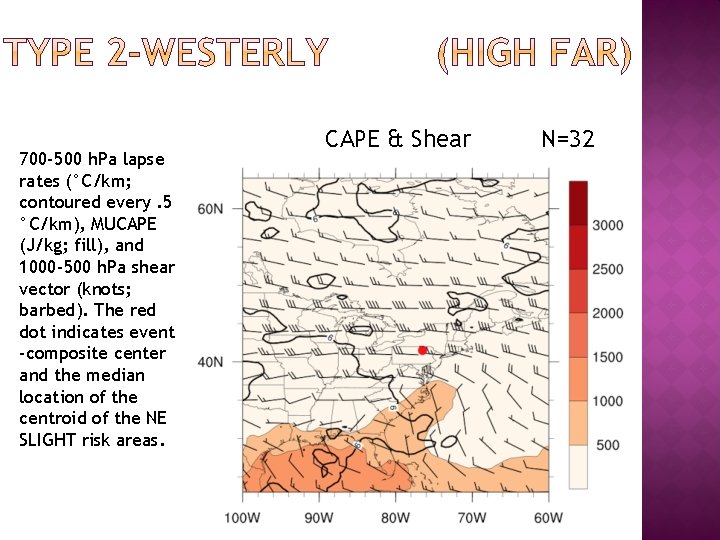
700 -500 h. Pa lapse rates (°C/km; contoured every. 5 °C/km), MUCAPE (J/kg; fill), and 1000 -500 h. Pa shear vector (knots; barbed). The red dot indicates event -composite center and the median location of the centroid of the NE SLIGHT risk areas. CAPE & Shear N=32
� Assess variability in composites �Analyze deviation among cases and reassess compositing method � Compare Type 1 & Type 2 flow regimes to cases with good predictive skill scores �May extend comparison to events of similar scale � Expand composites �Investigate variables identified in Hurlbut and Cohen (2014)
� NE predictive skill �Flat POD, decreasing FAR, increasing CSI �Number of reports per event increasing � NE low predictive skill event climatology �Type 1: 5 median events per year (Trending up) �Type 2: 2 median events per year (Trending down) �Peak in warm season � Most cases with low predictive skill follow climatology except rare N-ly, S-ly flow
� Type 1 (Low POD) �Westerly Anticyclonic side of jet, relatively low humidity at 700 h. Pa, higher mid-level lapse rates � Type 2 (High FAR) �Westerly Anticyclonic side of jet, higher 700 h. Pa humidity, higher precipitable water values, more confluent 850 h. Pa flow

- Slides: 40