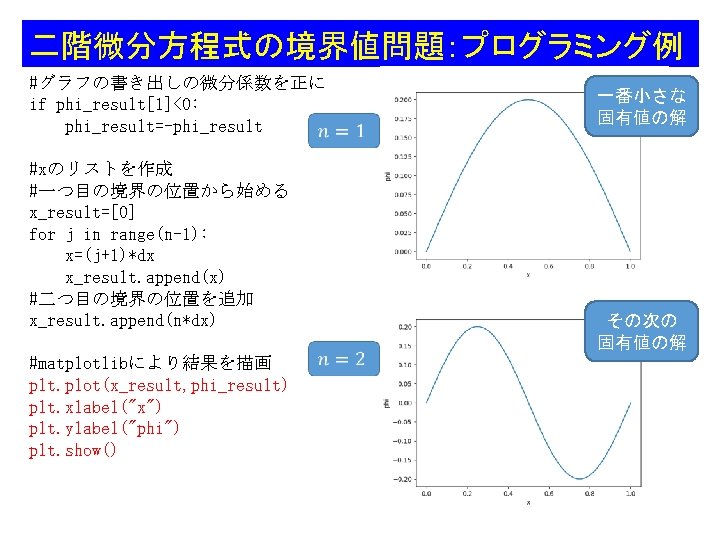
matplotlib plt plottresult nresult plt xlabelt plt xlabelN


 plt. xlabel(\"t\") plt. xlabel(\"N\") plt. show() それぞれ’matplotlib’ の中の関数")
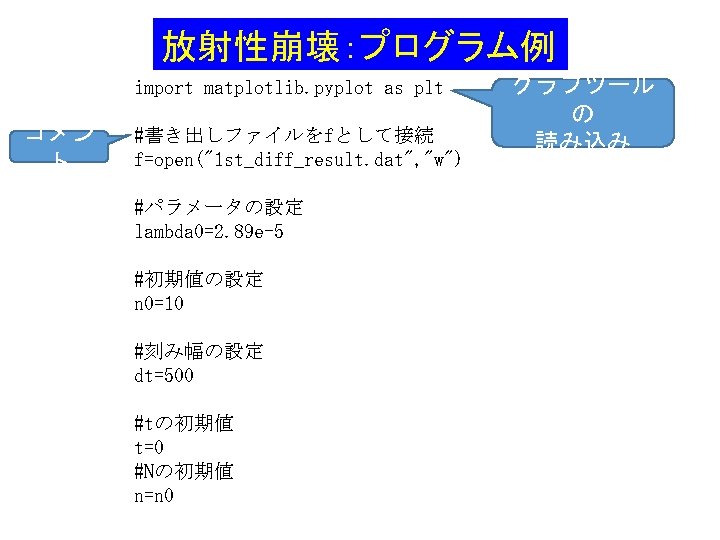
放射性崩壊:プログラム例 #matplotlibにより結果を描画 plt. plot(t_result, n_result) plt. xlabel("t") plt. xlabel("N") plt. show() それぞれ’matplotlib’ の中の関数
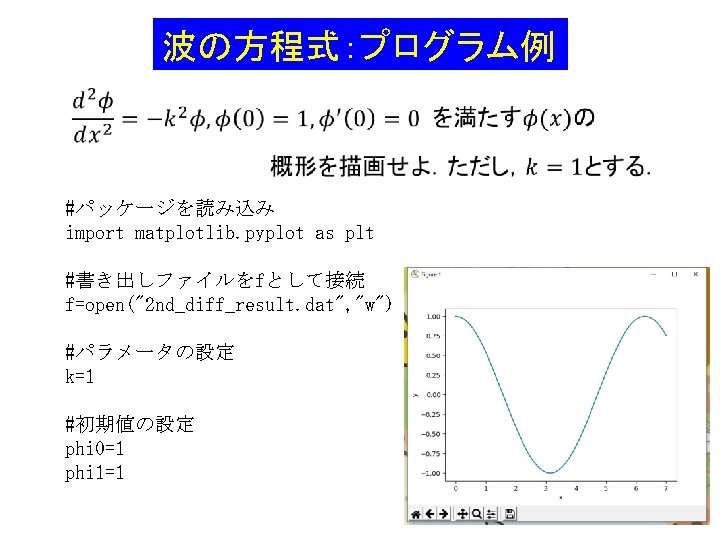

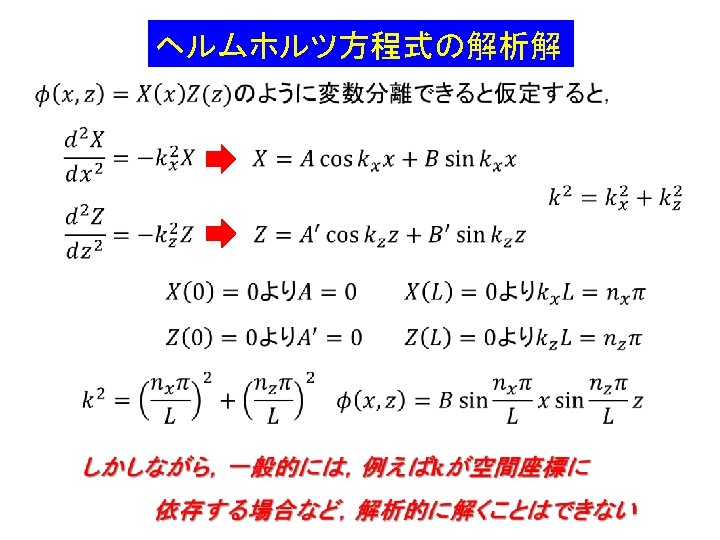
波の方程式:プログラム例 #刻み幅の設定 dx=0. 01 #xの初期値 x=0 #phiの初期値 phiold=phi 0 philast=phi 1 一つ前を’philast’, 二つ前を’phiold’として計 算 #初期値の書き出し x_result=[x] phi_result=[phi 0] f. write(str(x)+' '+str(phi 0)+'n') x=x+dx x_result. append(x) phi_result. append(phi 1) f. write(str(x)+' '+str(phi 1)+'n')
: #j=0 -698まで実行 x=x+dx #xの値をリストの末尾に追加(matplotlib用) x_result. append(x) phinew=(2 -k**2*dx**2)*philast-phiold")
波の方程式:プログラム例 #phiの値を順次計算 for j in range(699): #j=0 -698まで実行 x=x+dx #xの値をリストの末尾に追加(matplotlib用) x_result. append(x) phinew=(2 -k**2*dx**2)*philast-phiold #phiの値をリストの末尾に追加(matplotlib用) phi_result. append(phinew) #外部ファイルに結果を書き出し f. write(str(x)+' '+str(phinew)+'n') #(phinew, philast)→(philast, phiold)に置き換え phiold=philast 次の世代を計算する philast=phinew ために置き換え #matplotlibにより結果を描画 plt. plot(x_result, phi_result) plt. xlabel("x") plt. ylabel("y") plt. show() 順番を逆に してはいけな い


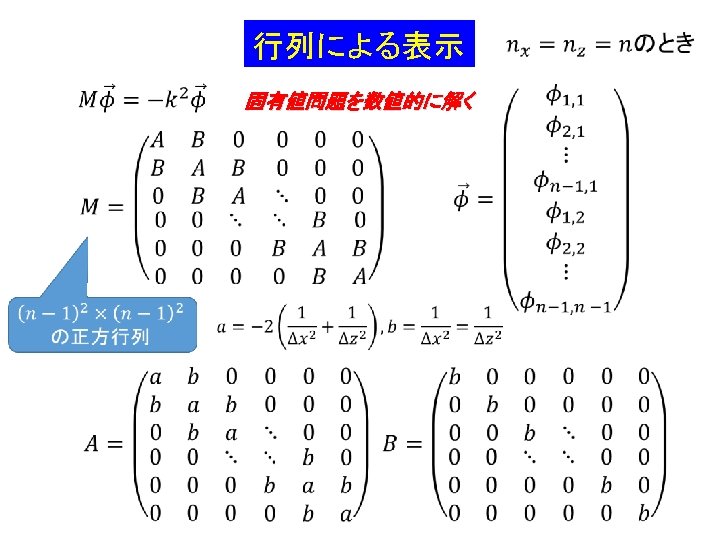
 print(“det. A=”, det. A) #行列式の計算 trace. A=np.")
配列による行列の計算 3 以下のプログラムを追記する. det. A=np. linalg. det(A) print(“det. A=”, det. A) #行列式の計算 trace. A=np. trace(A)#行列のトレース print(“trace. A=”, trace. A) rank. A=np. linalg. matrix_rank(A)#行列のrankの計算 print(“rank. A=”, rank. A) AT=np. transpose(A)#行列の転置 AT 2=A. T #別の書き方 print(“A^T=”, AT) print(“A^T=”, AT 2)


- Slides: 29