matplotlib basics matplotlib is the main plotting module

matplotlib basics

matplotlib is the main plotting module to use with python • typical import in a python program is: • import matplotlib. pyplot as plt • however sometimes we import other parts of matplotlib, e. g. to create custom colormaps (see Thursday's lecture) • matplotlib excels at 2 -D plots. In my experience MATLAB is better, and faster for fancy 3 -D plots, like objects with lighting, but there may be python modules I don't know about

my examples • Examples are available on the parkermac Git. Hub repo "pmec" in the folder ex_matplotlib • plt_basics. py covers basic line plotting operations, and ways to make multiple plots on a figure • fields. py covers ways to plot 2 -D fields using colors and contours

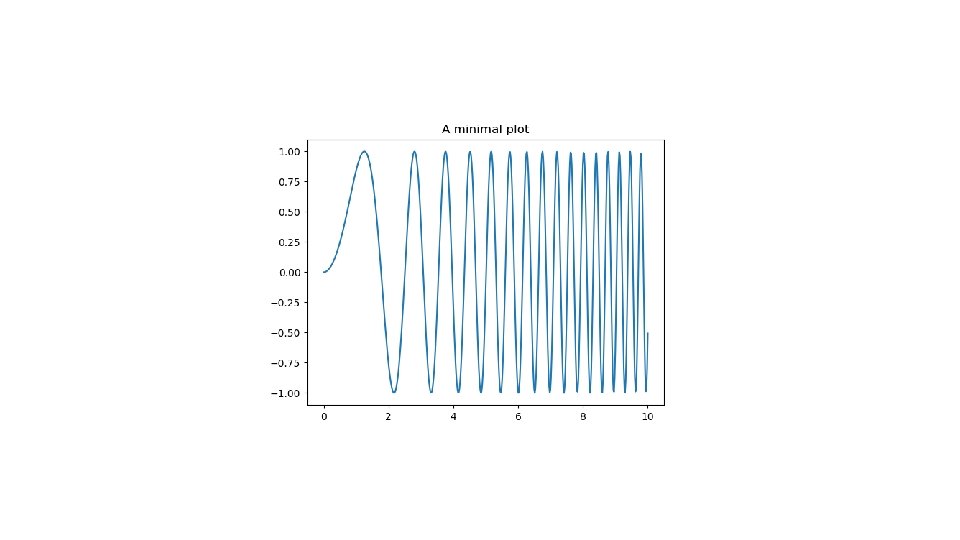
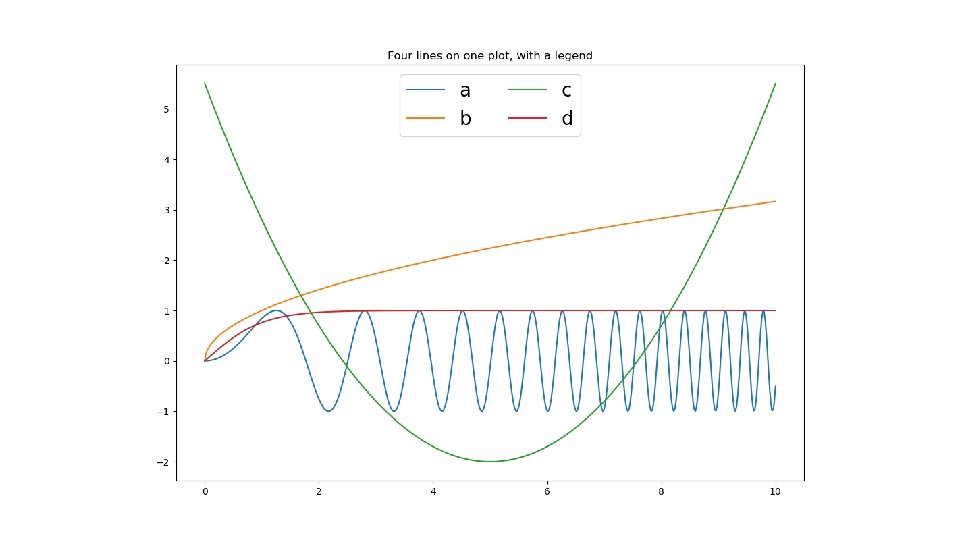
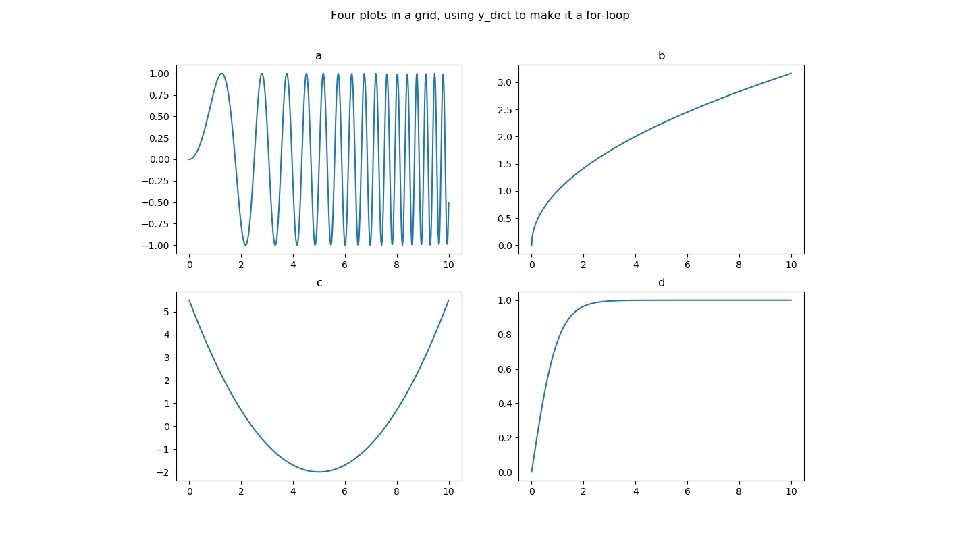
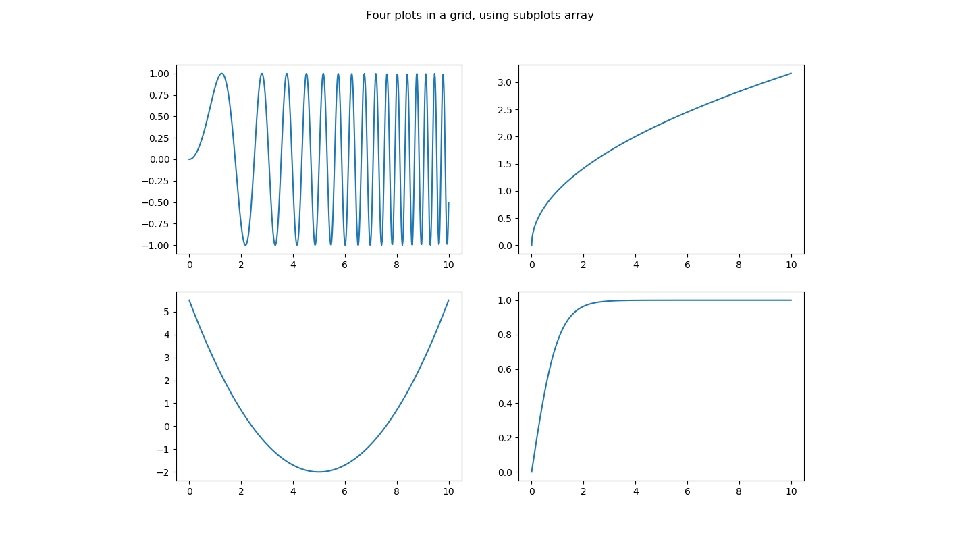
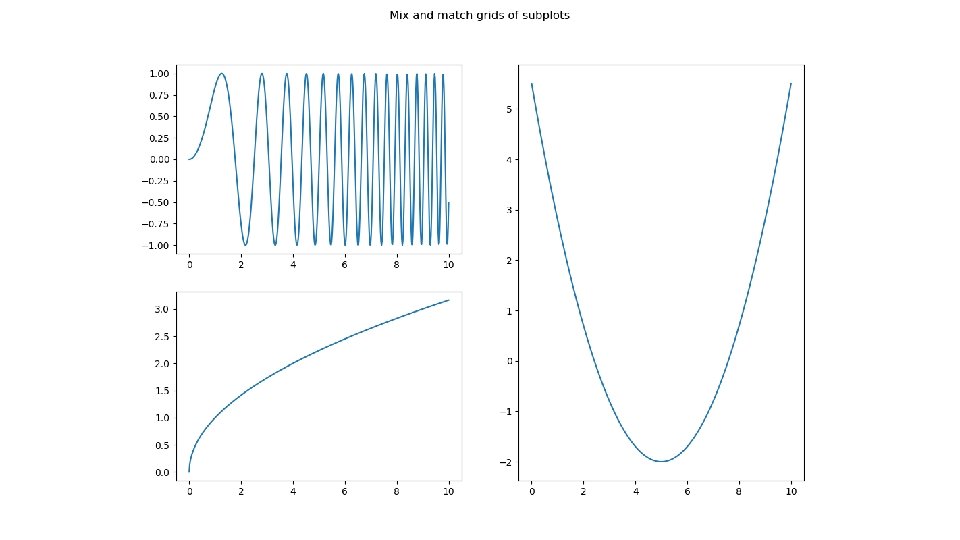
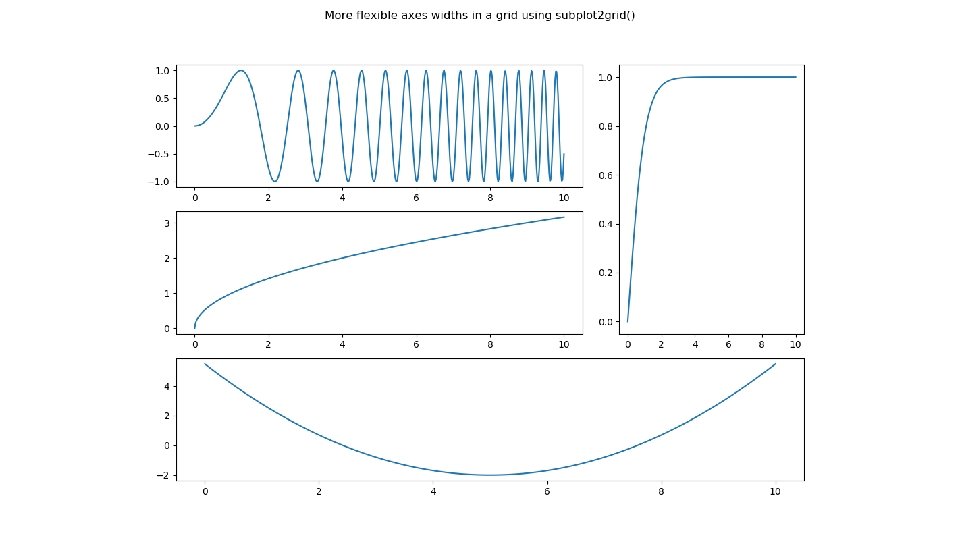
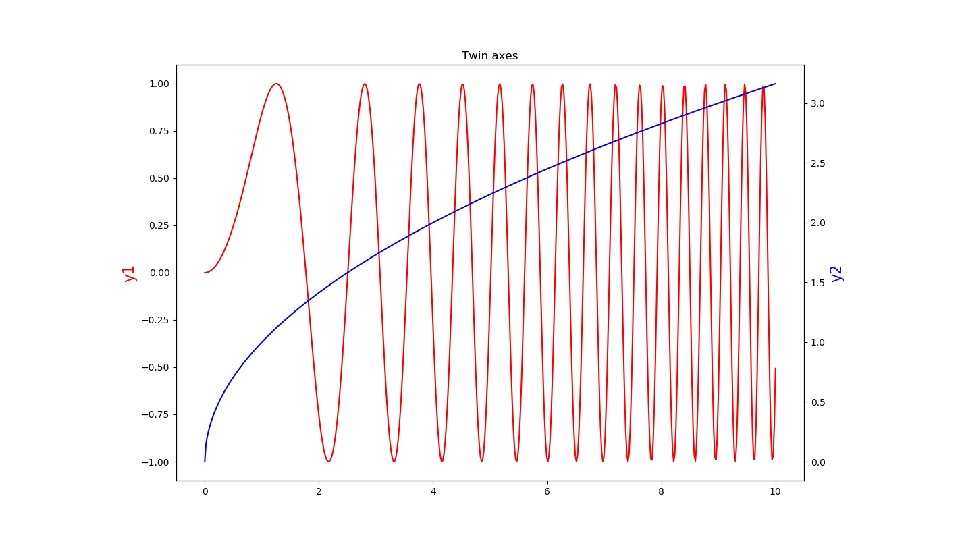
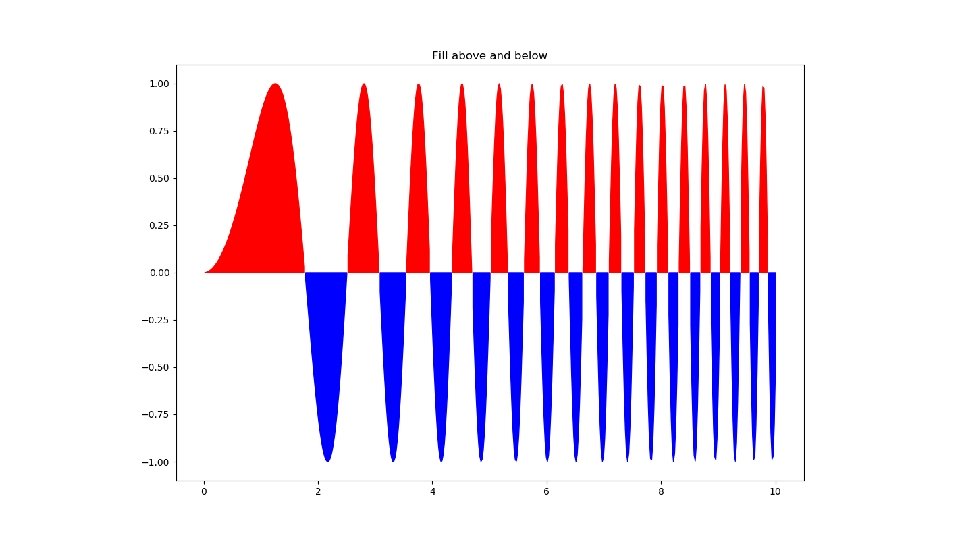
plt_basics. py

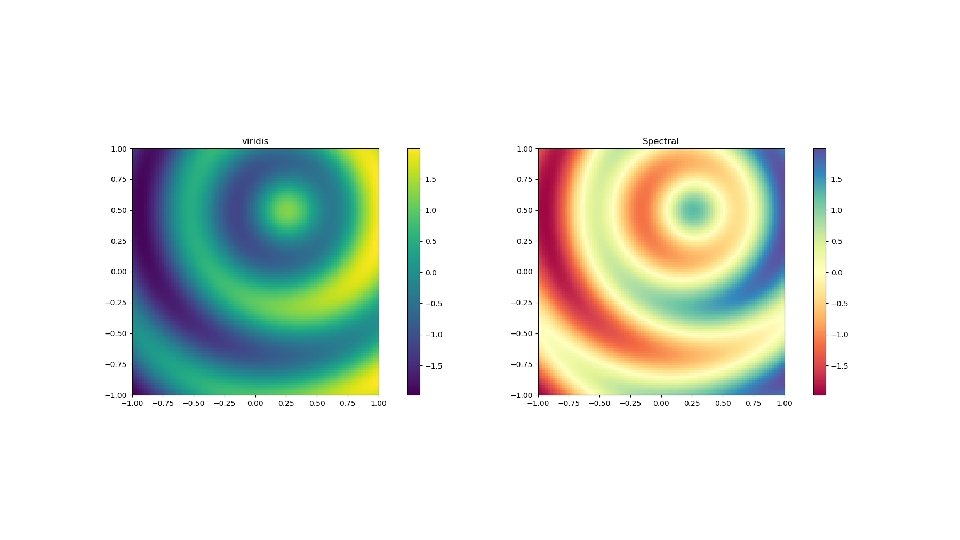
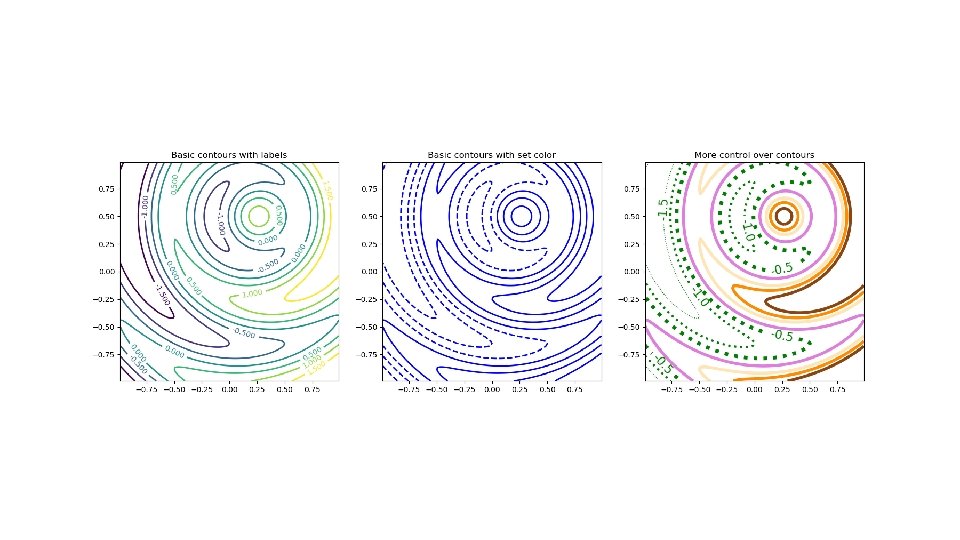
fields. py
 • On your laptop you typically launch")
plotting on a remote machine (like fjord) • On your laptop you typically launch python as "ipython --pylab" which sets the graphical backend. Then you can see plots on your screen, as well as saving them as. png's. The typical laptop launch is: ipython --pylab import matplotlip. pyplot as plt • On a remote machine you are working from the terminal, and so you can't see plots, but you can still save. png's. On fjord the typical launch sequence is: ipython import matplotlib as mpl. use('Agg') import matplotlib. pyplot as plt • I build these into my plotting programs with an if-statement that uses some knowledge of which machine I am working on. You could also make it a command line argument using argparse. • See the example "remote_printing. py" in pmec/ex_matplotlib

remote_printing. png on fjord from remote_printing. py
, and typical objects you")
Finding information • The primary module is matplotlib. pyplot (plt), and typical objects you create are figures (fig), axes (ax), colormaps or contours (cs), and text (h) • Each of these has its own methods, and each method accepts some required arguments (like x and y for a line plot) and some optional "keyword arguments" or "kwargs" (like linewidth=4). • It can sometimes (often!) be confusing which object and which method to use to achieve a desired result. • Sometimes there is an obvious hierarchy: • • plt has a method for making figures have a method for adding subplots (axes) axes have methods for actual plotting and when you do a plotting operation (e. g. add contours) it will return an object that you can inspect to find applicable methods

Finding information, continued. . . • To find out what methods can be used with an object, and what required and keyword arguments are possible with a method there are several techniques. • Say you have an axis object "ax": • dir(ax) will give a list of all valid methods, e. g. plot • help(ax. plot) gives, sometimes, a useful tutorial, although it can take some patience to read them • ax. plot? will give more succinct information (often my favorite) such as this for the "linestyle" kwarg: • linestyle or ls: {'-', '-. ', ': ', '', (offset, on-off-seq), . . . } which is saying that you could plot a dashed line using ax. plot(x, y, ls='--') ax. plot? ? give a nicely colorized, but over-long version of everything you can do Sometimes you need to dig deeper, e. g. if you want to add some fancy text: help(ax. text) will give basic information, but will suggest you look at **kwargs : `~matplotlib. text. Text` properties to find kwargs info • to follow this suggestion use help(matplotlib. text. Text) or matplotlib. text. Text? which will also show all valid kwargs, but to do this you first have to import matplotlib (not just matplotlib. pyplot) • NOTE: Text is the class for creating text object instances. • •

Resources • https: //matplotlib. org/ the home page • https: //matplotlib. org/users/index. html a Users Guide • https: //matplotlib. org/gallery/index. html an incredibly useful galley of examples, including plots and the code that made them
- Slides: 20