MATLAB Array Definition Keyword Meaning MATLAB Array Calculation
![MATLAB – Array Definition Keyword Meaning [] 배열의 시작과 끝 ; 행 구분 ,](http://slidetodoc.com/presentation_image_h/08f387b1744ac5465efa9761c741b138/image-3.jpg "MATLAB – Array Definition Keyword Meaning [] 배열의 시작과 끝 ; 행 구분 ,")
MATLAB – Array Definition Keyword Meaning [] 배열의 시작과 끝 ; 행 구분 , 열 구분 MATLAB – Array Calculation Chapter 4 Operation Symbol Example Addition, a + b + A+B Subtraction, a – b - A–B Multiplication, a • b * A*B Division, a b / or inv() A / B = A * inv(B) Exponentiation, ab ^ A^2 Transposition, a. T ‘ A’ Uiduk University

MATLAB – Scalar and Array Operation Element-By-Element Operation Representative Data Scalar Addition Scalar Multiplication Array Addition Array Multiplication Array Division Array Exponentiation Chapter 4 Uiduk University
, 2")
MATLAB – Easy Array Construction Technique Description x = [ 2, 2*pi, sqrt(5), 2 -3 j ] Create row vector x containing element specified x = first : last Create row vector x starting with first, counting by one, ending at or before last x = first : increment : last Create row vector x starting with first, counting by increment, ending at or before last x = linspace(first, last, n) Create row vector x starting with first, ending at last, having n elements x = logspace(first, last, n) Create logarithmically-spaced row vector x starting with 10 first, ending at 10 last, having n elements Chapter 4 Uiduk University
 EX 2) EX 3) >> c =")
MATLAB – Easy Array Construction EX 1) EX 2) EX 3) >> c = [1, 6, 9, 7] >> d = [ a(1: 2: 5), 1, 0, 1 ] >> x = linspace(2, 6, 3) c= d= x= 1 6 9 7 1 3 5 1 0 2 1 4 6 >> a = 1 : 5 >> a = 1 : 3, b = 1 : 2 : 7 >> x = logspace(0, 2, 11) a= a= x= 1 2 3 4 5 1 2 3 3 5 1. 0000 1. 5849 2. 5119 3. 9811 6. 3096 10. 0000 15. 8489 25. 1189 39. 8107 63. 0957 100. 0000 b= >> b = 1 : 2 : 7 1 7 b= 1 3 5 7 >> c = [ b, a ] c= >> x = (0 : 0. 1 : 0. 3) * pi 1 3 5 7 1 2 3 x= 0 Chapter 4 0. 3142 0. 6238 0. 9425 Uiduk University

MATLAB – Reading From Data File << mat. txt>> 파일의 내용 0. 7918 1. 2590 -0. 2172 -0. 9242 2. 6448 0. 1716 -0. 5228 0. 3639 4. 5700 -0. 1982 0. 0586 0. 1214 6. 4240 -0. 0158 0. 0763 -0. 0615 8. 3750 0. 0303 -0. 0131 -0. 0144 10. 2545 0. 0003 -0. 0104 0. 0101 12. 2296 -0. 0044 0. 0026 0. 0014 14. 1076 0. 0003 0. 0013 -0. 0016 16. 0704 0. 0006 -0. 0005 -0. 0001 18. 2613 -0. 0001 0. 0002 >> load mat. txt Chapter 4 >> t = mat( : , 1); % 시간 벡터 >> x = mat( : , 2); % 변위 벡터 >> v = mat( : , 3); % 속도 벡터 >> a = mat( : , 4); % 가속도 벡터 Uiduk University
 Plot 할 데이터 준비 (x, y 축의")
MATLAB – Plot Procedure Chapter 4 (1) Plot 할 데이터 준비 (x, y 축의 데이터 생성 / Reading Data) (2) Single graphic / Multi graphic 선택 (3) Plot 함수 호출 (4) Line 이나 marker 의 속성 선택 (5) 축의 한계값, grid line 등을 설정 (6) xlabel, legend, text 등으로 라벨링 (7) 그래픽 객체 출력 Uiduk University
 Plot 할 데이터 준비 >> x = 0: 0.")
MATLAB – Single Plot (1) Plot 할 데이터 준비 >> x = 0: 0. 01: 10; >> y = sin(x). * cos(x + pi/2); >> size(x) ans = 1 1001 >> size(y) ans = (2) Single graphic / Multi graphic 선택 >> figure(1) Chapter 4 Uiduk University
 (3) Plot 함수 호출 >> plot(x, y); (4) Line")
MATLAB – Single Plot (2) (3) Plot 함수 호출 >> plot(x, y); (4) Line 이나 marker 의 속성 선택 >> set(plot(x, y), 'Line. Style', '--'); Chapter 4 Uiduk University
 (5) 축의 한계값, grid line 등을 설정 >> axis([1,")
MATLAB – Single Plot (3) (5) 축의 한계값, grid line 등을 설정 >> axis([1, 5, -0. 5, 0]); >> grid on; (6) xlabel, legend, text 등으로 라벨링 >> xlabel('x'); >> ylabel('y'); >> title('Plotting x and y'); (7) 그래픽 객체를 출력 >> print –dbitmap d: ex 1. bmp >> print –djpeg d: ex 1. jpg >> print –dtiff d: ex 1. tif Chapter 4 Uiduk University
 Form Meaning Plot(y) Plots the columns of y")
MATLAB – Plot Function (Linear Plot) Form Meaning Plot(y) Plots the columns of y versus their index Plot(x, y) Plots vector y versus vector x Plot(x, y, s) s is a character string made from the table on the next page Plot(x 1, y 1, s 1, x 2, y 2, s 2, … ) Combines the plots defined by the (x, y, s) triples Chapter 4 Uiduk University

MATLAB – Plot Options Color Chapter 4 Point Mark Line Style b blue . point - solid g green o circle : dotted r red x x-mark -. dashdot c cyan + plus -- dashed m magenta * star y yellow s square k black d diamond v triangle(down) ^ triangle(up) < triangle(left) > triangle(right) p pentagram h hexagram Uiduk University
![MATLAB – Plot Example (1) EX 1) >> y = [1, 6, 9, 7]](http://slidetodoc.com/presentation_image_h/08f387b1744ac5465efa9761c741b138/image-14.jpg "MATLAB – Plot Example (1) EX 1) >> y = [1, 6, 9, 7]")
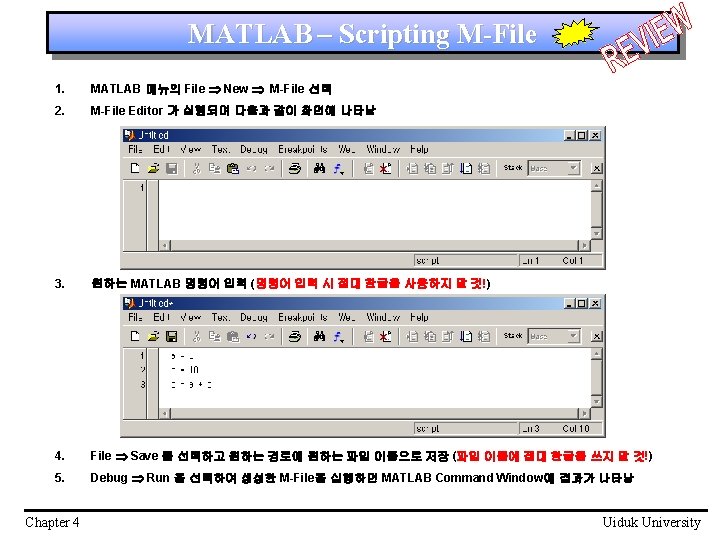
MATLAB – Plot Example (1) EX 1) >> y = [1, 6, 9, 7] ; >> plot(y); EX 2) >> y = [1, 6, 9, 7] ; >> plot(y, 'rs: '); Chapter 4 Uiduk University
 EX 3) >> x = 0: 0. 01: 10;")
MATLAB – Plot Example (2) EX 3) >> x = 0: 0. 01: 10; >> y = x. ^3 - 6*x. ^2 + 11*x - 6; >> plot(x, y); >> axis([0, 4, -5, 5]); EX 4) >> x = 0: 0. 01: 10; >> y = x. ^3 - 6*x. ^2 + 11*x - 6; >> plot(x, y, 'b: '); >> axis([0, 4, -5, 5]); Chapter 4 Uiduk University
 EX 5) >> x = 0: 0. 01: 10;")
MATLAB – Plot Example (3) EX 5) >> x = 0: 0. 01: 10; >> y = x. ^3 - 6*x. ^2 + 11*x - 6; >> plot(x, x – x, x, y); >> axis([0, 4, -5, 5]); EX 6) >> x = 0: 0. 01: 10; >> y = x. ^3 - 6*x. ^2 + 11*x - 6; >> y 1 = 3 * sin(3. *x); >> plot(x, x - x, 'k-', x, y, 'b-. ', x, y 1, 'k-'); >> axis([0, 4, -5, 5]); Chapter 4 Uiduk University
 Breaks the Figure window")
MATLAB – Sub. Plot Function Form Meaning subplot(m, n, i) Breaks the Figure window into an m X n matrix of small axis and selects the i’th axis for the current plot subplot(mni) EX 7) >> x 1 = 0: 0. 1: 10; >> x 3 = 0: 0. 1: 100; >> f 1 = sin(x 1). * cos(x 1 + pi / 2); >> f 3 = -(0. 4*x 3. ^3). *sin(x 3); >> subplot(221); >> subplot(223); >> plot(x 1, f 1); >> plot(x 3, f 3); >> grid on; >> x 2 = 0: 0. 1: 100; >> xlabel('x 3'); >> f 2 = x 2. ^4 - 0. 4*x 2. ^3 + 10*x 2. ^2 - 30*x 2 + 5; >> ylabel('y 3'); >> subplot(222); >> x 4 = 1: 1: 200; >> plot(x 2, f 2); >> f 4 = sqrt(x 4). *log(x 4); >> subplot(224); >> plot(x 4, f 4); Chapter 4 Uiduk University
- Slides: 17