Maths Statistics Year One Maths Year 6 Statistics


 Distance Cycled (km) 14: 00 0 14:")


- Slides: 17
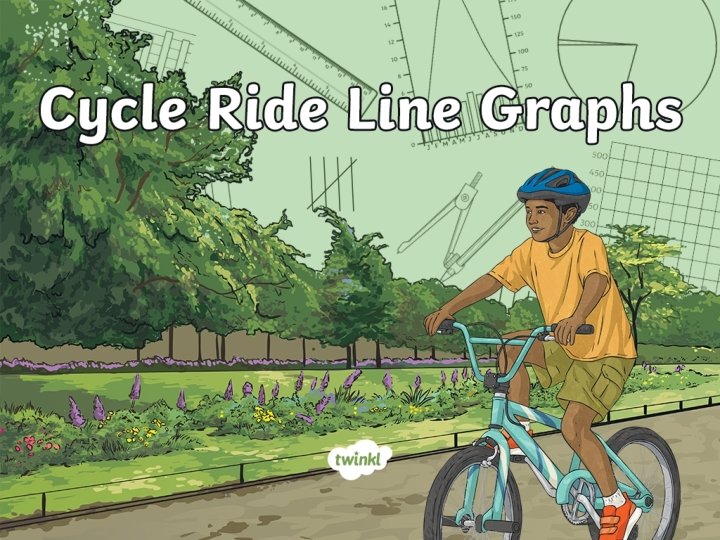
Maths Statistics Year One Maths | Year 6 | Statistics | Interpret and Construct Charts and Graphs | Lesson 1 of 6: Cycle Ride Line Graphs
Aim • I can read and interpret line graphs. Success Criteria • I can answer questions about data presented in a line graph. • I can interpret and answer questions about a line graph showing the relationship between two variables. • I can interpret and answer questions about line graphs representing more than one set of data.
Tremendous Charts! You will have seen some charts and graphs in your maths lessons and also in the world outside school. What types of charts and graphs are you familiar with? Can you describe the way each chart of graph represents information?
Cycle Ride Data Kamil took part in a sponsored cycle ride. During the afternoon, his fitness tracker recorded how far he cycled. Here is the table of data showing how far Kamil cycled over two hours. How would you represent this data as a graph? Time (24 -hour clock) Distance Cycled (km) 14: 00 0 14: 20 1. 2 14: 40 2 15: 00 3. 2 15: 20 3. 6 15: 40 4. 8 16: 00 5. 4
He knows that athat line the graph has a Kamil identifies data shows horizontal vertical axis, and over that the changeand in how far he cycled the time data is usually shown along afternoon. the horizontal axis. He knows that a line graph is used Looking the table of data, what to show at changes to measurement scale interval dodecides you think should over time, so he to draw a be used on the horizontal axis and line graph. vertical axis? Time (24 -hour clock) Distance Cycled (km) 14: 00 0 14: 20 1. 2 14: 40 2 15: 00 3. 2 15: 20 3. 6 15: 40 4. 8 16: 00 5. 4 Distance (km) Cycle Ride Graph Time (24 -hour clock)
Cycle Ride Graph Time (24 -hour clock) Distance Cycled (km) 14: 00 0 14: 20 1. 2 14: 40 2 15: 00 3. 2 15: 20 3. 6 15: 40 4. 8 16: 00 5. 4 5 4 Distance (km) He doesn’t Kamil decides label onevery a five-minute interval on interval the axis. scale for the horizontal time axis and a two-kilometre interval scale forline Kamil’s the graph vertical also distance needs aaxis. title. What would be a good title for this As hegraph? line is creating the scales, Kamil makes sure the numbers are positioned on the lines of the axis. 3 2 1 0 14: 00 14: 30 15: 00 Time (24 -hour clock) 15: 30 16: 00
Cycle Ride Graph A Line Graph to Show the Distance Travelled during a Sponsored Cycle He locates Now, Kamilthe is time readyvalues to plotfrom the data on the axis. graph. He from table his cycle ridehorizontal onto the line finds where these horizontal lines intersect values He knowswith thatthe thisdistance is similar to on the vertical axis and marks each plotting coordinates. intersection with a small cross. Distance Cycled (km) 14: 00 0 14: 20 1. 2 14: 40 2 15: 00 3. 2 15: 20 3. 6 15: 40 4. 8 16: 00 5. 4 4 Distance (km) Time (24 -hour clock) × 5 × 3 × × × 2 × 1 × 0 14: 00 14: 30 15: 00 Time (24 -hour clock) 15: 30 16: 00
Cycle Ride Graph A Line Graph to Show the Distance Travelled during a Sponsored Cycle Finally, Kamil plots the data on the graph and joins the plots together with straight lines to create a continuous line. Time (24 -hour clock) Distance Cycled (km) 14: 00 0 14: 20 1. 2 14: 40 2 15: 00 3. 2 15: 20 3. 6 15: 40 4. 8 16: 00 5. 4 44 Distance (km) He can use the continuous line to find approximate distance measurements for any time during his ride. 55 33 22 11 0 0 14: 00 14: 30 15: 00 Time (24 -hour clock) 15: 30 16: 00
Line Graph Questions A Line Graph to Show the Distance Travelled during a Sponsored Cycle Work with your partner to decide if Kamil’s statements about his cycle ride are true or false. 5 By 14: 50, I had cycled 2. 6 km. Distance (km) 4 3 2 1 True! 0 14: 00 14: 30 15: 00 Time (24 -hour clock) 15: 30 16: 00
Line Graph Questions A Line Graph to Show the Distance Travelled during a Sponsored Cycle Work with your partner to decide if Kamil’s statements about his cycle ride are true or false. 5 It took me 1 hour to cycle 4 km. Distance (km) 4 3 2 1 False. It took 90 minutes (an hour and a half) to cycle 4 km. Kamil only cycled 3. 2 km in 1 hour. 0 14: 00 14: 30 15: 00 Time (24 -hour clock) 15: 30 16: 00
Line Graph Questions A Line Graph to Show the Distance Travelled during a Sponsored Cycle Work with your partner to decide if Kamil’s statements about his cycle ride are true or false. 5 From 14: 30 to 15: 00, I cycled 2 km. Distance (km) 4 3 2 1 False. Kamil cycled 1. 6 km from 14: 30 to 15: 00. 0 14: 00 14: 30 15: 00 Time (24 -hour clock) 15: 30 16: 00
Line Graph Questions A Line Graph to Show the Distance Travelled during a Sponsored Cycle Work with your partner to decide if Kamil’s statements about his cycle ride are true or false. 5 It took me 30 minutes to cycle from 4 km to 4. 8 km. Distance (km) 4 3 2 1 False. It took 10 minutes. 0 14: 00 14: 30 15: 00 Time (24 -hour clock) 15: 30 16: 00
Cycle Ride Line Graphs
Double Data On a whiteboard, write down five things you can tell from this line graph. A Line Graph to Show Kamal and Holly’s Cycle Race Kamal Holly 7 What does this graph show? What do the two lines represent? Distance (km) 6 5 4 3 2 1 0 8 16 32 40 24 Time (minutes) 48 56
Aim • I can read and interpret line graphs. Success Criteria • I can answer questions about data presented in a line graph. • I can interpret and answer questions about a line graph showing the relationship between two variables. • I can interpret and answer questions about line graphs representing more than one set of data.