Mathematical Approach on Performance Analysis for Web based
Mathematical Approach on Performance Analysis for Web based System Won. Young Lee n n 2006. 02. 01 http: //www. javaservice. com
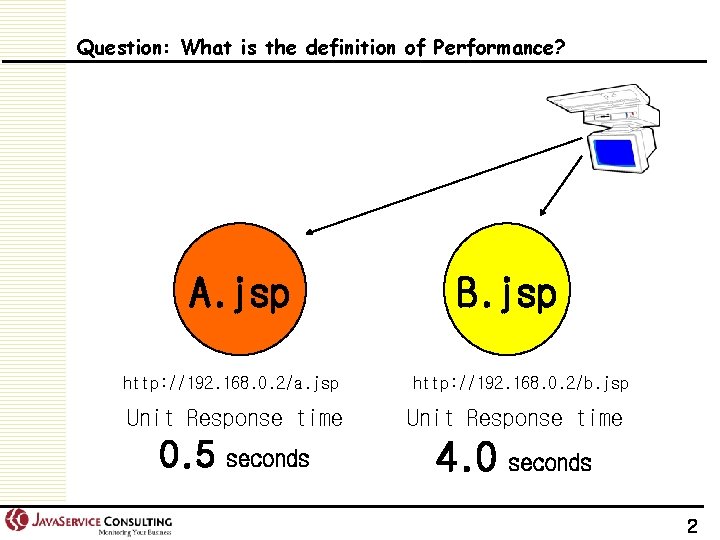
Question: What is the definition of Performance? A. jsp http: //192. 168. 0. 2/a. jsp Unit Response time 0. 5 seconds B. jsp http: //192. 168. 0. 2/b. jsp Unit Response time 4. 0 seconds 2
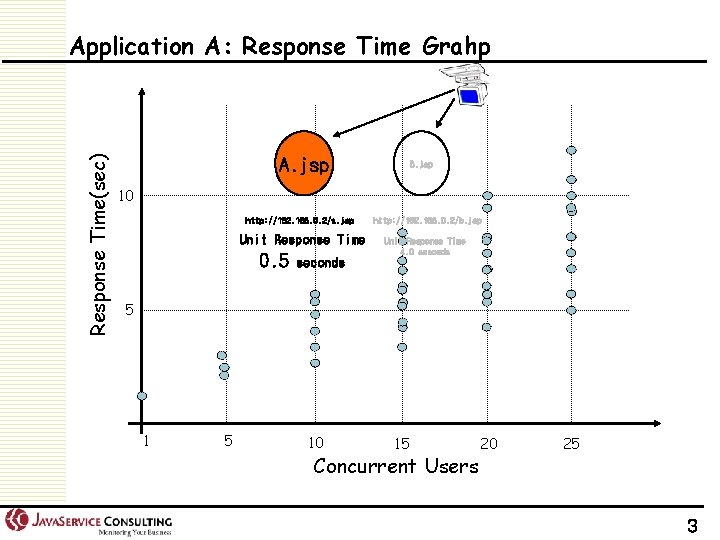
Response Time(sec) Application A: Response Time Grahp A. jsp B. jsp 10 http: //192. 168. 0. 2/a. jsp http: //192. 168. 0. 2/b. jsp Unit Response Time 4. 0 seconds 0. 5 seconds 5 10 15 Concurrent Users 20 25 3
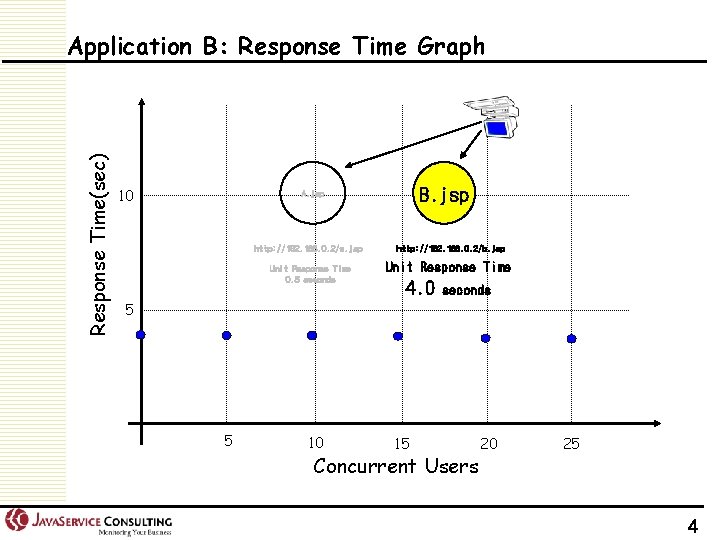
Response Time(sec) Application B: Response Time Graph 10 B. jsp A. jsp http: //192. 168. 0. 2/a. jsp Unit Response Time 0. 5 seconds http: //192. 168. 0. 2/b. jsp Unit Response Time 4. 0 seconds 5 5 10 15 Concurrent Users 20 25 4
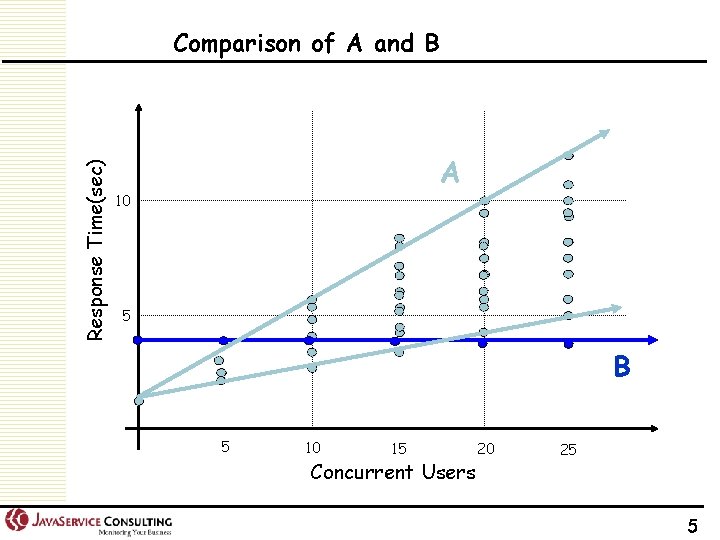
Response Time(sec) Comparison of A and B A 10 5 B 5 10 15 Concurrent Users 20 25 5
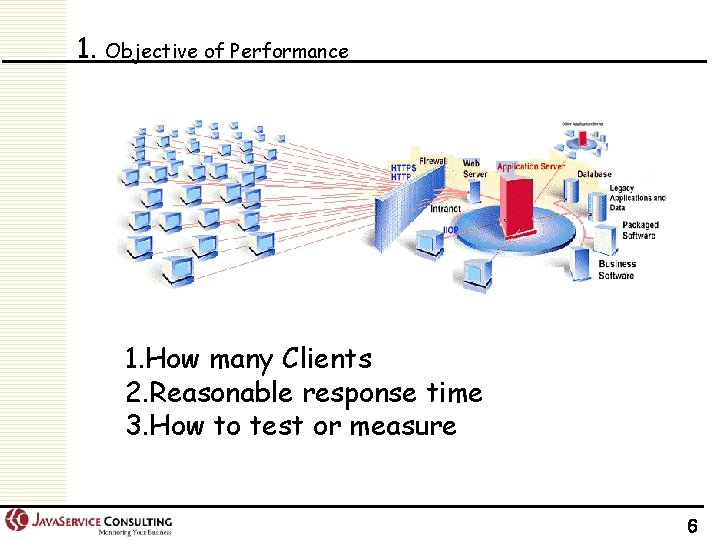
1. Objective of Performance 1. How many Clients 2. Reasonable response time 3. How to test or measure 6
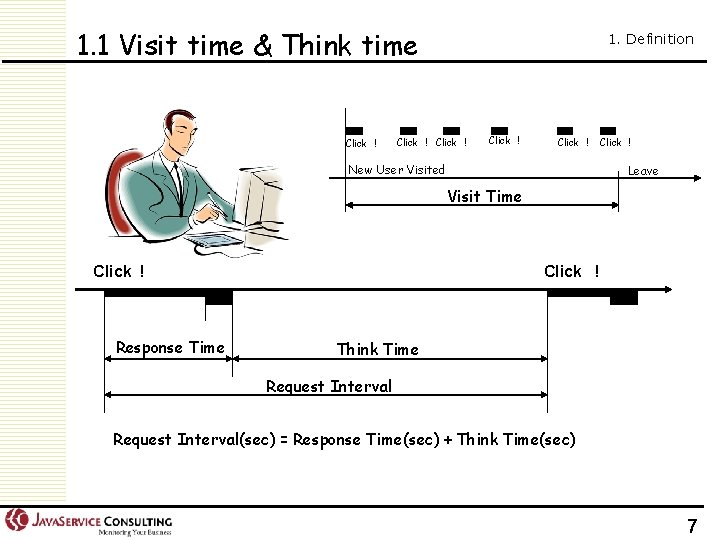
1. 1 Visit time & Think time Click ! 1. Definition Click ! Click ! New User Visited Leave Visit Time Click ! Response Time Click ! Think Time Request Interval(sec) = Response Time(sec) + Think Time(sec) 7
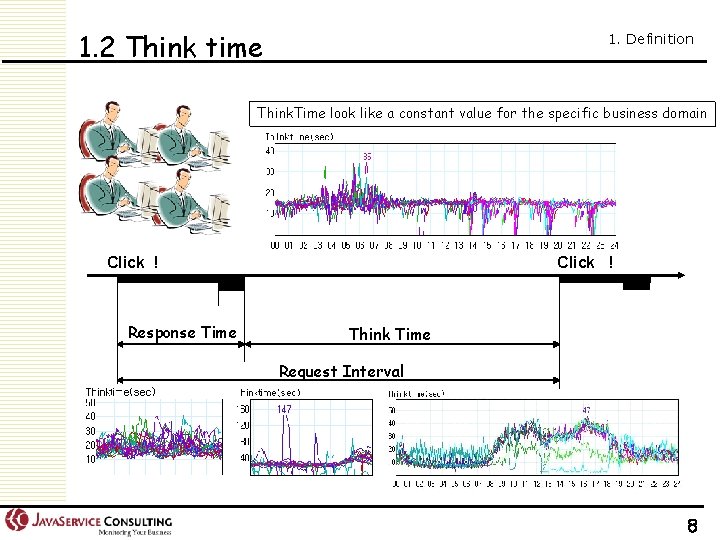
1. 2 Think time 1. Definition Think. Time look like a constant value for the specific business domain Click ! Response Time Click ! Think Time Request Interval 8
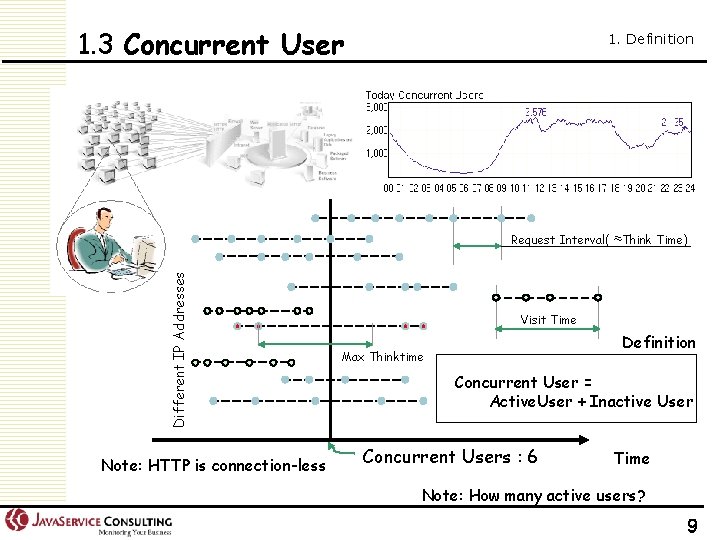
1. 3 Concurrent User 1. Definition Different IP Addresses Request Interval( ≈Think Time) Note: HTTP is connection-less Visit Time Definition Max Thinktime Concurrent User = Active. User + Inactive User Concurrent Users : 6 Time Note: How many active users? 9
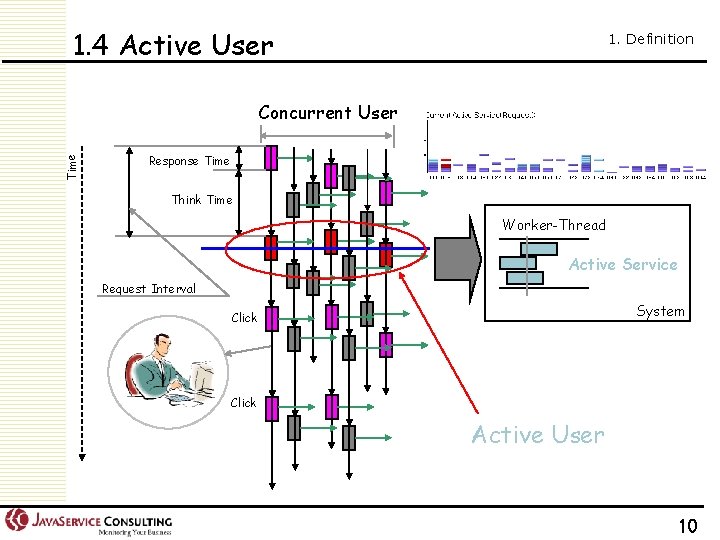
1. 4 Active User 1. Definition Time Concurrent User Response Time Think Time Worker-Thread Active Service Request Interval System Click Active User 10
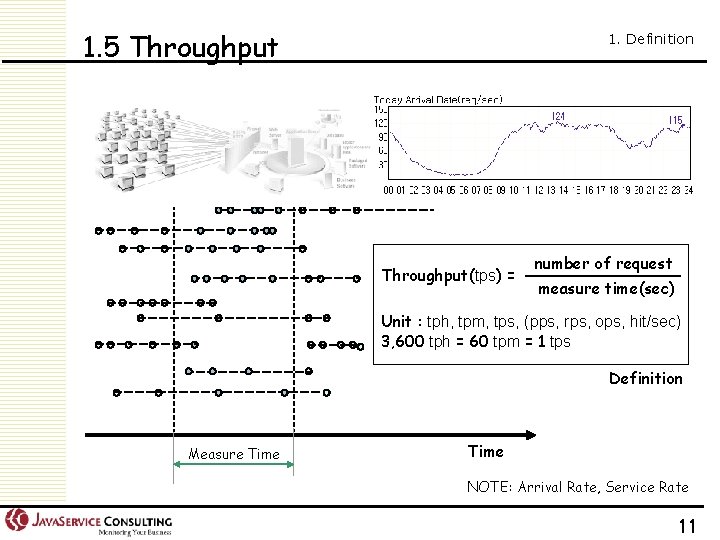
1. 5 Throughput 1. Definition Throughput(tps) = number of request measure time(sec) Unit : tph, tpm, tps, (pps, rps, ops, hit/sec) 3, 600 tph = 60 tpm = 1 tps Definition Measure Time NOTE: Arrival Rate, Service Rate 11
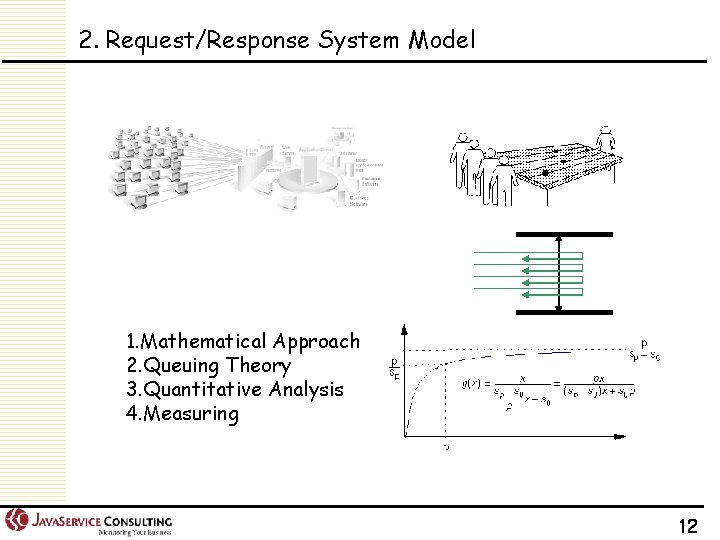
2. Request/Response System Model 1. Mathematical Approach 2. Queuing Theory 3. Quantitative Analysis 4. Measuring 12
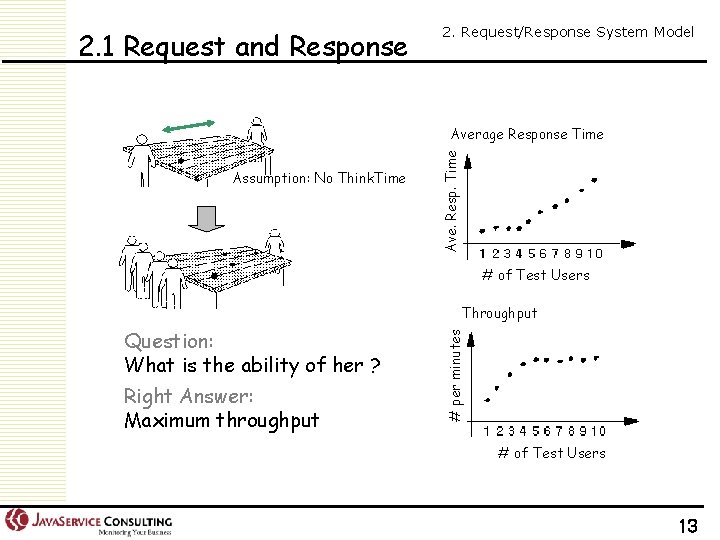
2. 1 Request and Response 2. Request/Response System Model Assumption: No Think. Time Ave. Resp. Time Average Response Time # of Test Users Question: What is the ability of her ? Right Answer: Maximum throughput # per minutes Throughput # of Test Users 13
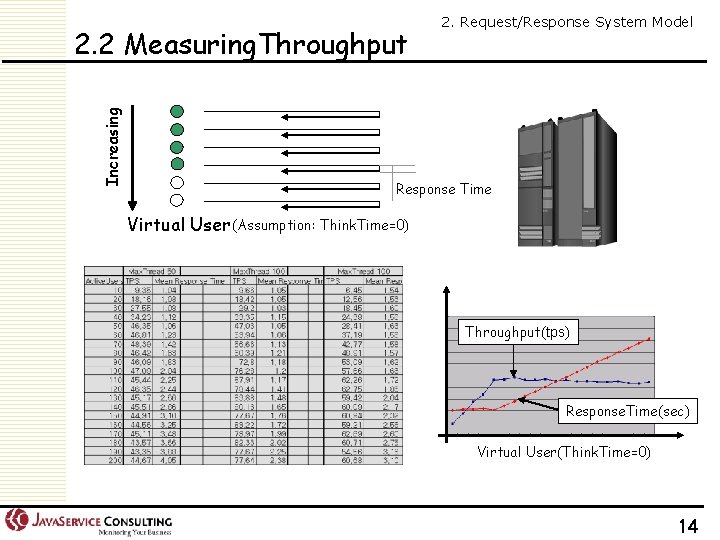
Increasing 2. 2 Measuring. Throughput 2. Request/Response System Model Response Time Virtual User (Assumption: Think. Time=0) Throughput(tps) Response. Time(sec) Virtual User(Think. Time=0) 14
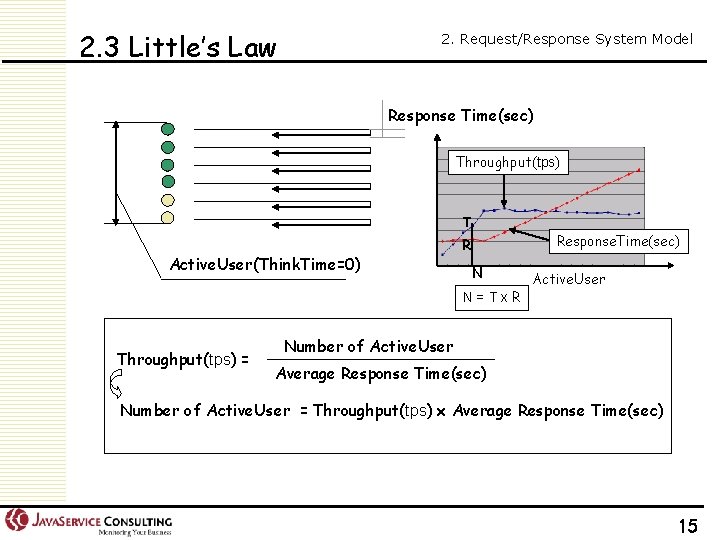
2. 3 Little’s Law 2. Request/Response System Model Response Time(sec) Throughput(tps) T Active. User(Think. Time=0) Response. Time(sec) R N N=Tx. R Throughput(tps) = Active. User Number of Active. User Average Response Time(sec) Number of Active. User = Throughput(tps) x Average Response Time(sec) 15
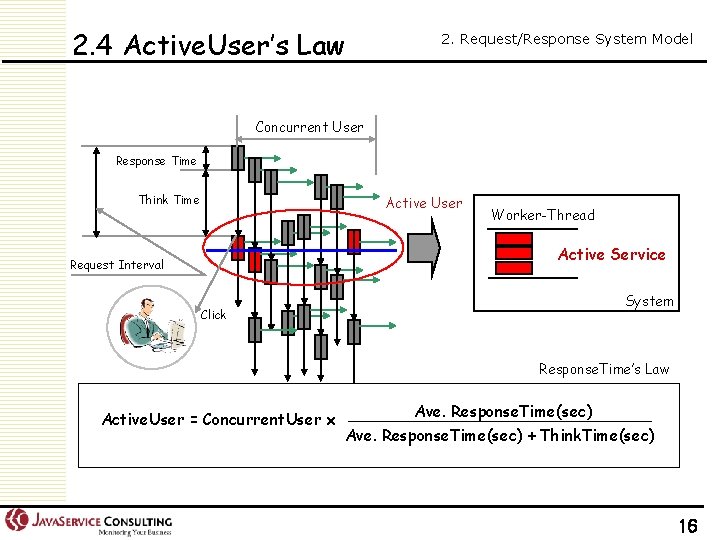
2. 4 Active. User’s Law 2. Request/Response System Model Concurrent User Response Time Think Time Active User Worker-Thread Active Service Request Interval System Click Response. Time’s Law Active. User = Concurrent. User x Ave. Response. Time(sec) + Think. Time(sec) 16
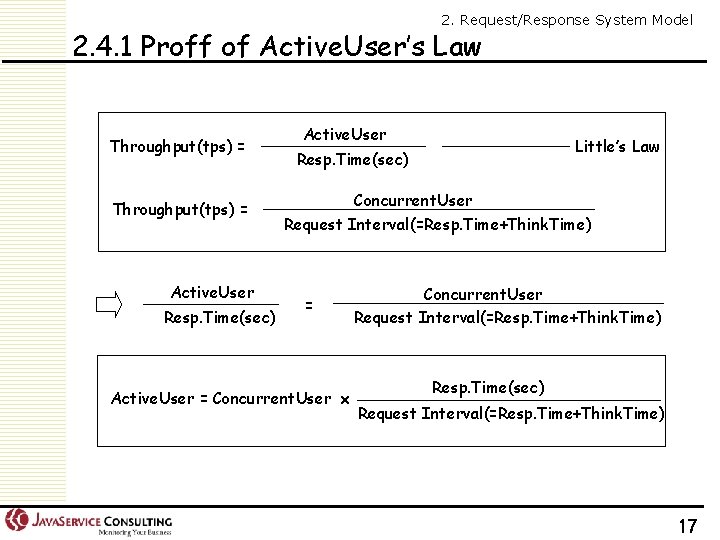
2. Request/Response System Model 2. 4. 1 Proff of Active. User’s Law Throughput(tps) = Active. User Resp. Time(sec) Active. User Little’s Law Resp. Time(sec) Concurrent. User Request Interval(=Resp. Time+Think. Time) = Active. User = Concurrent. User x Concurrent. User Request Interval(=Resp. Time+Think. Time) Resp. Time(sec) Request Interval(=Resp. Time+Think. Time) 17
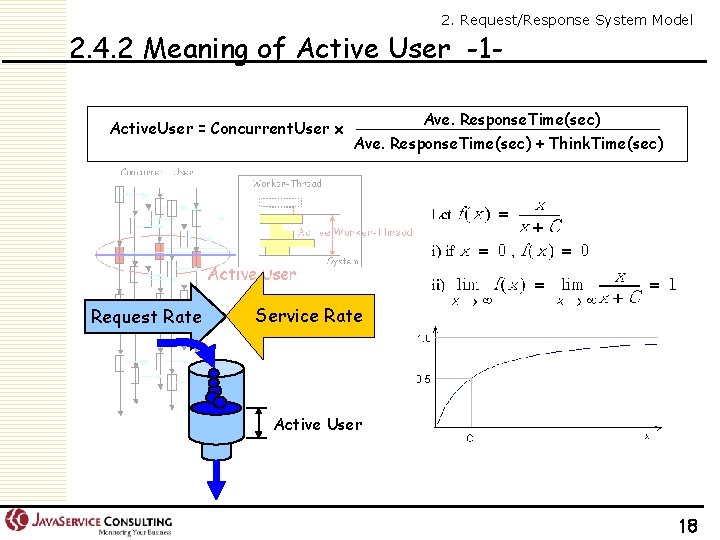
2. Request/Response System Model 2. 4. 2 Meaning of Active User -1 Active. User = Concurrent. User x Request Rate Ave. Response. Time(sec) + Think. Time(sec) Service Rate Active User 18
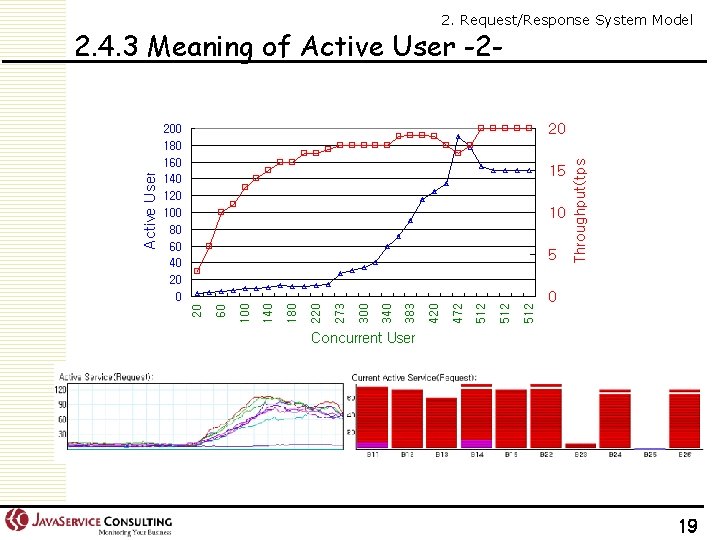
2. Request/Response System Model 2. 4. 3 Meaning of Active User -2 - 19
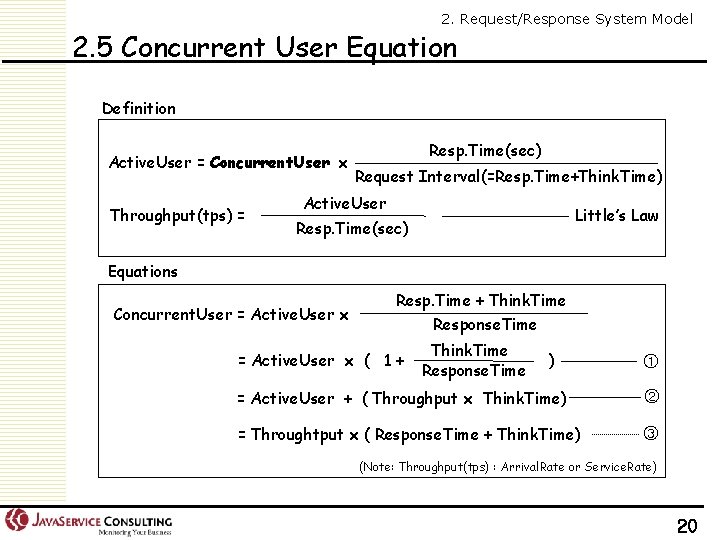
2. Request/Response System Model 2. 5 Concurrent User Equation Definition Active. User = Concurrent. User x Throughput(tps) = Resp. Time(sec) Request Interval(=Resp. Time+Think. Time) Active. User Little’s Law Resp. Time(sec) Equations Concurrent. User = Active. User x Resp. Time + Think. Time Response. Time = Active. User x ( 1 + Think. Time Response. Time ) ① = Active. User + ( Throughput x Think. Time) ② = Throughtput x ( Response. Time + Think. Time) ③ (Note: Throughput(tps) : Arrival. Rate or Service. Rate) 20
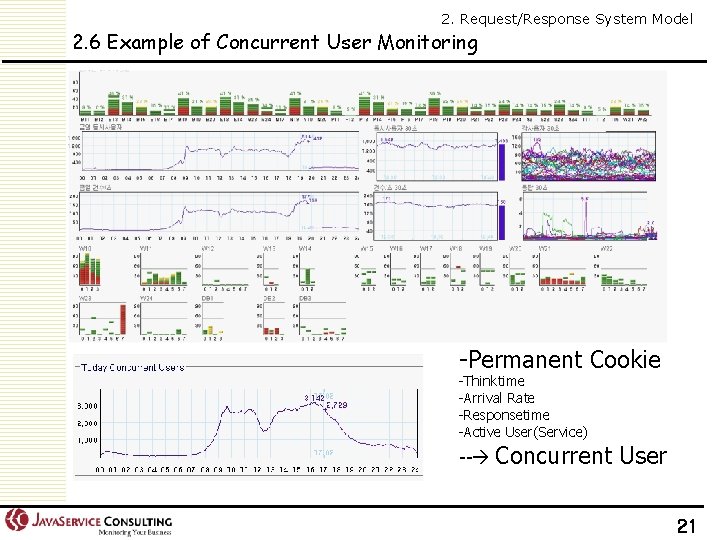
2. Request/Response System Model 2. 6 Example of Concurrent User Monitoring -Permanent Cookie -Thinktime -Arrival Rate -Responsetime -Active User(Service) -- Concurrent User 21
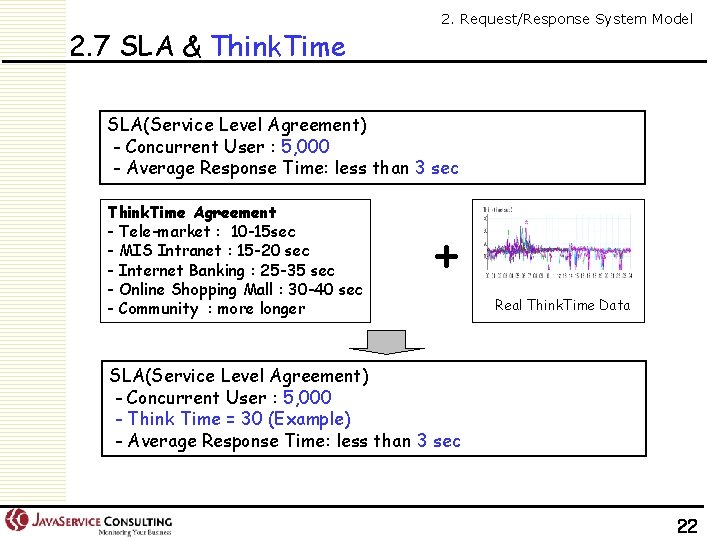
2. 7 SLA & Think. Time 2. Request/Response System Model SLA(Service Level Agreement) - Concurrent User : 5, 000 - Average Response Time: less than 3 sec Think. Time Agreement - Tele-market : 10 -15 sec - MIS Intranet : 15 -20 sec - Internet Banking : 25 -35 sec - Online Shopping Mall : 30 -40 sec - Community : more longer + Real Think. Time Data SLA(Service Level Agreement) - Concurrent User : 5, 000 - Think Time = 30 (Example) - Average Response Time: less than 3 sec 22
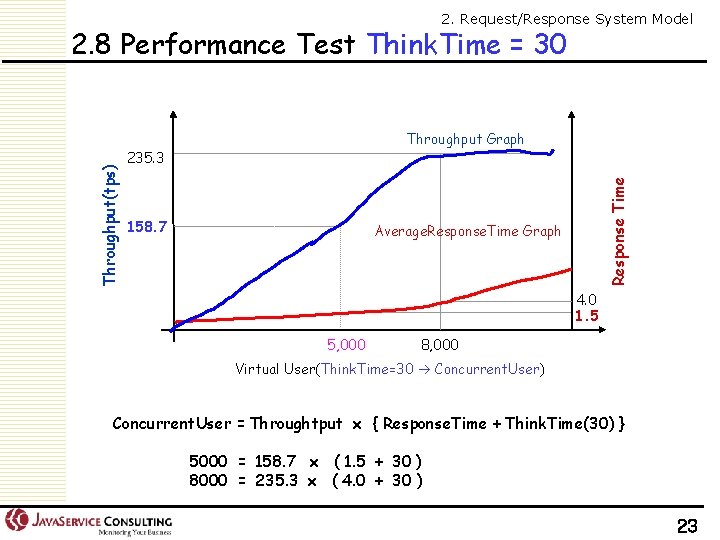
2. Request/Response System Model 2. 8 Performance Test Think. Time = 30 235. 3 158. 7 Response Time Throughput(tps) Throughput Graph Average. Response. Time Graph 4. 0 1. 5 5, 000 8, 000 Virtual User(Think. Time=30 Concurrent. User) Concurrent. User = Throughtput x { Response. Time + Think. Time(30) } 5000 = 158. 7 x ( 1. 5 + 30 ) 8000 = 235. 3 x ( 4. 0 + 30 ) 23
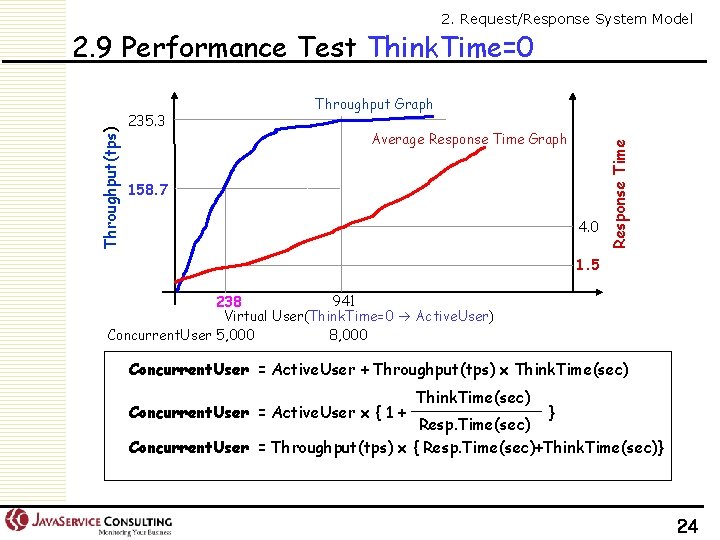
2. Request/Response System Model 235. 3 Throughput Graph Average Response Time Graph 158. 7 4. 0 Response Time Throughput(tps) 2. 9 Performance Test Think. Time=0 1. 5 941 238 Virtual User(Think. Time=0 Active. User) Concurrent. User 5, 000 8, 000 Concurrent. User = Active. User + Throughput(tps) x Think. Time(sec) Concurrent. User = Active. User x { 1 + Think. Time(sec) } Resp. Time(sec) Concurrent. User = Throughput(tps) x { Resp. Time(sec)+Think. Time(sec)} 24
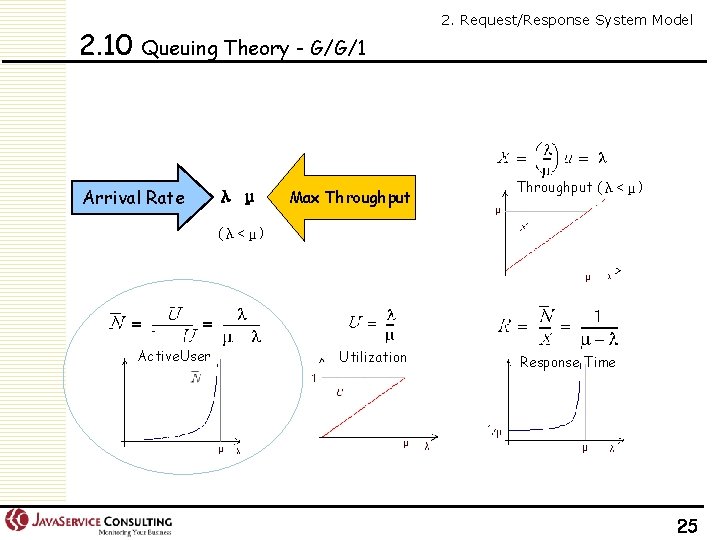
2. 10 Queuing Theory - G/G/1 Arrival Rate λ μ Max Throughput 2. Request/Response System Model Throughput (λ<μ) Active. User Utilization Response Time 25
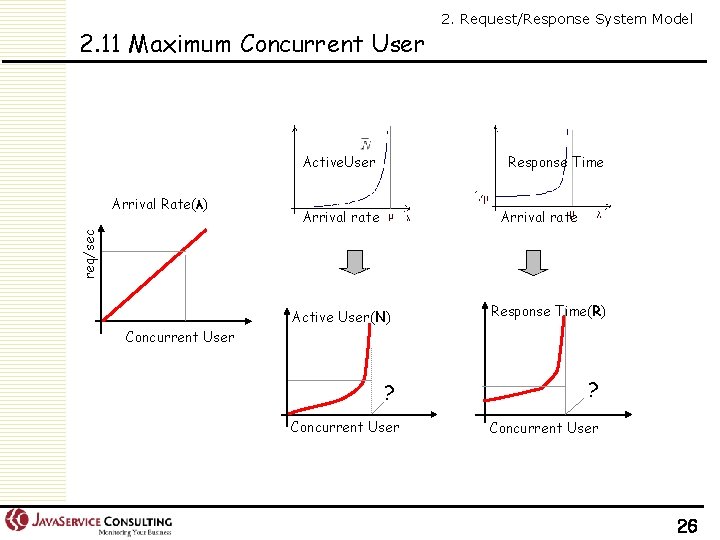
2. 11 Maximum Concurrent User Active. User Response Time Arrival rate req/sec Arrival Rate(λ) 2. Request/Response System Model Active User(N) Response Time(R) Concurrent User ? Concurrent User 26
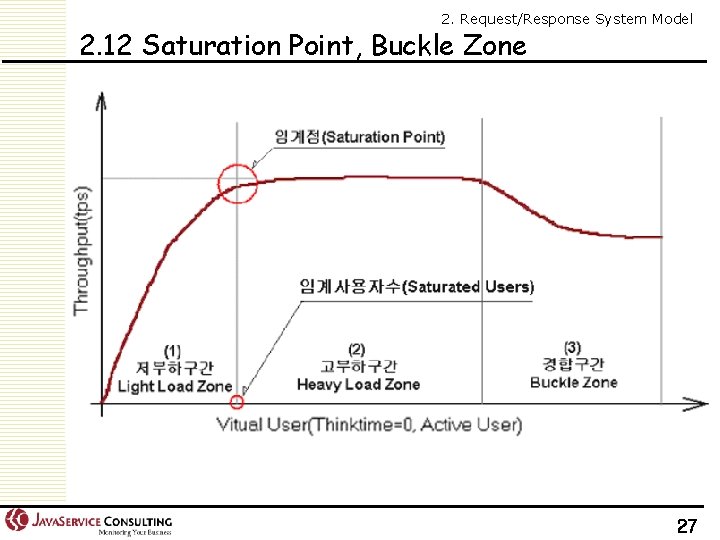
2. Request/Response System Model 2. 12 Saturation Point, Buckle Zone 27
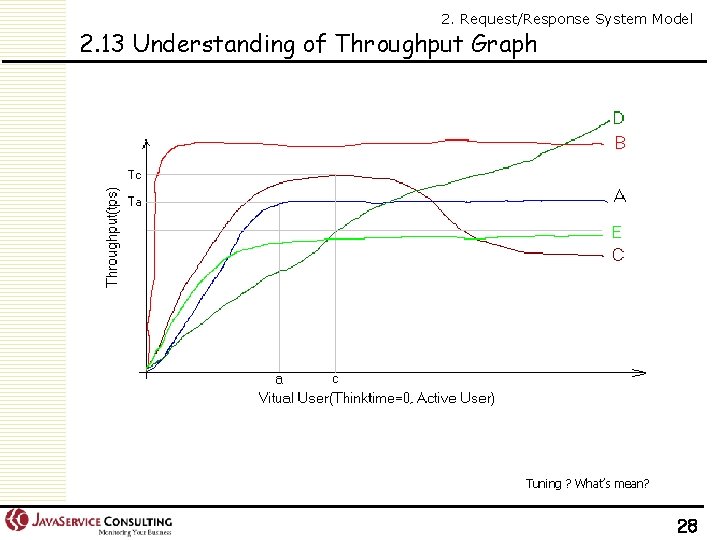
2. Request/Response System Model 2. 13 Understanding of Throughput Graph Tuning ? What’s mean? 28
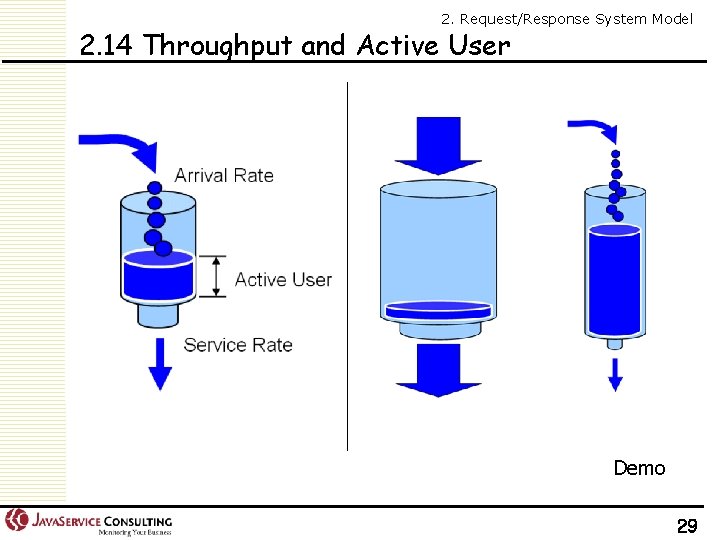
2. Request/Response System Model 2. 14 Throughput and Active User Demo 29
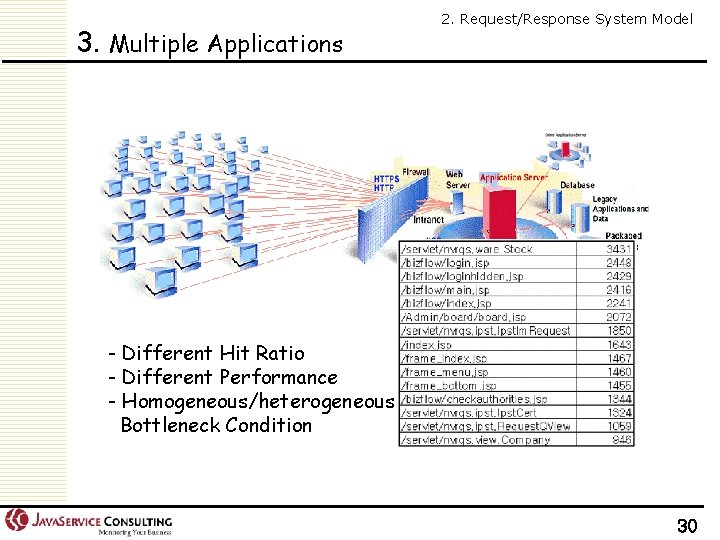
3. Multiple Applications 2. Request/Response System Model - Different Hit Ratio - Different Performance - Homogeneous/heterogeneous Bottleneck Condition 30
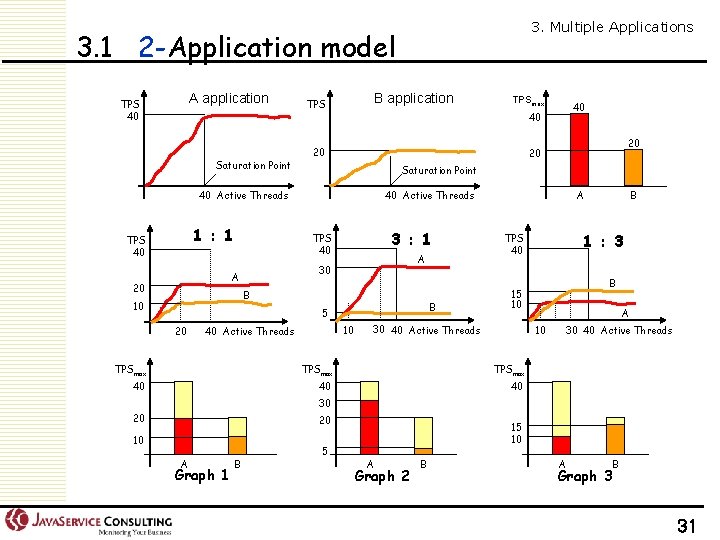
3. Multiple Applications 3. 1 2 -Application model A application TPS 40 Saturation Point B application TPS 1 : 1 20 Saturation Point 40 Active Threads 3 : 1 A 30 B 10 B 5 20 20 20 TPS 40 A 20 40 40 40 Active Threads TPS 40 TPSmax 10 40 Active Threads A 1 : 3 TPS 40 B 15 10 30 40 Active Threads A 10 TPSmax 40 40 40 B 30 40 Active Threads 30 20 20 10 A Graph 1 B 5 15 10 A Graph 2 B A Graph 3 B 31
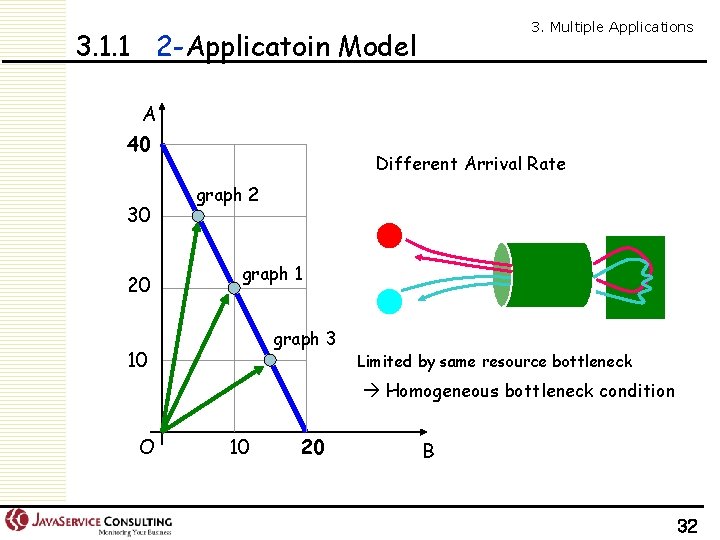
3. Multiple Applications 3. 1. 1 2 -Applicatoin Model A 40 30 20 Different Arrival Rate graph 2 graph 1 graph 3 10 Limited by same resource bottleneck Homogeneous bottleneck condition O 10 20 B 32
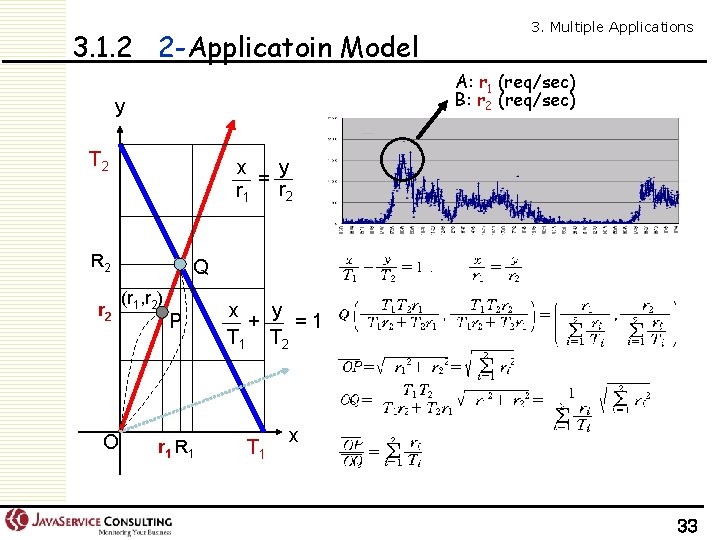
3. 1. 2 2 -Applicatoin Model A: r 1 (req/sec) B: r 2 (req/sec) y T 2 y x = r 1 r 2 R 2 r 2 O 3. Multiple Applications Q (r 1, r 2) P r 1 R 1 y x =1 + T 1 T 2 T 1 x 33
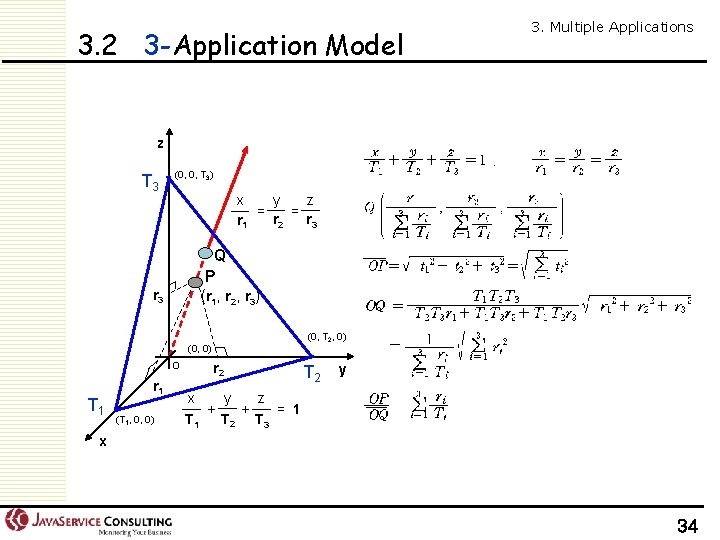
3. 2 3 -Application Model 3. Multiple Applications z T 3 (0, 0, T 3) y z x = = r 2 r 3 r 1 Q P (r 1, r 2, r 3) r 3 (0, T 2, 0) (0, 0) O T 1 r 1 (T 1, 0, 0) r 2 T 2 y y x z = 1 + + T 2 T 3 T 1 x 34
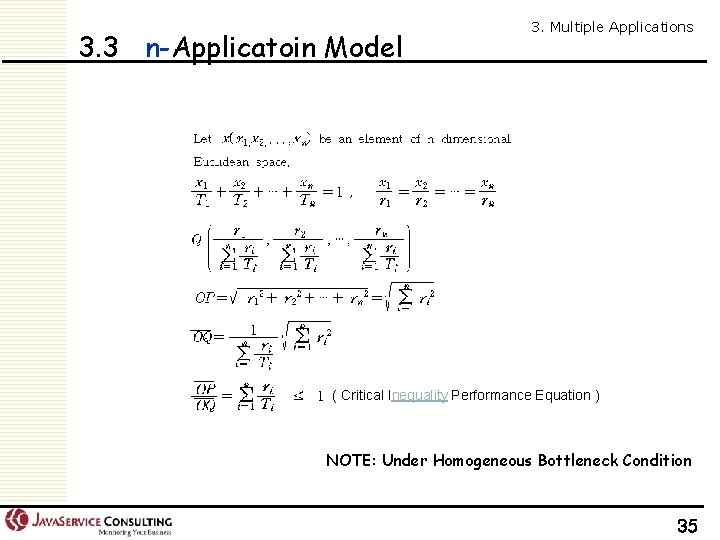
3. 3 n-Applicatoin Model 3. Multiple Applications ( Critical Inequality Performance Equation ) NOTE: Under Homogeneous Bottleneck Condition 35
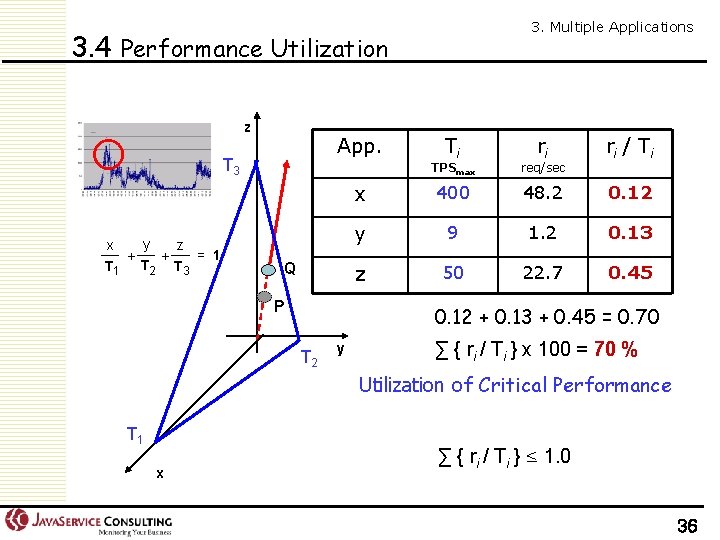
3. Multiple Applications 3. 4 Performance Utilization z App. T 3 y x z = 1 + + T 1 T 2 T 3 Q P Ti TPSmax ri req/sec ri / Ti x 400 48. 2 0. 12 y 9 1. 2 0. 13 z 50 22. 7 0. 45 0. 12 + 0. 13 + 0. 45 = 0. 70 T 2 y ∑ { ri / Ti } x 100 = 70 % Utilization of Critical Performance T 1 x ∑ { ri / Ti } ≤ 1. 0 36
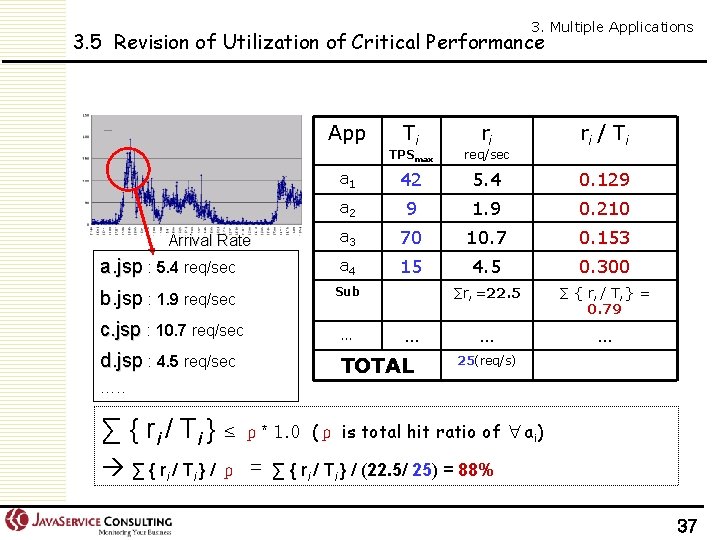
3. Multiple Applications 3. 5 Revision of Utilization of Critical Performance App TPSmax ri req/sec ri / Ti a 1 42 5. 4 0. 129 a 2 9 1. 9 0. 210 a 3 70 10. 7 0. 153 a. jsp : 5. 4 req/sec a 4 15 4. 5 0. 300 b. jsp : 1. 9 req/sec Sub ∑ri =22. 5 ∑ { ri / Ti } = 0. 79 … … Arrival Rate Ti c. jsp : 10. 7 req/sec … d. jsp : 4. 5 req/sec TOTAL … 25(req/s) …. . ∑ { ri / Ti } ≤ ρ* 1. 0 ∑ { ri / T i } / ρ = (ρ is total hit ratio of ∀ai) ∑ { ri / Ti } / (22. 5/ 25) = 88% 37
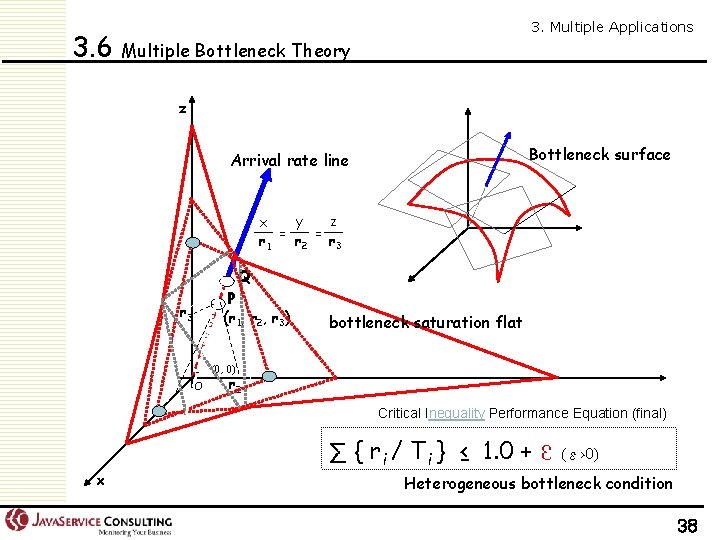
3. Multiple Applications 3. 6 Multiple Bottleneck Theory z Bottleneck surface Arrival rate line y z x = = r 2 r 3 r 1 Q P (r 1, r 2, r 3) r 3 bottleneck saturation flat (0, 0) O r 2 Critical Inequality Performance Equation (final) ∑ { ri / Ti } ≤ 1. 0 +ε(ε>0) x Heterogeneous bottleneck condition 38
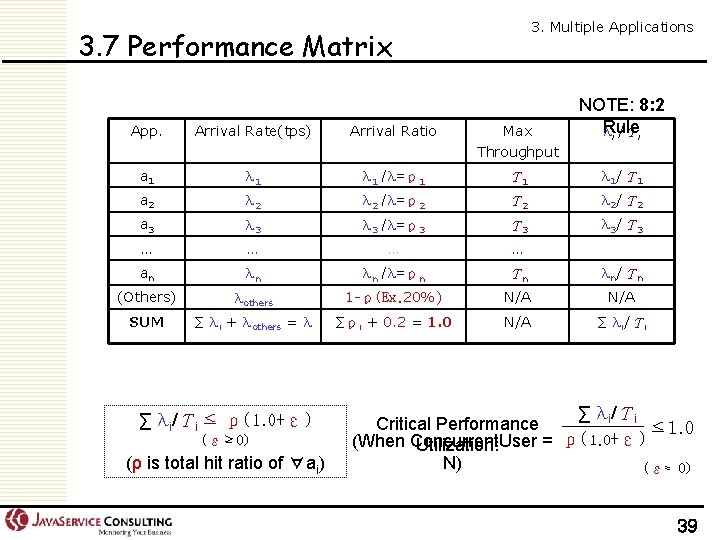
3. Multiple Applications 3. 7 Performance Matrix NOTE: 8: 2 Rule λ i /Τi App. Arrival Rate(tps) Arrival Ratio Max Throughput a 1 λ 1 /λ=ρ1 Τ 1 λ 1/Τ 1 a 2 λ 2 /λ=ρ2 Τ 2 λ 2/Τ 2 a 3 λ 3 /λ=ρ3 Τ 3 λ 3/Τ 3 … … an λn λn /λ=ρn Τn λn/Τn (Others) λothers 1 -ρ(Ex. 20%) N/A SUM ∑ λi + λothers = λ ∑ρi + 0. 2 = 1. 0 N/A ∑ λi/Τi ≤ ρ(1. 0+ε) (ε≥ 0) (ρ is total hit ratio of ∀ai) ∑ λi/Τi Critical Performance ≤ 1. 0 ρ( 1. 0 +ε) (When Concurrent. User = Utilization: N) (ε≈ 0) 39
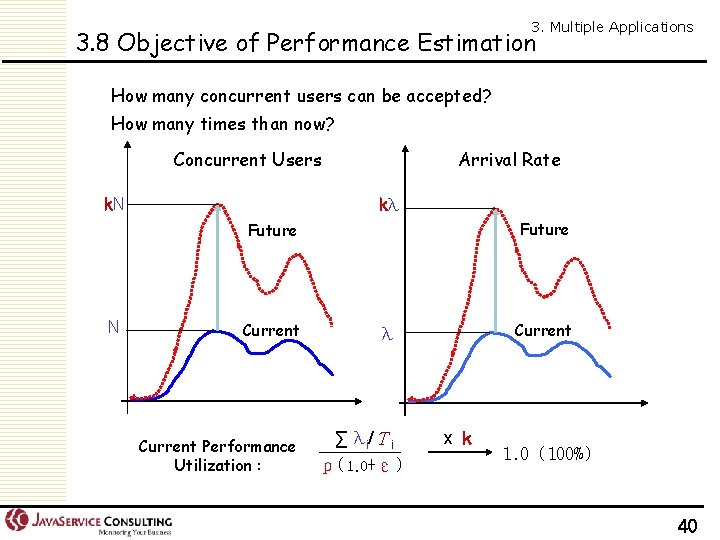
3. Multiple Applications 3. 8 Objective of Performance Estimation How many concurrent users can be accepted? How many times than now? Concurrent Users k. N Arrival Rate kλ Future N Current Performance Utilization : Current λ ∑ λi/Τi ρ(1. 0+ε) x k 1. 0 (100%) 40
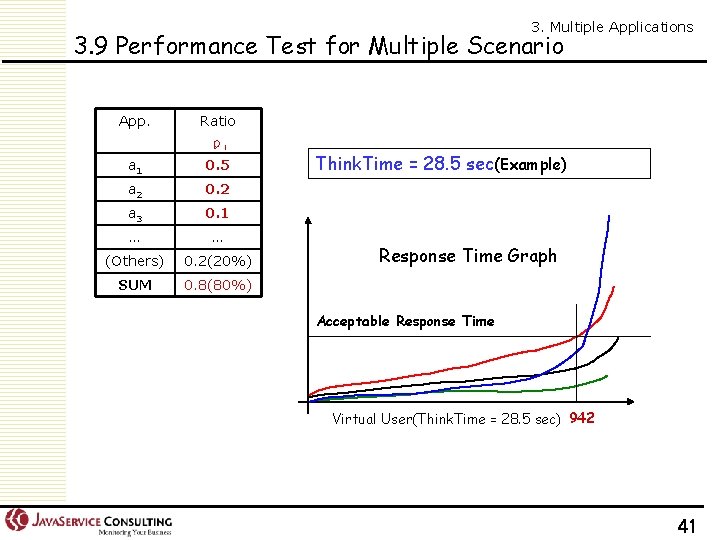
3. Multiple Applications 3. 9 Performance Test for Multiple Scenario App. Ratio ρi a 1 0. 5 a 2 0. 2 a 3 0. 1 … … (Others) 0. 2(20%) SUM 0. 8(80%) Think. Time = 28. 5 sec(Example) Response Time Graph Acceptable Response Time Virtual User(Think. Time = 28. 5 sec) 942 41
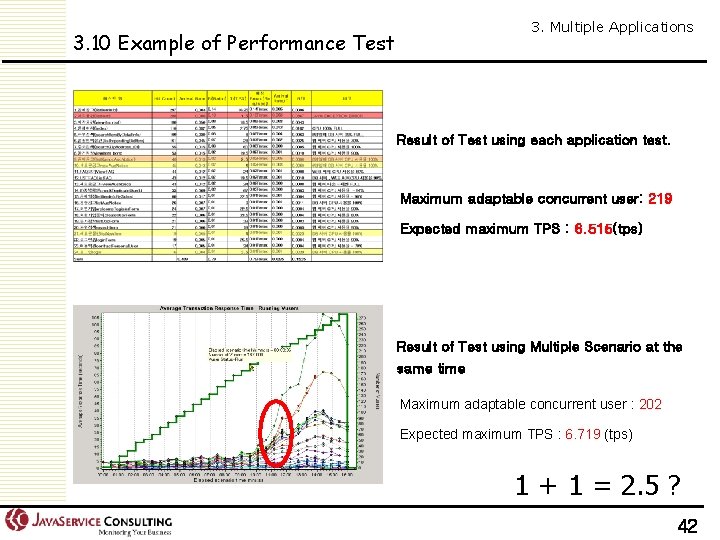
3. Multiple Applications 3. 10 Example of Performance Test Result of Test using each application test. Maximum adaptable concurrent user: 219 Expected maximum TPS : 6. 515(tps) Result of Test using Multiple Scenario at the same time Maximum adaptable concurrent user : 202 Expected maximum TPS : 6. 719 (tps) 1 + 1 = 2. 5 ? 42
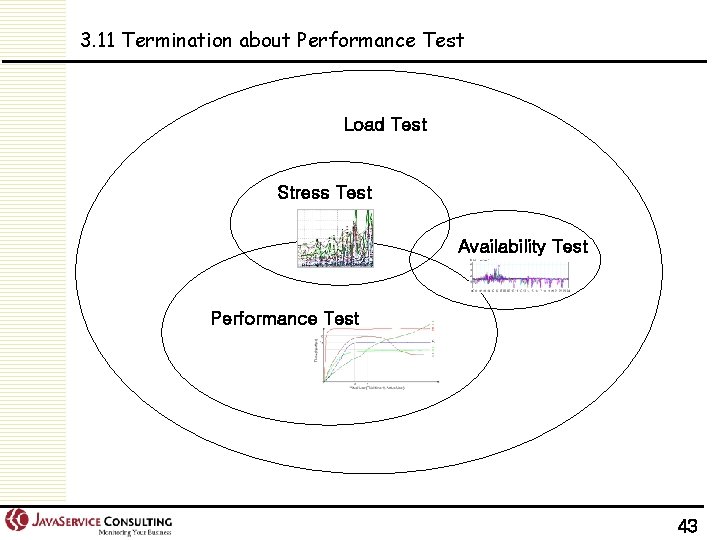
3. 11 Termination about Performance Test Load Test Stress Test Availability Test Performance Test 43
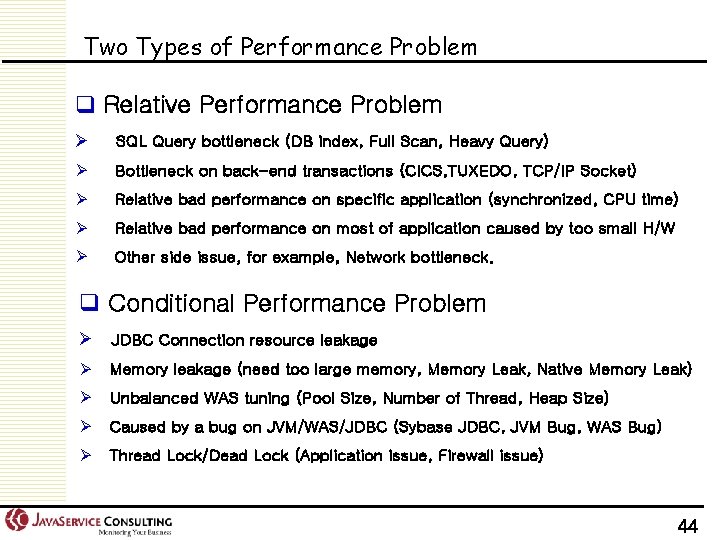
Two Types of Performance Problem q Relative Performance Problem Ø SQL Query bottleneck (DB index, Full Scan, Heavy Query) Ø Bottleneck on back-end transactions (CICS, TUXEDO, TCP/IP Socket) Ø Relative bad performance on specific application (synchronized, CPU time) Ø Relative bad performance on most of application caused by too small H/W Ø Other side issue, for example, Network bottleneck. q Conditional Performance Problem Ø JDBC Connection resource leakage Ø Memory leakage (need too large memory, Memory Leak, Native Memory Leak) Ø Unbalanced WAS tuning (Pool Size, Number of Thread, Heap Size) Ø Caused by a bug on JVM/WAS/JDBC (Sybase JDBC, JVM Bug, WAS Bug) Ø Thread Lock/Dead Lock (Application issue, Firewall issue) 44
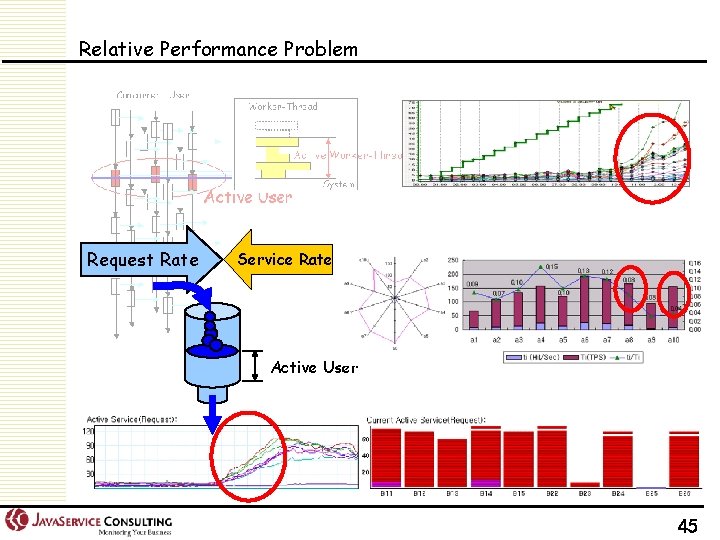
Relative Performance Problem Request Rate Service Rate Active User 45
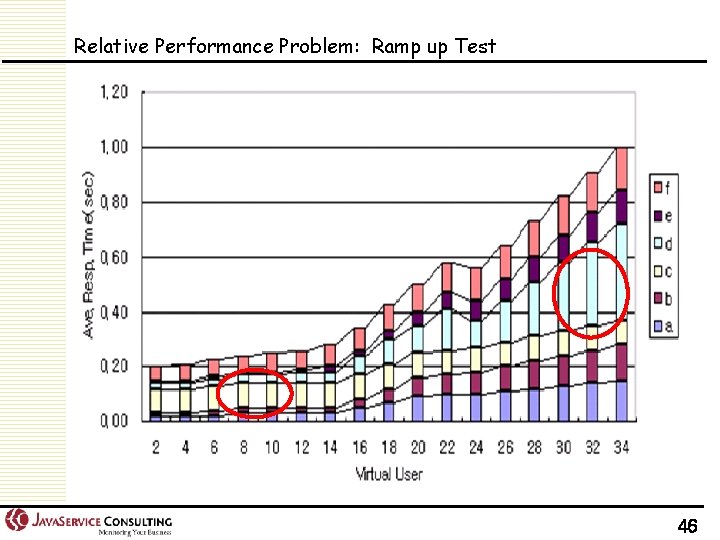
Relative Performance Problem: Ramp up Test 46
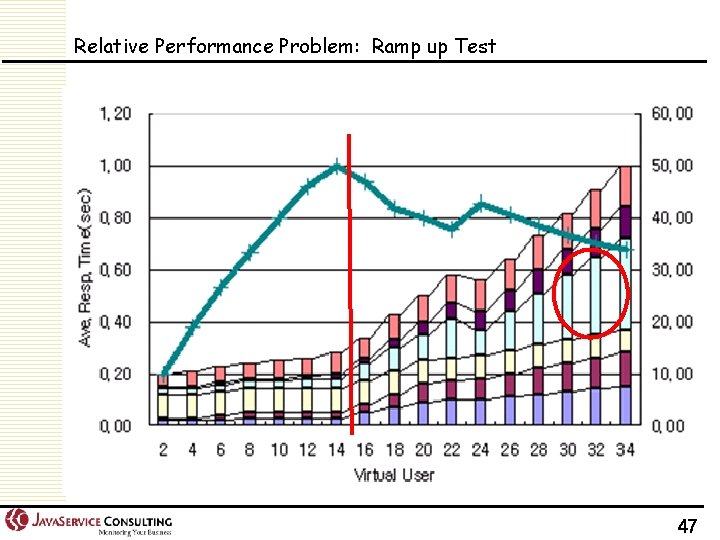
Relative Performance Problem: Ramp up Test 47
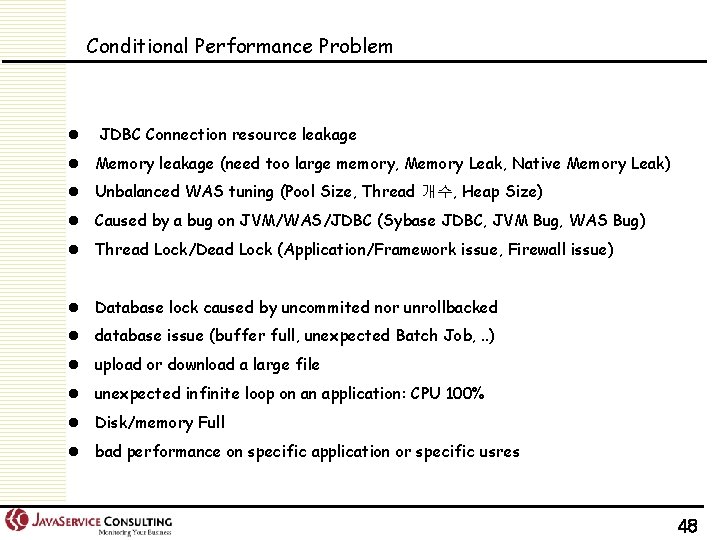
Conditional Performance Problem l JDBC Connection resource leakage l Memory leakage (need too large memory, Memory Leak, Native Memory Leak) l Unbalanced WAS tuning (Pool Size, Thread 개수, Heap Size) l Caused by a bug on JVM/WAS/JDBC (Sybase JDBC, JVM Bug, WAS Bug) l Thread Lock/Dead Lock (Application/Framework issue, Firewall issue) l Database lock caused by uncommited nor unrollbacked l database issue (buffer full, unexpected Batch Job, . . ) l upload or download a large file l unexpected infinite loop on an application: CPU 100% l Disk/memory Full l bad performance on specific application or specific usres 48
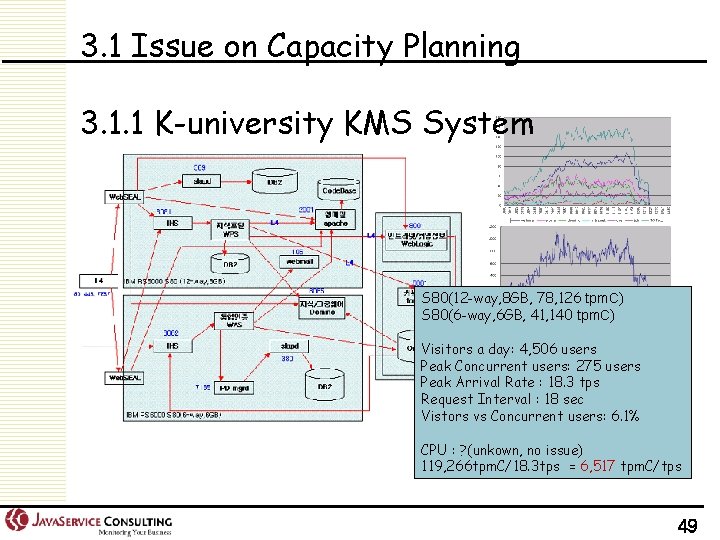
3. 1 Issue on Capacity Planning 3. 1. 1 K-university KMS System S 80(12 -way, 8 GB, 78, 126 tpm. C) S 80(6 -way, 6 GB, 41, 140 tpm. C) Visitors a day: 4, 506 users Peak Concurrent users: 275 users Peak Arrival Rate : 18. 3 tps Request Interval : 18 sec Vistors vs Concurrent users: 6. 1% CPU : ? (unkown, no issue) 119, 266 tpm. C/18. 3 tps = 6, 517 tpm. C/tps 49
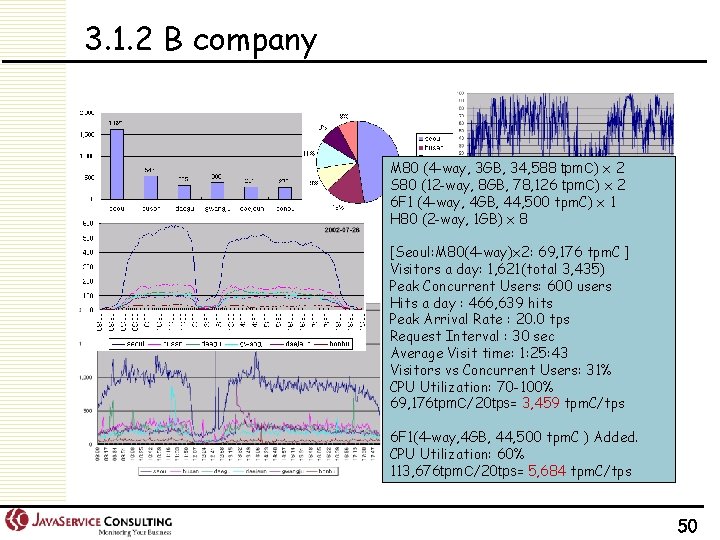
3. 1. 2 B company M 80 (4 -way, 3 GB, 34, 588 tpm. C) x 2 S 80 (12 -way, 8 GB, 78, 126 tpm. C) x 2 6 F 1 (4 -way, 4 GB, 44, 500 tpm. C) x 1 H 80 (2 -way, 1 GB) x 8 [Seoul: M 80(4 -way)x 2: 69, 176 tpm. C ] Visitors a day: 1, 621(total 3, 435) Peak Concurrent Users: 600 users Hits a day : 466, 639 hits Peak Arrival Rate : 20. 0 tps Request Interval : 30 sec Average Visit time: 1: 25: 43 Visitors vs Concurrent Users: 31% CPU Utilization: 70 -100% 69, 176 tpm. C/20 tps= 3, 459 tpm. C/tps 6 F 1(4 -way, 4 GB, 44, 500 tpm. C ) Added. CPU Utilization: 60% 113, 676 tpm. C/20 tps= 5, 684 tpm. C/tps 50
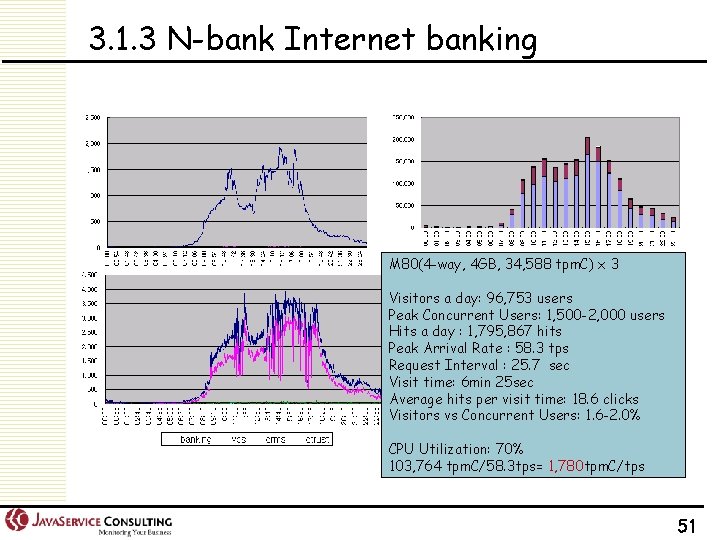
3. 1. 3 N-bank Internet banking M 80(4 -way, 4 GB, 34, 588 tpm. C) x 3 Visitors a day: 96, 753 users Peak Concurrent Users: 1, 500 -2, 000 users Hits a day : 1, 795, 867 hits Peak Arrival Rate : 58. 3 tps Request Interval : 25. 7 sec Visit time: 6 min 25 sec Average hits per visit time: 18. 6 clicks Visitors vs Concurrent Users: 1. 6 -2. 0% CPU Utilization: 70% 103, 764 tpm. C/58. 3 tps= 1, 780 tpm. C/tps 51
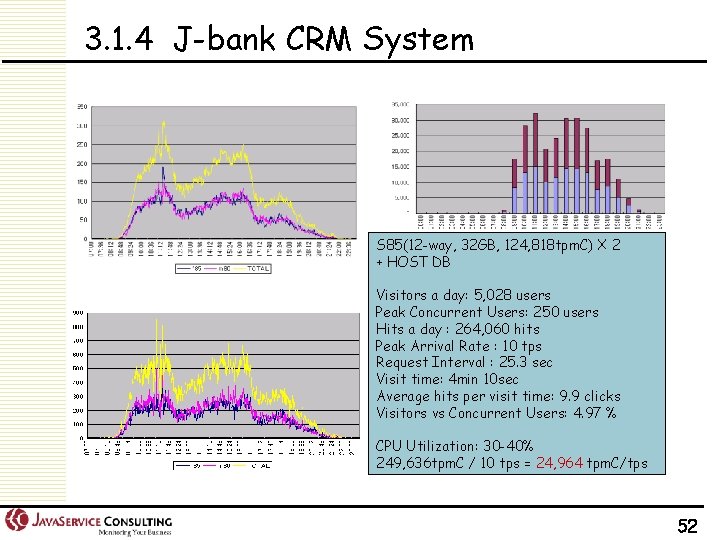
3. 1. 4 J-bank CRM System S 85(12 -way, 32 GB, 124, 818 tpm. C) X 2 + HOST DB Visitors a day: 5, 028 users Peak Concurrent Users: 250 users Hits a day : 264, 060 hits Peak Arrival Rate : 10 tps Request Interval : 25. 3 sec Visit time: 4 min 10 sec Average hits per visit time: 9. 9 clicks Visitors vs Concurrent Users: 4. 97 % CPU Utilization: 30 -40% 249, 636 tpm. C / 10 tps = 24, 964 tpm. C/tps 52
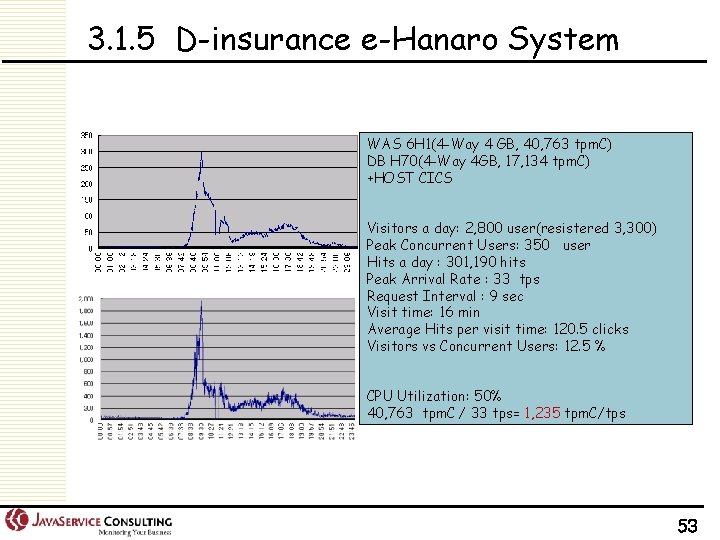
3. 1. 5 D-insurance e-Hanaro System WAS 6 H 1(4 -Way 4 GB, 40, 763 tpm. C) DB H 70(4 -Way 4 GB, 17, 134 tpm. C) +HOST CICS Visitors a day: 2, 800 user(resistered 3, 300) Peak Concurrent Users: 350 user Hits a day : 301, 190 hits Peak Arrival Rate : 33 tps Request Interval : 9 sec Visit time: 16 min Average Hits per visit time: 120. 5 clicks Visitors vs Concurrent Users: 12. 5 % CPU Utilization: 50% 40, 763 tpm. C / 33 tps= 1, 235 tpm. C/tps 53
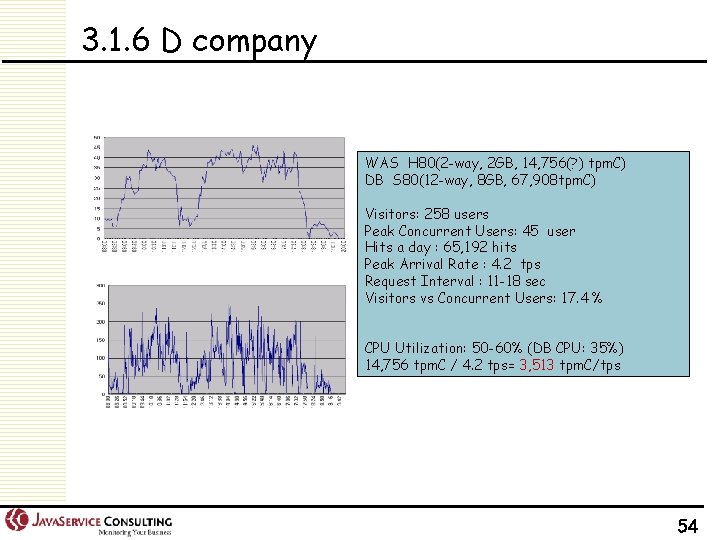
3. 1. 6 D company WAS H 80(2 -way, 2 GB, 14, 756(? ) tpm. C) DB S 80(12 -way, 8 GB, 67, 908 tpm. C) Visitors: 258 users Peak Concurrent Users: 45 user Hits a day : 65, 192 hits Peak Arrival Rate : 4. 2 tps Request Interval : 11 -18 sec Visitors vs Concurrent Users: 17. 4 % CPU Utilization: 50 -60% (DB CPU: 35%) 14, 756 tpm. C / 4. 2 tps= 3, 513 tpm. C/tps 54
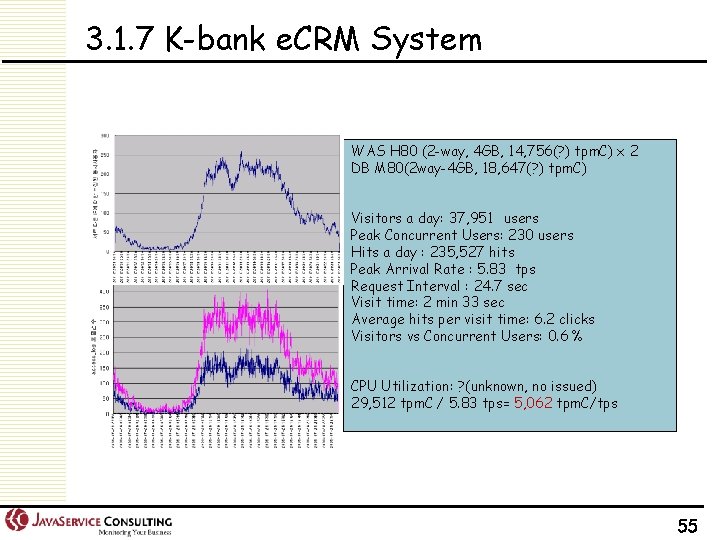
3. 1. 7 K-bank e. CRM System WAS H 80 (2 -way, 4 GB, 14, 756(? ) tpm. C) x 2 DB M 80(2 way-4 GB, 18, 647(? ) tpm. C) Visitors a day: 37, 951 users Peak Concurrent Users: 230 users Hits a day : 235, 527 hits Peak Arrival Rate : 5. 83 tps Request Interval : 24. 7 sec Visit time: 2 min 33 sec Average hits per visit time: 6. 2 clicks Visitors vs Concurrent Users: 0. 6 % CPU Utilization: ? (unknown, no issued) 29, 512 tpm. C / 5. 83 tps= 5, 062 tpm. C/tps 55
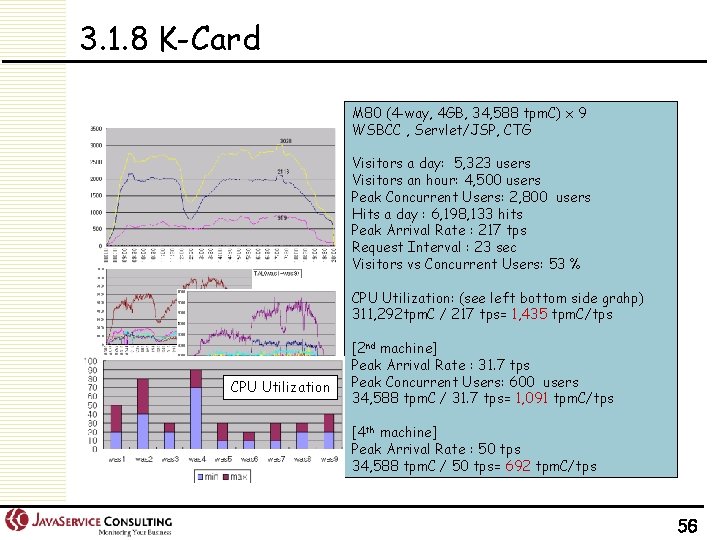
3. 1. 8 K-Card M 80 (4 -way, 4 GB, 34, 588 tpm. C) x 9 WSBCC , Servlet/JSP, CTG Visitors a day: 5, 323 users Visitors an hour: 4, 500 users Peak Concurrent Users: 2, 800 users Hits a day : 6, 198, 133 hits Peak Arrival Rate : 217 tps Request Interval : 23 sec Visitors vs Concurrent Users: 53 % CPU Utilization: (see left bottom side grahp) 311, 292 tpm. C / 217 tps= 1, 435 tpm. C/tps CPU Utilization [2 nd machine] Peak Arrival Rate : 31. 7 tps Peak Concurrent Users: 600 users 34, 588 tpm. C / 31. 7 tps= 1, 091 tpm. C/tps [4 th machine] Peak Arrival Rate : 50 tps 34, 588 tpm. C / 50 tps= 692 tpm. C/tps 56
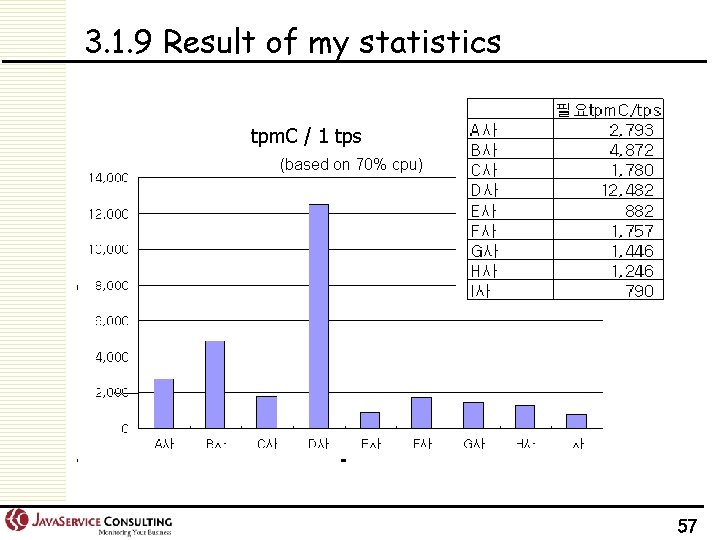
3. 1. 9 Result of my statistics tpm. C / 1 tps (based on 70% cpu) 57
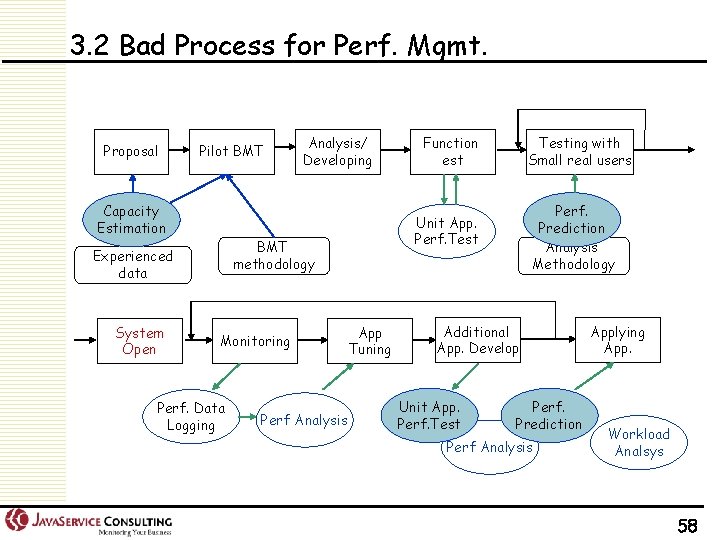
3. 2 Bad Process for Perf. Mgmt. Proposal Pilot BMT Capacity Estimation Monitoring Perf. Data Logging Perf Analysis Function est Testing with Small real users Perf. Prediction Analysis Methodology Unit App. Perf. Test BMT methodology Experienced data System Open Analysis/ Developing App Tuning Additional App. Develop Unit App. Perf. Test Perf. Prediction Perf Analysis Applying App. Workload Analsys 58
59
- Slides: 59