
Math for Liberal Studies Section 2 7 Apportionment
Math for Liberal Studies Section 2. 7: Apportionment
Unequal Representation �The US Senate has 100 members: two for each state �In the US House of Representatives, states are represented based on population PA has 19 representatives Delaware has 1

Apportionment �The process by which seats are assigned based on population is called apportionment �The number of seats each state gets is also called that state’s apportionment
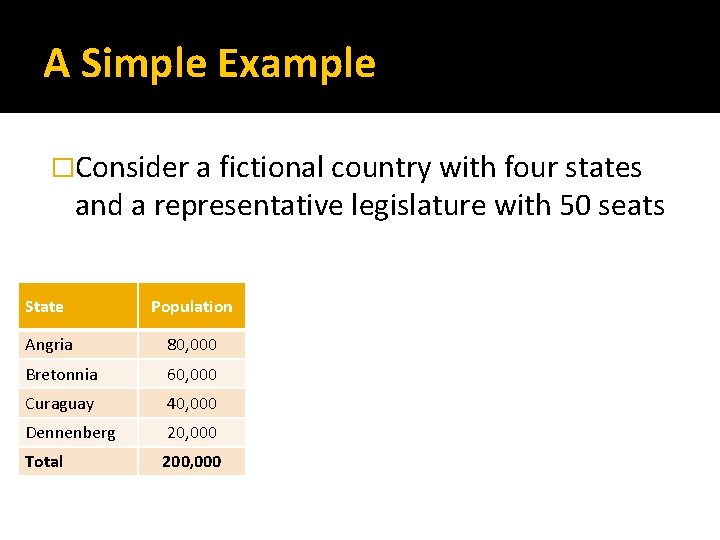
A Simple Example �Consider a fictional country with four states and a representative legislature with 50 seats State Population Angria 80, 000 Bretonnia 60, 000 Curaguay 40, 000 Dennenberg 20, 000 Total 200, 000
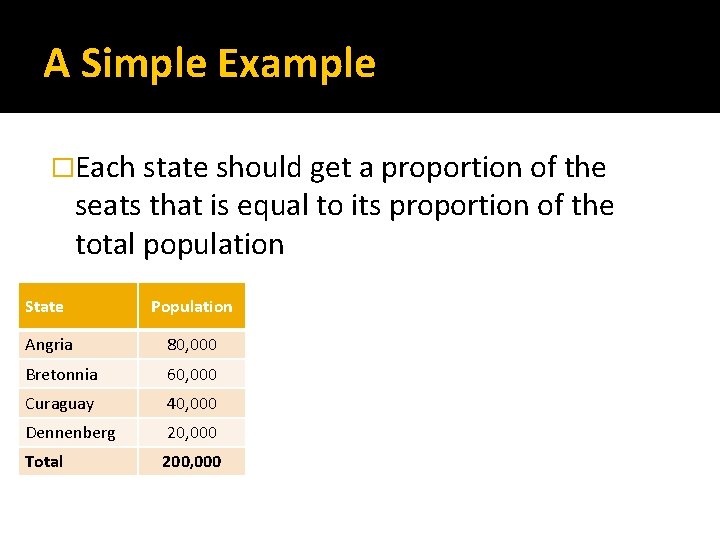
A Simple Example �Each state should get a proportion of the seats that is equal to its proportion of the total population State Population Angria 80, 000 Bretonnia 60, 000 Curaguay 40, 000 Dennenberg 20, 000 Total 200, 000

A Simple Example �Divide each state’s population by the total population to get the % population State Population % Pop. Angria 80, 000 40% Bretonnia 60, 000 30% Curaguay 40, 000 20% Dennenberg 20, 000 10% Total 200, 000 100%
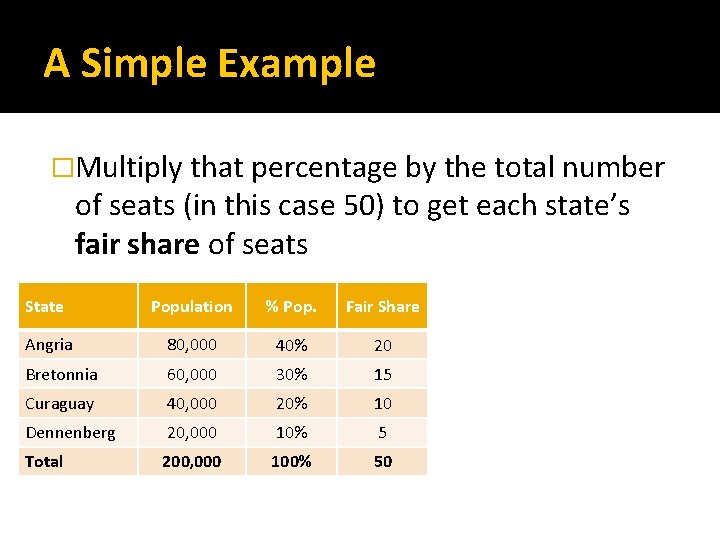
A Simple Example �Multiply that percentage by the total number of seats (in this case 50) to get each state’s fair share of seats State Population % Pop. Fair Share Angria 80, 000 40% 20 Bretonnia 60, 000 30% 15 Curaguay 40, 000 20% 10 Dennenberg 20, 000 10% 5 Total 200, 000 100% 50
That’s Too Simple! �Real world examples rarely work out as nicely as the previous example did �Let’s use more realistic population numbers and see what happens
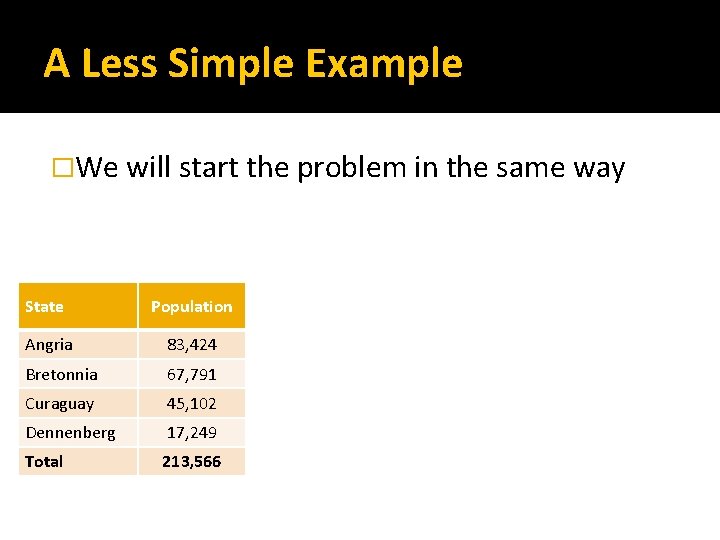
A Less Simple Example �We will start the problem in the same way State Population Angria 83, 424 Bretonnia 67, 791 Curaguay 45, 102 Dennenberg 17, 249 Total 213, 566
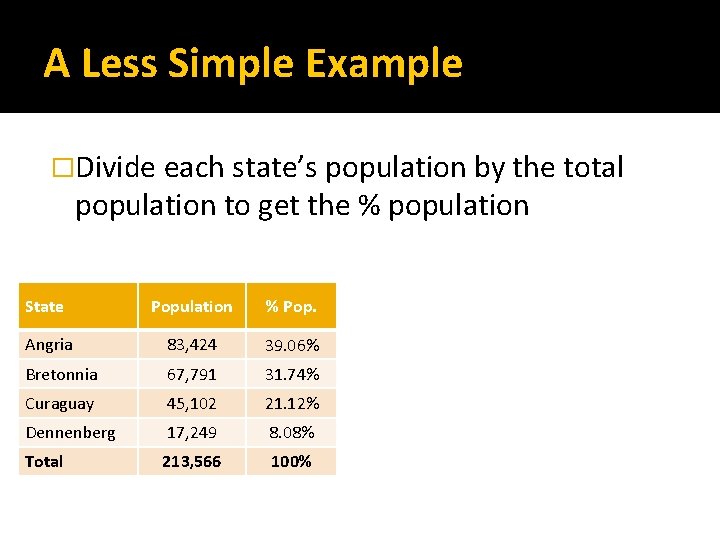
A Less Simple Example �Divide each state’s population by the total population to get the % population State Population % Pop. Angria 83, 424 39. 06% Bretonnia 67, 791 31. 74% Curaguay 45, 102 21. 12% Dennenberg 17, 249 8. 08% Total 213, 566 100%
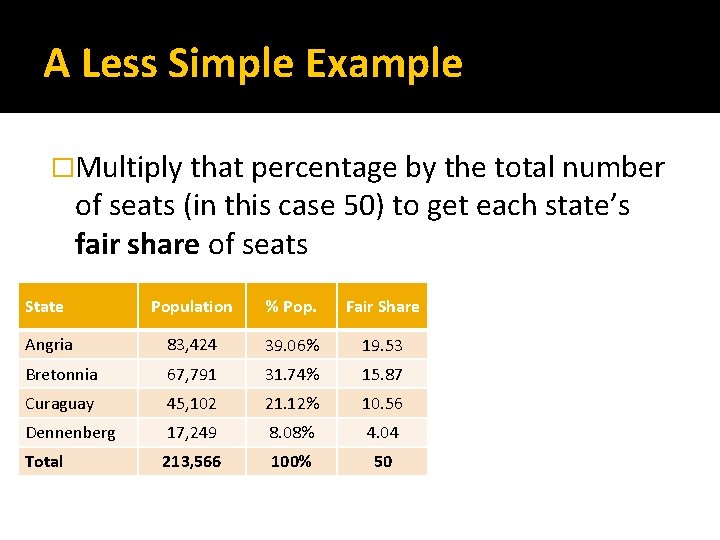
A Less Simple Example �Multiply that percentage by the total number of seats (in this case 50) to get each state’s fair share of seats State Population % Pop. Fair Share Angria 83, 424 39. 06% 19. 53 Bretonnia 67, 791 31. 74% 15. 87 Curaguay 45, 102 21. 12% 10. 56 Dennenberg 17, 249 8. 08% 4. 04 Total 213, 566 100% 50
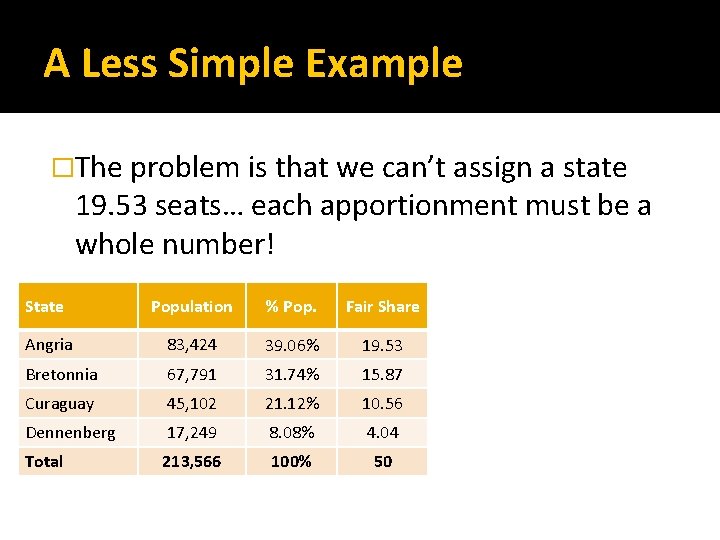
A Less Simple Example �The problem is that we can’t assign a state 19. 53 seats… each apportionment must be a whole number! State Population % Pop. Fair Share Angria 83, 424 39. 06% 19. 53 Bretonnia 67, 791 31. 74% 15. 87 Curaguay 45, 102 21. 12% 10. 56 Dennenberg 17, 249 8. 08% 4. 04 Total 213, 566 100% 50
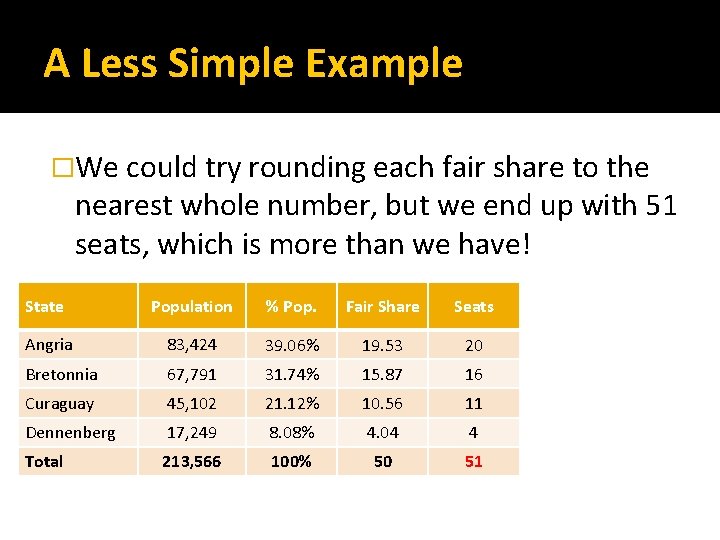
A Less Simple Example �We could try rounding each fair share to the nearest whole number, but we end up with 51 seats, which is more than we have! State Population % Pop. Fair Share Seats Angria 83, 424 39. 06% 19. 53 20 Bretonnia 67, 791 31. 74% 15. 87 16 Curaguay 45, 102 21. 12% 10. 56 11 Dennenberg 17, 249 8. 08% 4. 04 4 Total 213, 566 100% 50 51
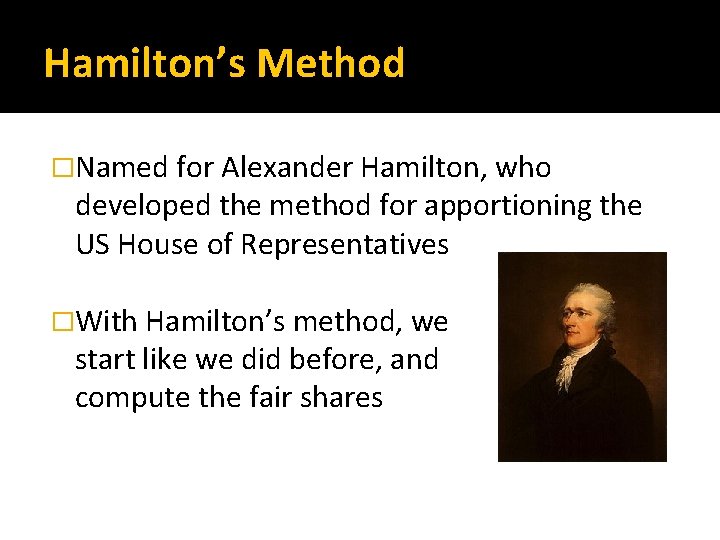
Hamilton’s Method �Named for Alexander Hamilton, who developed the method for apportioning the US House of Representatives �With Hamilton’s method, we start like we did before, and compute the fair shares
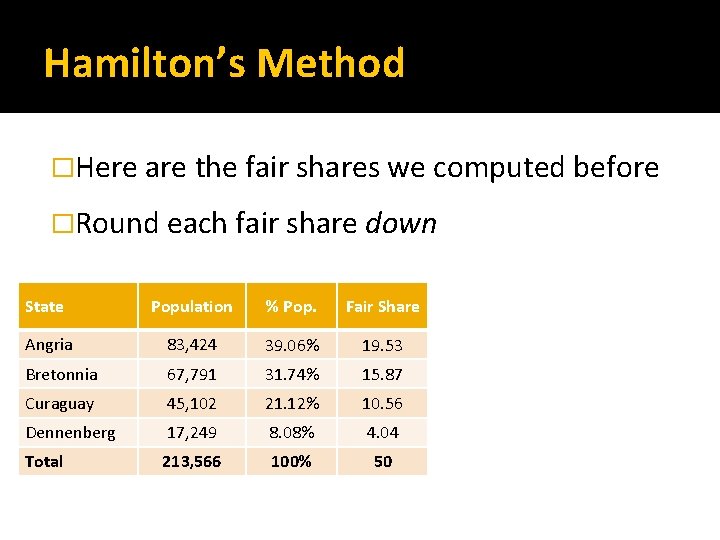
Hamilton’s Method �Here are the fair shares we computed before �Round each fair share down State Population % Pop. Fair Share Angria 83, 424 39. 06% 19. 53 Bretonnia 67, 791 31. 74% 15. 87 Curaguay 45, 102 21. 12% 10. 56 Dennenberg 17, 249 8. 08% 4. 04 Total 213, 566 100% 50
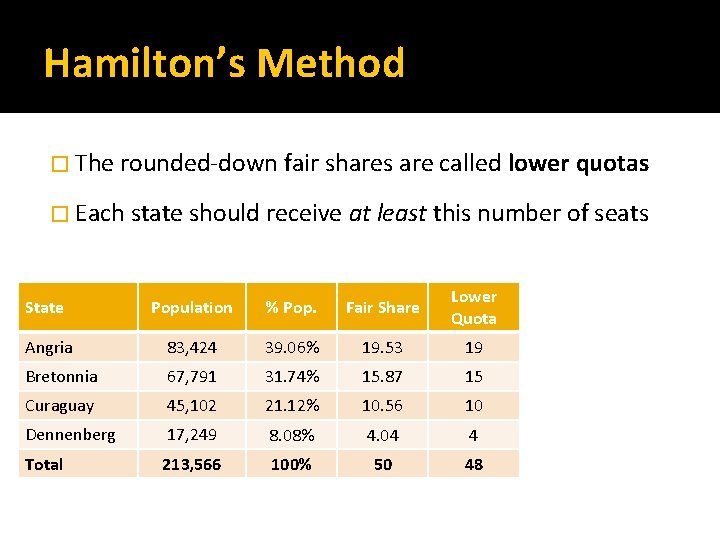
Hamilton’s Method � The rounded-down fair shares are called lower quotas � Each state should receive at least this number of seats State Population % Pop. Fair Share Lower Quota Angria 83, 424 39. 06% 19. 53 19 Bretonnia 67, 791 31. 74% 15. 87 15 Curaguay 45, 102 21. 12% 10. 56 10 Dennenberg 17, 249 8. 08% 4. 04 4 Total 213, 566 100% 50 48
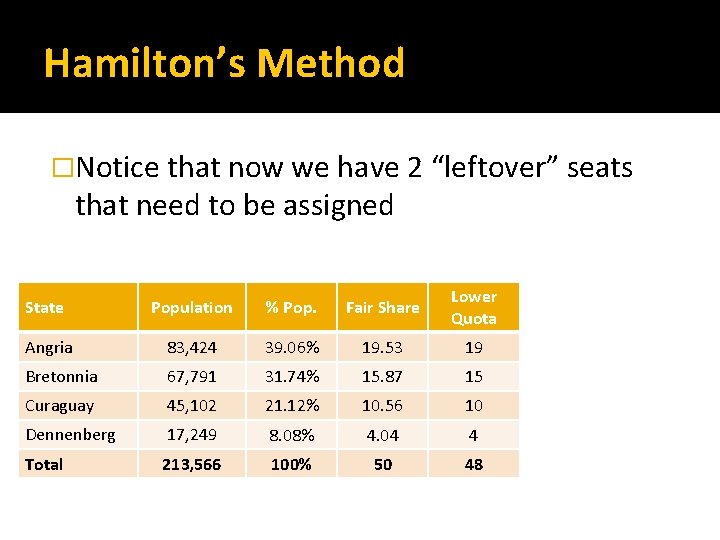
Hamilton’s Method �Notice that now we have 2 “leftover” seats that need to be assigned State Population % Pop. Fair Share Lower Quota Angria 83, 424 39. 06% 19. 53 19 Bretonnia 67, 791 31. 74% 15. 87 15 Curaguay 45, 102 21. 12% 10. 56 10 Dennenberg 17, 249 8. 08% 4. 04 4 Total 213, 566 100% 50 48
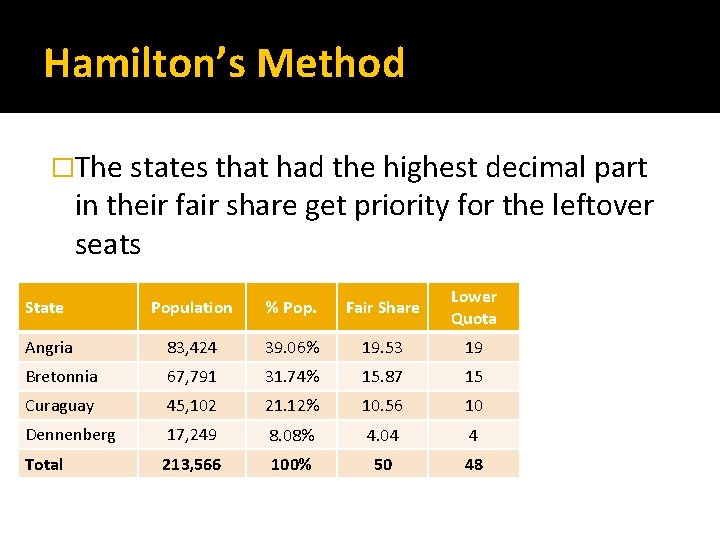
Hamilton’s Method �The states that had the highest decimal part in their fair share get priority for the leftover seats State Population % Pop. Fair Share Lower Quota Angria 83, 424 39. 06% 19. 53 19 Bretonnia 67, 791 31. 74% 15. 87 15 Curaguay 45, 102 21. 12% 10. 56 10 Dennenberg 17, 249 8. 08% 4. 04 4 Total 213, 566 100% 50 48
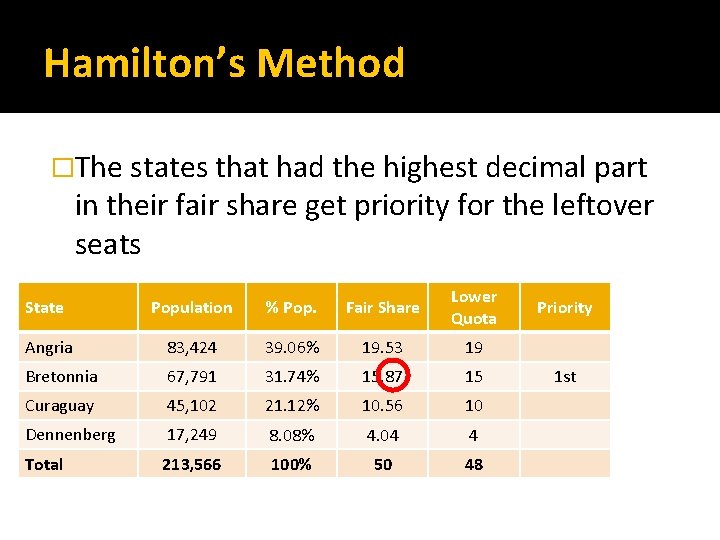
Hamilton’s Method �The states that had the highest decimal part in their fair share get priority for the leftover seats State Population % Pop. Fair Share Lower Quota Angria 83, 424 39. 06% 19. 53 19 Bretonnia 67, 791 31. 74% 15. 87 15 Curaguay 45, 102 21. 12% 10. 56 10 Dennenberg 17, 249 8. 08% 4. 04 4 Total 213, 566 100% 50 48 Priority 1 st
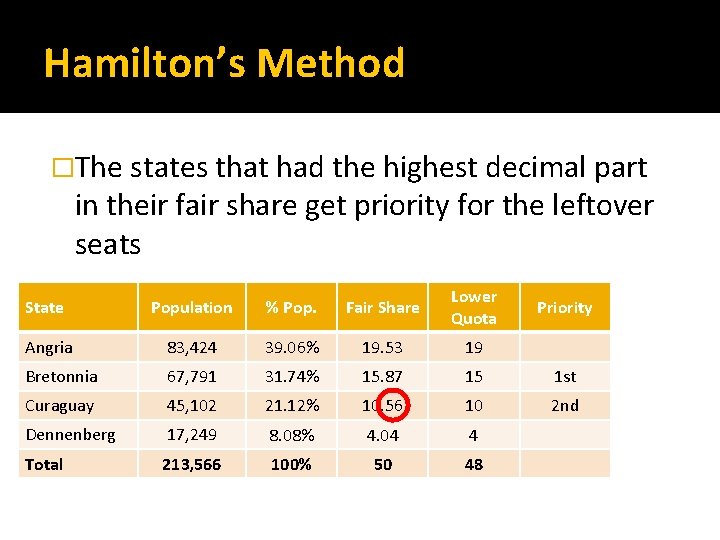
Hamilton’s Method �The states that had the highest decimal part in their fair share get priority for the leftover seats State Population % Pop. Fair Share Lower Quota Angria 83, 424 39. 06% 19. 53 19 Bretonnia 67, 791 31. 74% 15. 87 15 1 st Curaguay 45, 102 21. 12% 10. 56 10 2 nd Dennenberg 17, 249 8. 08% 4. 04 4 Total 213, 566 100% 50 48 Priority
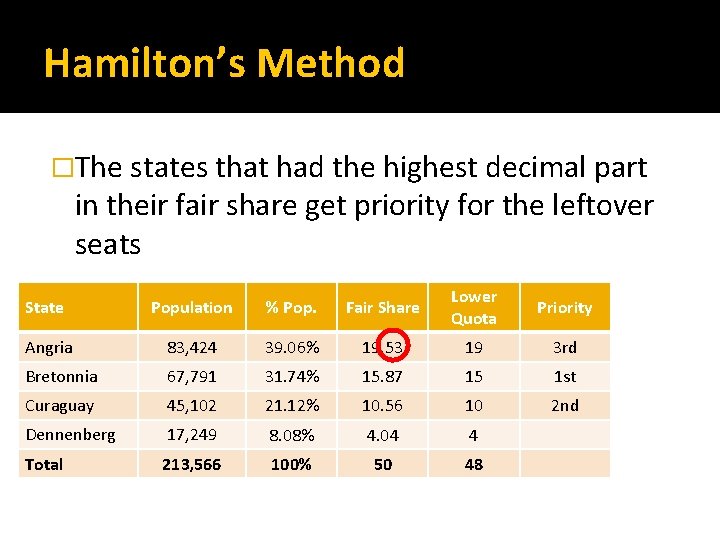
Hamilton’s Method �The states that had the highest decimal part in their fair share get priority for the leftover seats State Population % Pop. Fair Share Lower Quota Priority Angria 83, 424 39. 06% 19. 53 19 3 rd Bretonnia 67, 791 31. 74% 15. 87 15 1 st Curaguay 45, 102 21. 12% 10. 56 10 2 nd Dennenberg 17, 249 8. 08% 4. 04 4 Total 213, 566 100% 50 48
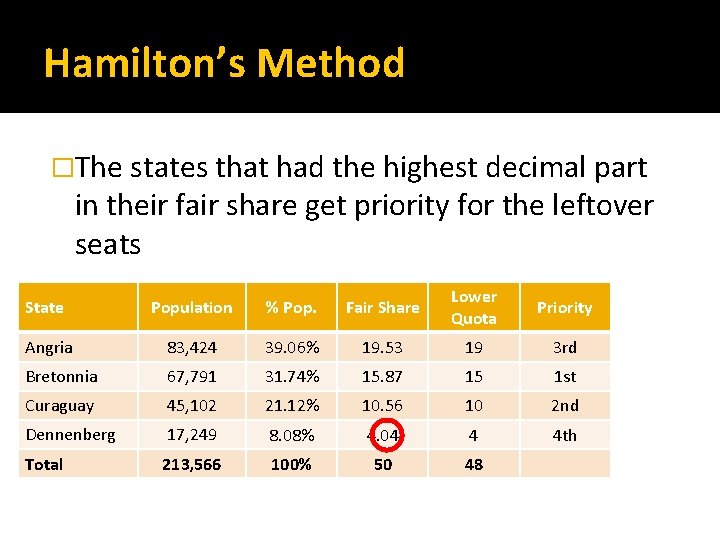
Hamilton’s Method �The states that had the highest decimal part in their fair share get priority for the leftover seats State Population % Pop. Fair Share Lower Quota Priority Angria 83, 424 39. 06% 19. 53 19 3 rd Bretonnia 67, 791 31. 74% 15. 87 15 1 st Curaguay 45, 102 21. 12% 10. 56 10 2 nd Dennenberg 17, 249 8. 08% 4. 04 4 4 th Total 213, 566 100% 50 48
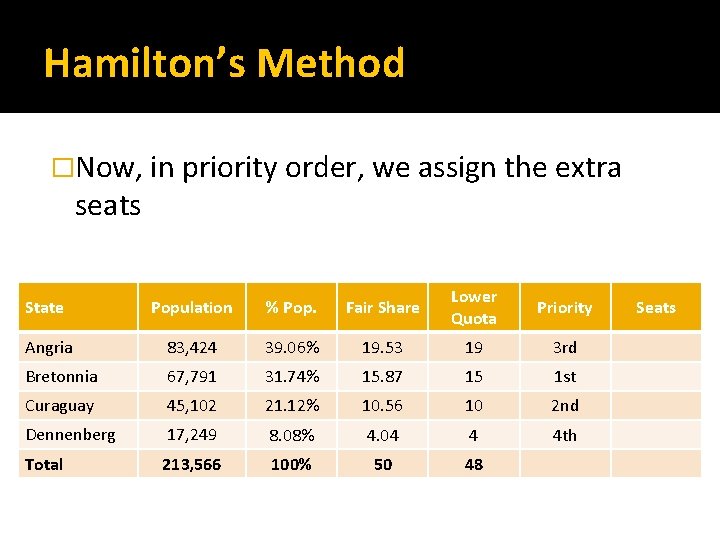
Hamilton’s Method �Now, in priority order, we assign the extra seats State Population % Pop. Fair Share Lower Quota Priority Angria 83, 424 39. 06% 19. 53 19 3 rd Bretonnia 67, 791 31. 74% 15. 87 15 1 st Curaguay 45, 102 21. 12% 10. 56 10 2 nd Dennenberg 17, 249 8. 08% 4. 04 4 4 th Total 213, 566 100% 50 48 Seats
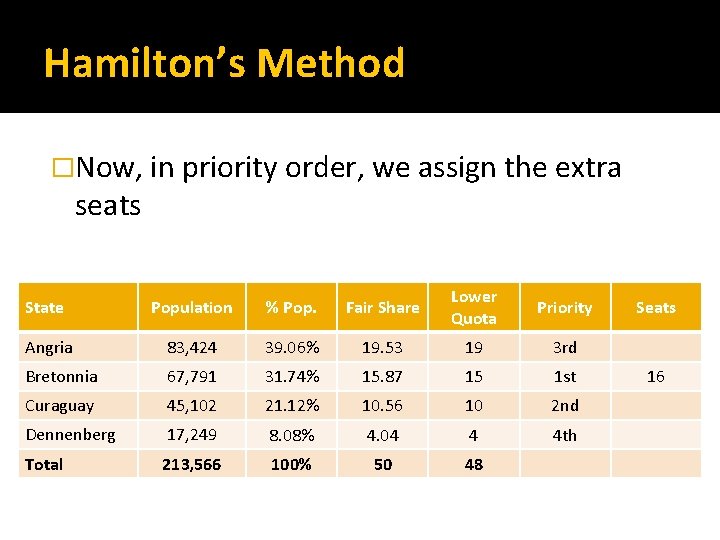
Hamilton’s Method �Now, in priority order, we assign the extra seats State Population % Pop. Fair Share Lower Quota Priority Angria 83, 424 39. 06% 19. 53 19 3 rd Bretonnia 67, 791 31. 74% 15. 87 15 1 st Curaguay 45, 102 21. 12% 10. 56 10 2 nd Dennenberg 17, 249 8. 08% 4. 04 4 4 th Total 213, 566 100% 50 48 Seats 16
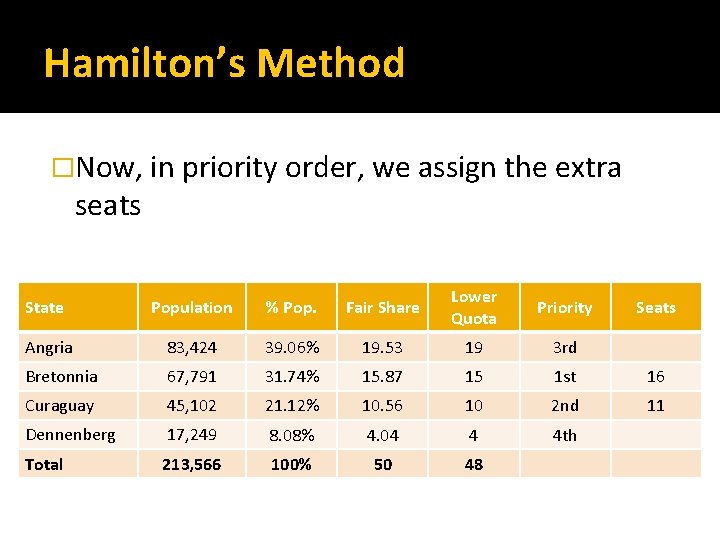
Hamilton’s Method �Now, in priority order, we assign the extra seats State Population % Pop. Fair Share Lower Quota Priority Angria 83, 424 39. 06% 19. 53 19 3 rd Bretonnia 67, 791 31. 74% 15. 87 15 1 st 16 Curaguay 45, 102 21. 12% 10. 56 10 2 nd 11 Dennenberg 17, 249 8. 08% 4. 04 4 4 th Total 213, 566 100% 50 48 Seats
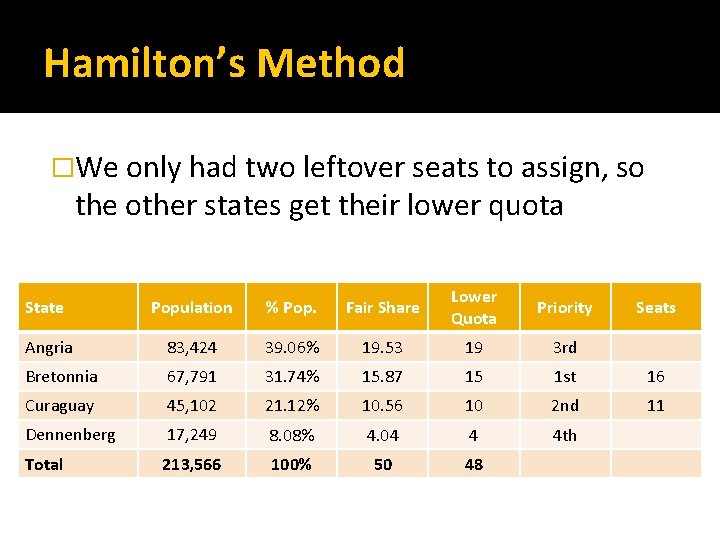
Hamilton’s Method �We only had two leftover seats to assign, so the other states get their lower quota State Population % Pop. Fair Share Lower Quota Priority Angria 83, 424 39. 06% 19. 53 19 3 rd Bretonnia 67, 791 31. 74% 15. 87 15 1 st 16 Curaguay 45, 102 21. 12% 10. 56 10 2 nd 11 Dennenberg 17, 249 8. 08% 4. 04 4 4 th Total 213, 566 100% 50 48 Seats
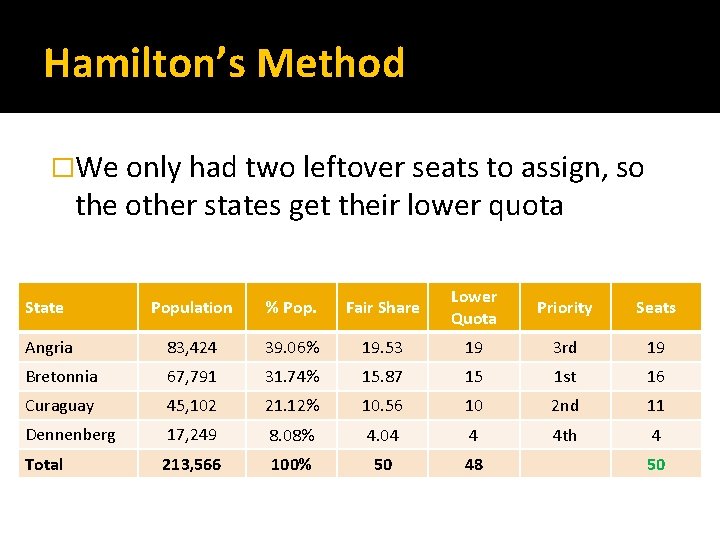
Hamilton’s Method �We only had two leftover seats to assign, so the other states get their lower quota State Population % Pop. Fair Share Lower Quota Priority Seats Angria 83, 424 39. 06% 19. 53 19 3 rd 19 Bretonnia 67, 791 31. 74% 15. 87 15 1 st 16 Curaguay 45, 102 21. 12% 10. 56 10 2 nd 11 Dennenberg 17, 249 8. 08% 4. 04 4 4 th 4 Total 213, 566 100% 50 48 50
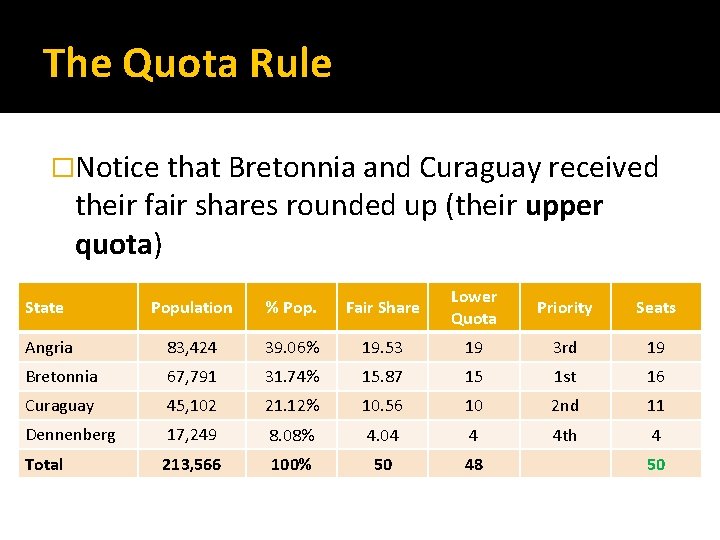
The Quota Rule �Notice that Bretonnia and Curaguay received their fair shares rounded up (their upper quota) State Population % Pop. Fair Share Lower Quota Priority Seats Angria 83, 424 39. 06% 19. 53 19 3 rd 19 Bretonnia 67, 791 31. 74% 15. 87 15 1 st 16 Curaguay 45, 102 21. 12% 10. 56 10 2 nd 11 Dennenberg 17, 249 8. 08% 4. 04 4 4 th 4 Total 213, 566 100% 50 48 50
The Quota Rule �With Hamilton’s method, each state will always receive either their lower quota or their upper quota: this is the quota rule �If a state is apportioned a number of states that is either above its upper quota or below its lower quota, then that is a quota rule violation
You Try It �Use Hamilton’s Method to assign 60 seats to the following states �State A has population 4, 105 �State B has population 5, 376 �State C has population 2, 629
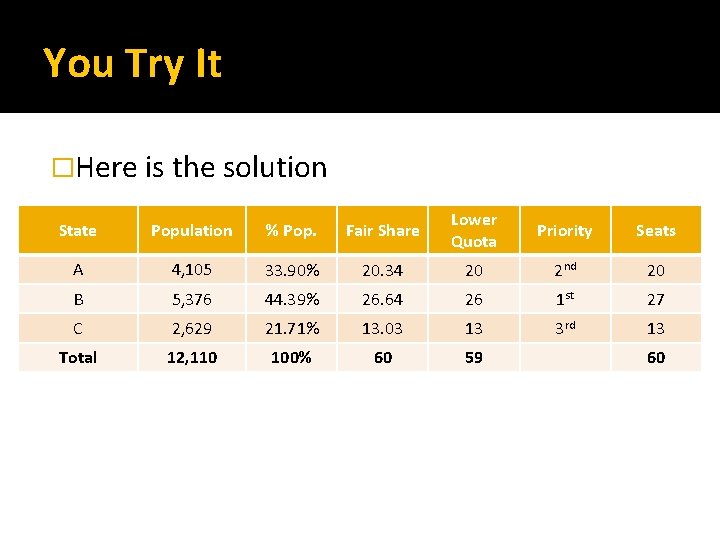
You Try It �Here is the solution State Population % Pop. Fair Share Lower Quota Priority Seats A 4, 105 33. 90% 20. 34 20 2 nd 20 B 5, 376 44. 39% 26. 64 26 1 st 27 C 2, 629 21. 71% 13. 03 13 3 rd 13 Total 12, 110 100% 60 59 60
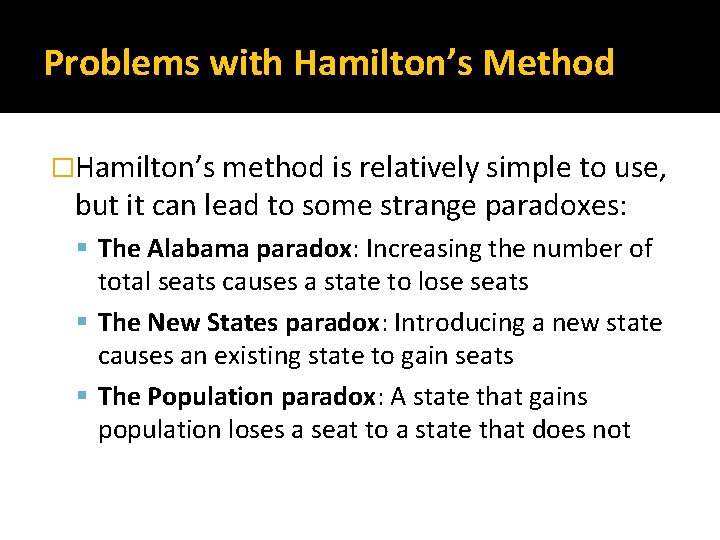
Problems with Hamilton’s Method �Hamilton’s method is relatively simple to use, but it can lead to some strange paradoxes: The Alabama paradox: Increasing the number of total seats causes a state to lose seats The New States paradox: Introducing a new state causes an existing state to gain seats The Population paradox: A state that gains population loses a seat to a state that does not
The Alabama Paradox �When the population of each state stays the same but the number of seats is increased, intuitively each state’s apportionment should stay the same or go up �That doesn’t always happen
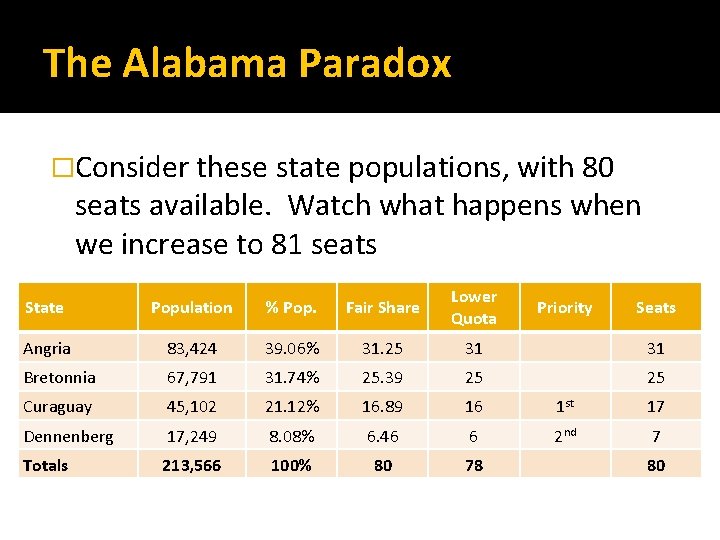
The Alabama Paradox �Consider these state populations, with 80 seats available. Watch what happens when we increase to 81 seats State Population % Pop. Fair Share Lower Quota Angria 83, 424 39. 06% 31. 25 31 31 Bretonnia 67, 791 31. 74% 25. 39 25 25 Curaguay 45, 102 21. 12% 16. 89 16 1 st 17 Dennenberg 17, 249 8. 08% 6. 46 6 2 nd 7 Totals 213, 566 100% 80 78 Priority Seats 80
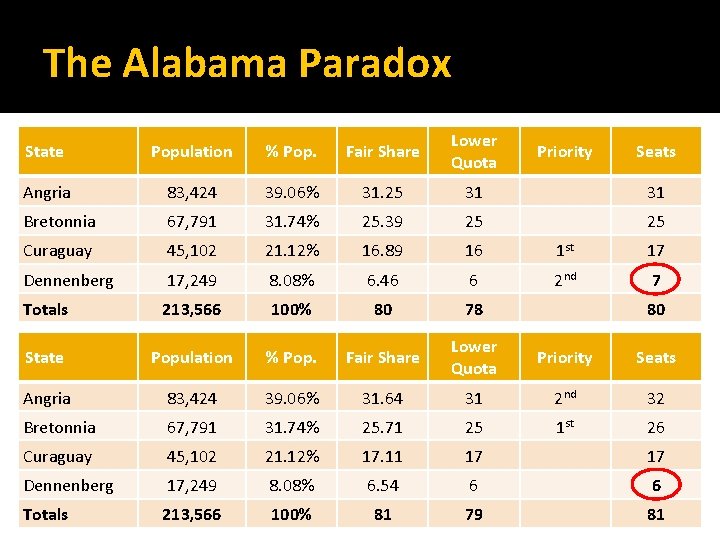
The Alabama Paradox State Population % Pop. Fair Share Lower Quota Angria 83, 424 39. 06% 31. 25 31 31 Bretonnia 67, 791 31. 74% 25. 39 25 25 Curaguay 45, 102 21. 12% 16. 89 16 1 st 17 Dennenberg 17, 249 8. 08% 6. 46 6 2 nd 7 Totals 213, 566 100% 80 78 State Population % Pop. Fair Share Lower Quota Priority Seats Angria 83, 424 39. 06% 31. 64 31 2 nd 32 Bretonnia 67, 791 31. 74% 25. 71 25 1 st 26 Curaguay 45, 102 21. 12% 17. 11 17 17 Dennenberg 17, 249 8. 08% 6. 54 6 6 Totals 213, 566 100% 81 79 81 Priority Seats 80
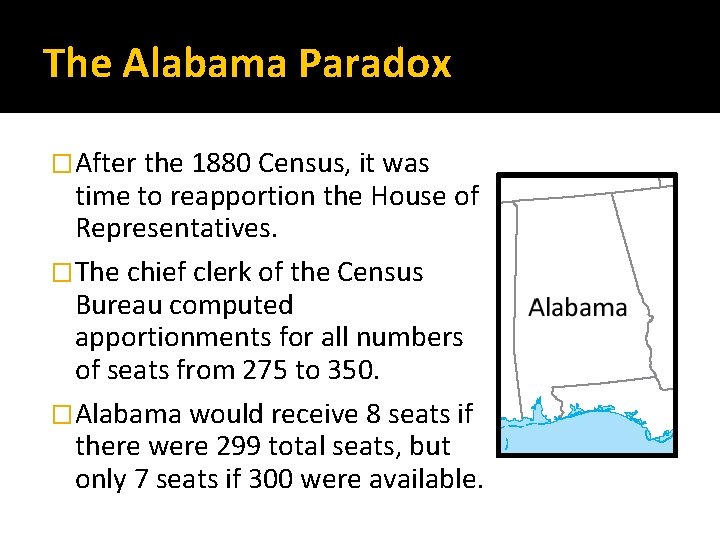
The Alabama Paradox �After the 1880 Census, it was time to reapportion the House of Representatives. �The chief clerk of the Census Bureau computed apportionments for all numbers of seats from 275 to 350. �Alabama would receive 8 seats if there were 299 total seats, but only 7 seats if 300 were available.
The New States Paradox �If a new state is added to our country, but the total number of seats remains the same, then we would expect that the apportionment for the existing states should stay the same or go down �This doesn’t always happen
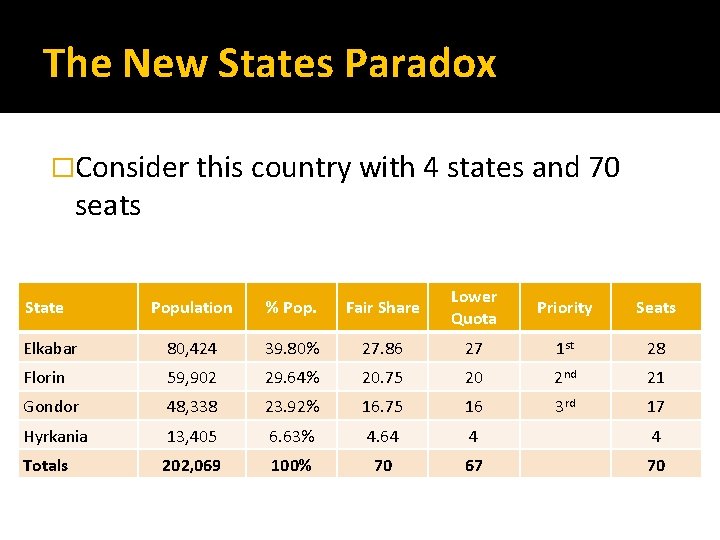
The New States Paradox �Consider this country with 4 states and 70 seats Population % Pop. Fair Share Lower Quota Priority Seats Elkabar 80, 424 39. 80% 27. 86 27 1 st 28 Florin 59, 902 29. 64% 20. 75 20 2 nd 21 Gondor 48, 338 23. 92% 16. 75 16 3 rd 17 Hyrkania 13, 405 6. 63% 4. 64 4 4 Totals 202, 069 100% 70 67 70 State
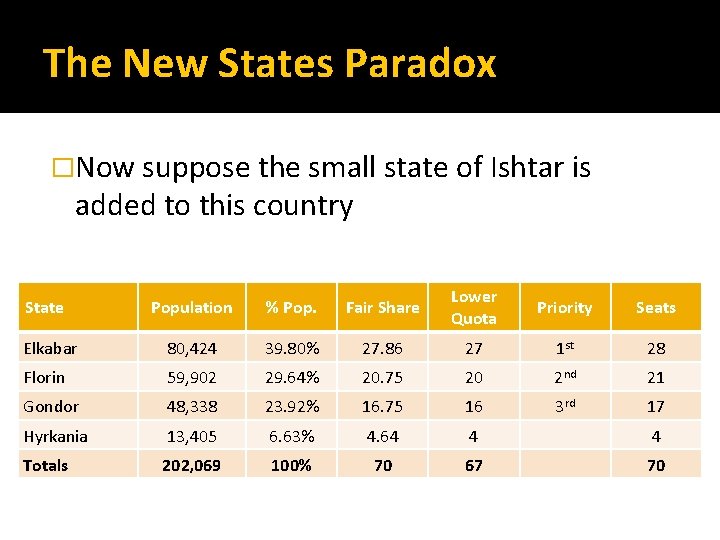
The New States Paradox �Now suppose the small state of Ishtar is added to this country Population % Pop. Fair Share Lower Quota Priority Seats Elkabar 80, 424 39. 80% 27. 86 27 1 st 28 Florin 59, 902 29. 64% 20. 75 20 2 nd 21 Gondor 48, 338 23. 92% 16. 75 16 3 rd 17 Hyrkania 13, 405 6. 63% 4. 64 4 4 Totals 202, 069 100% 70 67 70 State
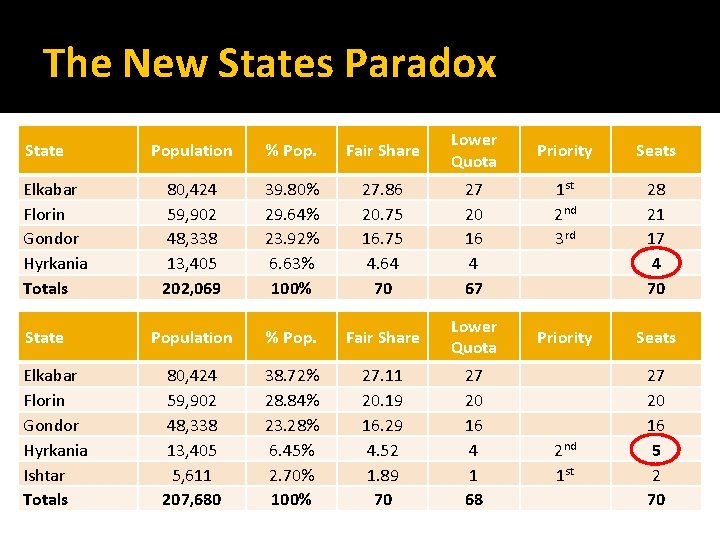
The New States Paradox State Elkabar Florin Gondor Hyrkania Totals State Elkabar Florin Gondor Hyrkania Ishtar Totals Population % Pop. Fair Share Lower Quota 80, 424 59, 902 48, 338 13, 405 202, 069 39. 80% 29. 64% 23. 92% 6. 63% 100% 27. 86 20. 75 16. 75 4. 64 70 27 20 16 4 67 Population % Pop. Fair Share Lower Quota 80, 424 59, 902 48, 338 13, 405 5, 611 207, 680 38. 72% 28. 84% 23. 28% 6. 45% 2. 70% 100% 27. 11 20. 19 16. 29 4. 52 1. 89 70 27 20 16 4 1 68 Priority Seats 1 st 2 nd 3 rd 28 21 17 4 70 Priority Seats 2 nd 1 st 27 20 16 5 2 70
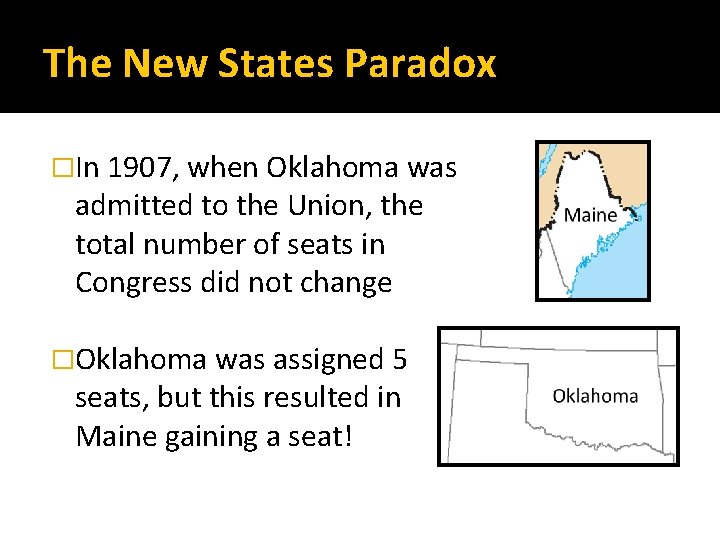
The New States Paradox �In 1907, when Oklahoma was admitted to the Union, the total number of seats in Congress did not change �Oklahoma was assigned 5 seats, but this resulted in Maine gaining a seat!
The Population Paradox �As time goes on, populations of states change �States that increase population rapidly should gain seats over those that do not �However, this doesn’t always happen
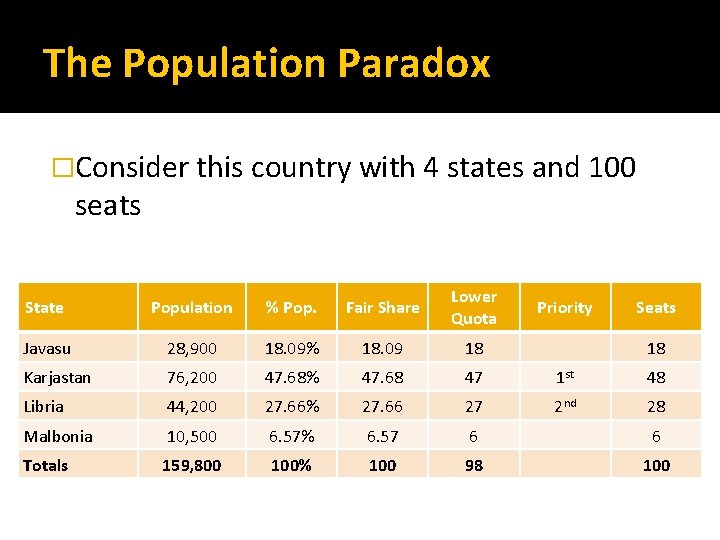
The Population Paradox �Consider this country with 4 states and 100 seats State Population % Pop. Fair Share Lower Quota Javasu 28, 900 18. 09% 18. 09 18 Karjastan 76, 200 47. 68% 47. 68 47 1 st 48 Libria 44, 200 27. 66% 27. 66 27 2 nd 28 Malbonia 10, 500 6. 57% 6. 57 6 6 Totals 159, 800 100% 100 98 100 Priority Seats 18
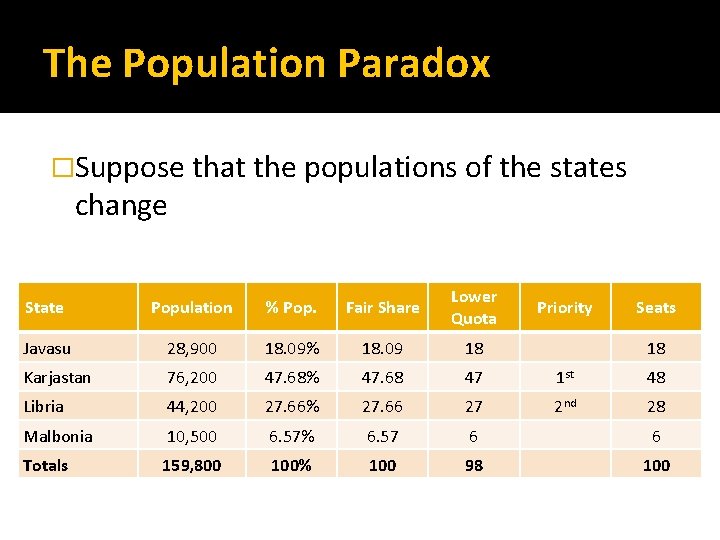
The Population Paradox �Suppose that the populations of the states change State Population % Pop. Fair Share Lower Quota Javasu 28, 900 18. 09% 18. 09 18 Karjastan 76, 200 47. 68% 47. 68 47 1 st 48 Libria 44, 200 27. 66% 27. 66 27 2 nd 28 Malbonia 10, 500 6. 57% 6. 57 6 6 Totals 159, 800 100% 100 98 100 Priority Seats 18
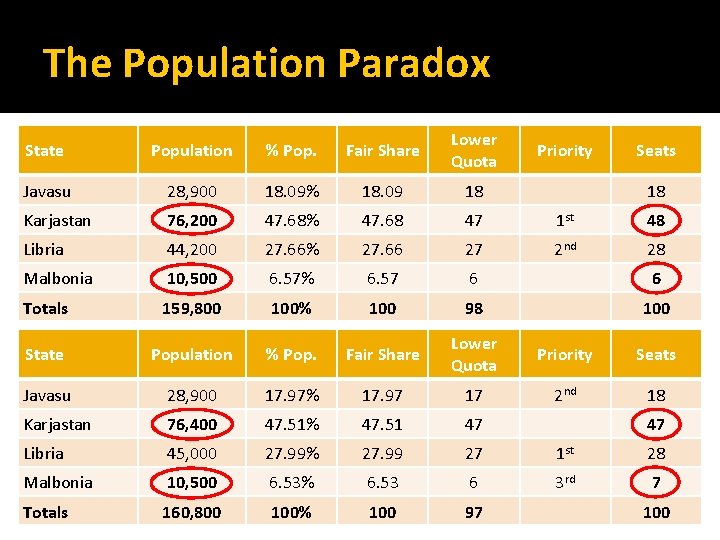
The Population Paradox State Population % Pop. Fair Share Lower Quota Javasu 28, 900 18. 09% 18. 09 18 Karjastan 76, 200 47. 68% 47. 68 47 1 st 48 Libria 44, 200 27. 66% 27. 66 27 2 nd 28 Malbonia 10, 500 6. 57% 6. 57 6 6 Totals 159, 800 100% 100 98 100 State Population % Pop. Fair Share Lower Quota Priority Seats Javasu 28, 900 17. 97% 17. 97 17 2 nd 18 Karjastan 76, 400 47. 51% 47. 51 47 Libria 45, 000 27. 99% 27. 99 27 1 st 28 Malbonia 10, 500 6. 53% 6. 53 6 3 rd 7 Totals 160, 800 100% 100 97 Priority Seats 18 47 100
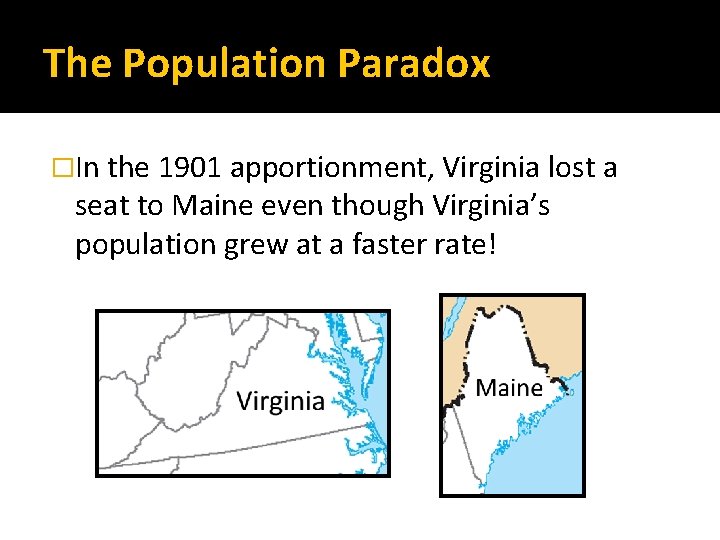
The Population Paradox �In the 1901 apportionment, Virginia lost a seat to Maine even though Virginia’s population grew at a faster rate!
Alternative Apportionment Methods �Several alternatives to Hamilton’s method have been developed that avoid these paradoxes �The first was developed by Thomas Jefferson, and was the method used to apportion the Congress from 1792 to 1832
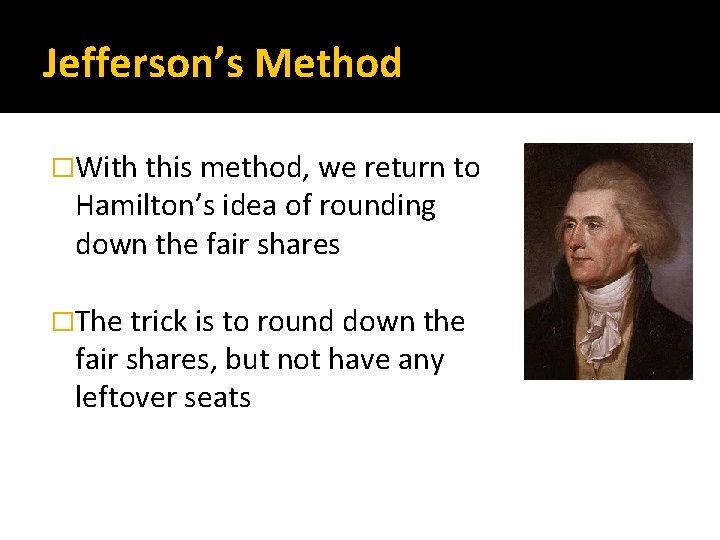
Jefferson’s Method �With this method, we return to Hamilton’s idea of rounding down the fair shares �The trick is to round down the fair shares, but not have any leftover seats
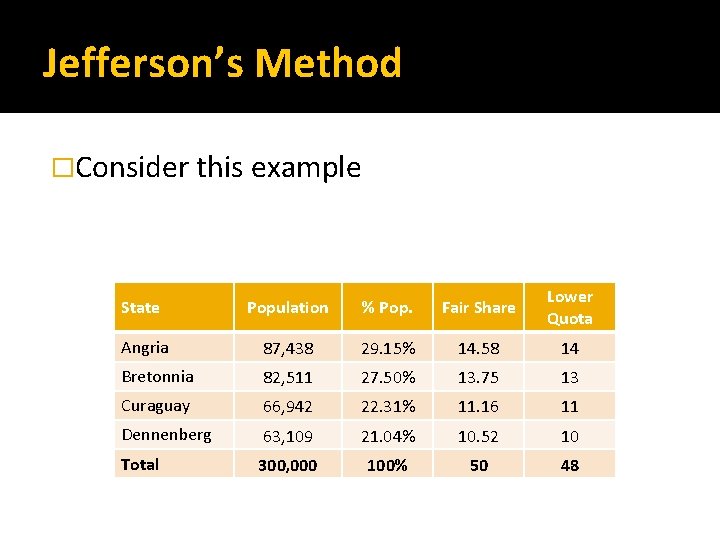
Jefferson’s Method �Consider this example State Population % Pop. Fair Share Lower Quota Angria 87, 438 29. 15% 14. 58 14 Bretonnia 82, 511 27. 50% 13. 75 13 Curaguay 66, 942 22. 31% 11. 16 11 Dennenberg 63, 109 21. 04% 10. 52 10 Total 300, 000 100% 50 48
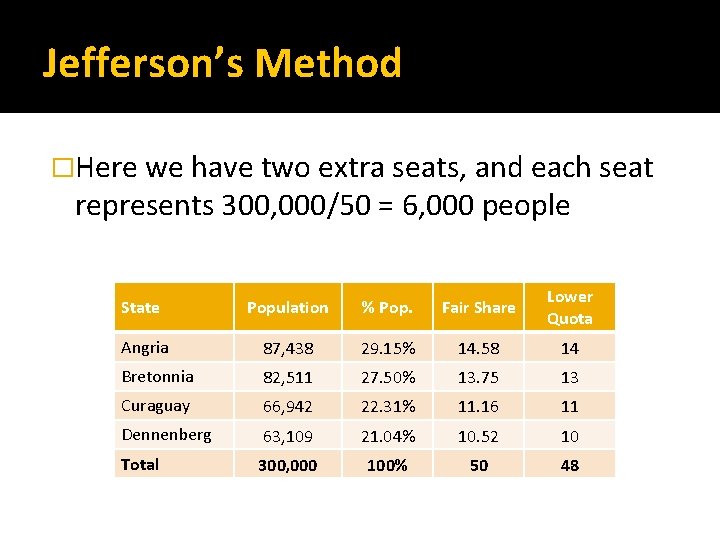
Jefferson’s Method �Here we have two extra seats, and each seat represents 300, 000/50 = 6, 000 people State Population % Pop. Fair Share Lower Quota Angria 87, 438 29. 15% 14. 58 14 Bretonnia 82, 511 27. 50% 13. 75 13 Curaguay 66, 942 22. 31% 11. 16 11 Dennenberg 63, 109 21. 04% 10. 52 10 Total 300, 000 100% 50 48
Jefferson’s Method �When we divide the total population by the number of seats, we get the standard divisor �Instead of figuring out the % population, we could just divide the population of each state by the standard divisor
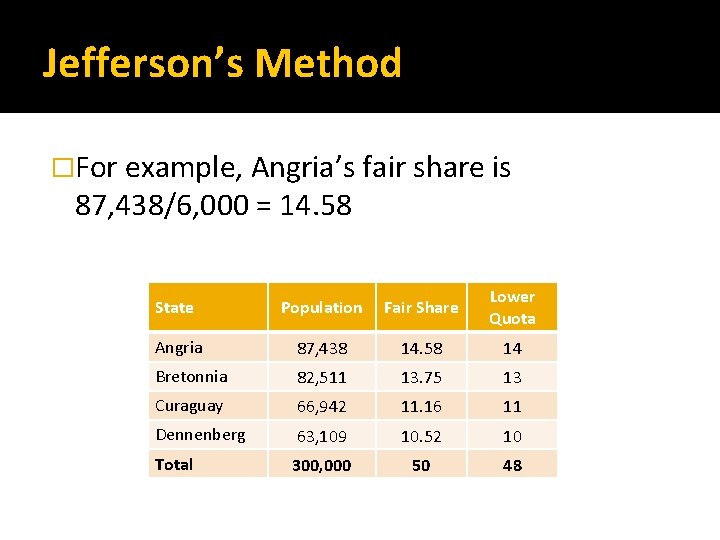
Jefferson’s Method �For example, Angria’s fair share is 87, 438/6, 000 = 14. 58 State Population Fair Share Lower Quota Angria 87, 438 14. 58 14 Bretonnia 82, 511 13. 75 13 Curaguay 66, 942 11. 16 11 Dennenberg 63, 109 10. 52 10 Total 300, 000 50 48
Jefferson’s Method �Jefferson’s idea was to modify the standard divisor so that when the shares for each state are rounded down, there are no leftover seats �Right now we are only assigning 48 seats �Making the divisor smaller will increase each state’s share
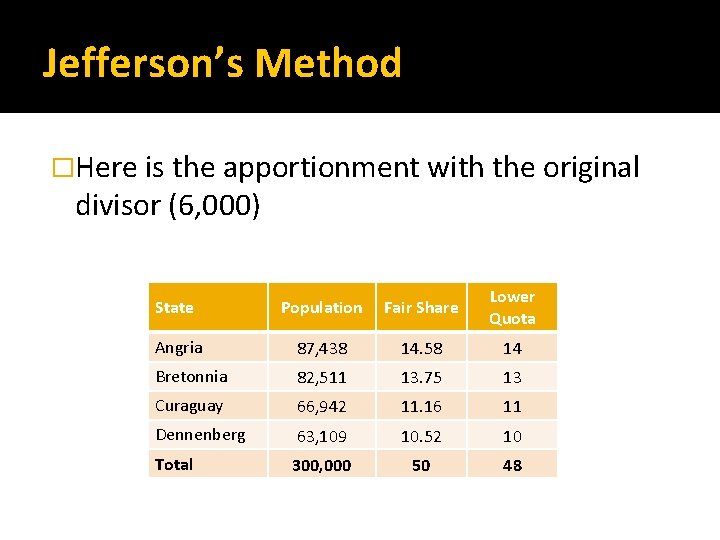
Jefferson’s Method �Here is the apportionment with the original divisor (6, 000) State Population Fair Share Lower Quota Angria 87, 438 14. 58 14 Bretonnia 82, 511 13. 75 13 Curaguay 66, 942 11. 16 11 Dennenberg 63, 109 10. 52 10 Total 300, 000 50 48
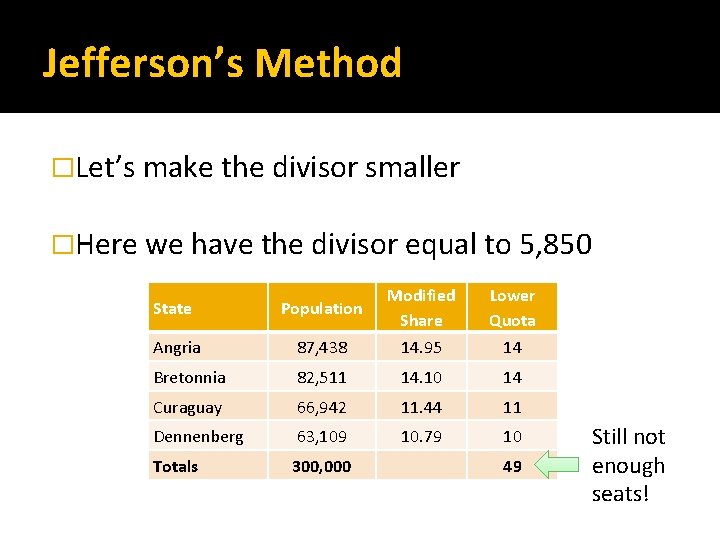
Jefferson’s Method �Let’s make the divisor smaller �Here we have the divisor equal to 5, 850 State Population Modified Share Lower Quota Angria 87, 438 14. 95 14 Bretonnia 82, 511 14. 10 14 Curaguay 66, 942 11. 44 11 Dennenberg 63, 109 10. 79 10 Totals 300, 000 49 Still not enough seats!
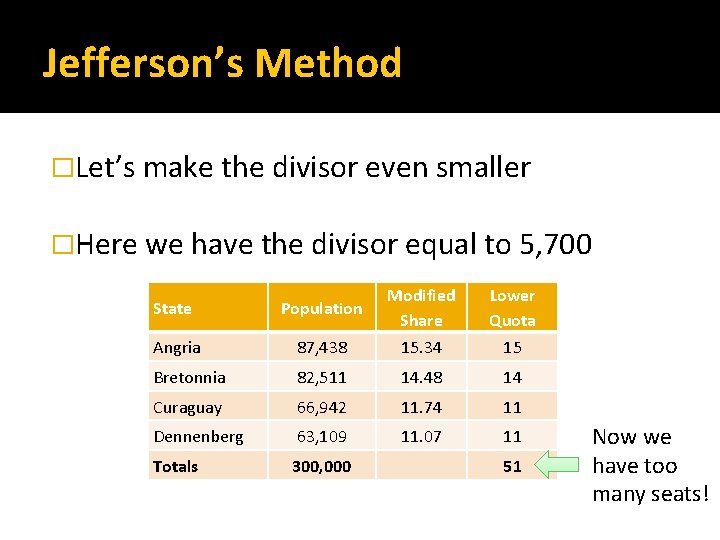
Jefferson’s Method �Let’s make the divisor even smaller �Here we have the divisor equal to 5, 700 State Population Modified Share Lower Quota Angria 87, 438 15. 34 15 Bretonnia 82, 511 14. 48 14 Curaguay 66, 942 11. 74 11 Dennenberg 63, 109 11. 07 11 Totals 300, 000 51 Now we have too many seats!
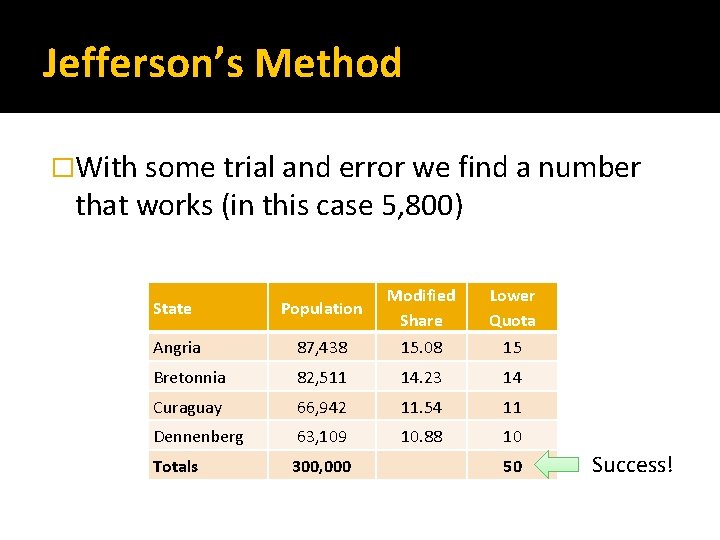
Jefferson’s Method �With some trial and error we find a number that works (in this case 5, 800) State Population Modified Share Lower Quota Angria 87, 438 15. 08 15 Bretonnia 82, 511 14. 23 14 Curaguay 66, 942 11. 54 11 Dennenberg 63, 109 10. 88 10 Totals 300, 000 50 Success!
Problems with Jefferson’s Method �Jefferson’s method has the advantage that it doesn’t suffer from any of the paradoxes that Hamilton’s method did �However, there is still a problem with Jefferson’s method �Let’s consider another example with 4 states and 50 seats
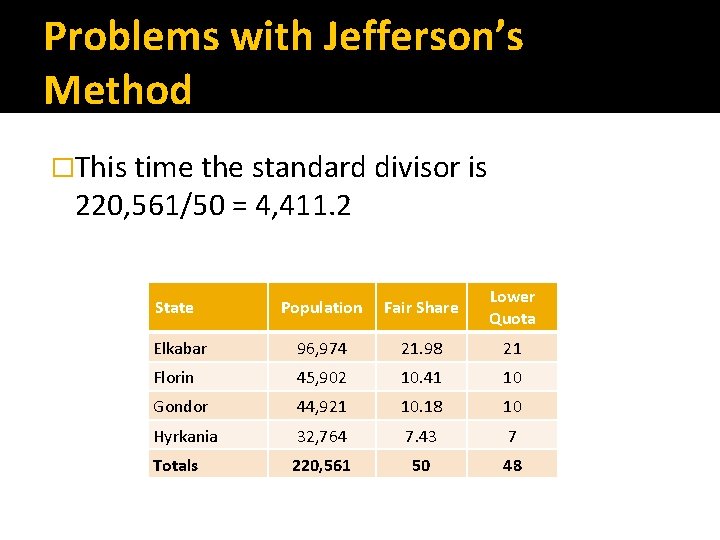
Problems with Jefferson’s Method �This time the standard divisor is 220, 561/50 = 4, 411. 2 Population Fair Share Lower Quota Elkabar 96, 974 21. 98 21 Florin 45, 902 10. 41 10 Gondor 44, 921 10. 18 10 Hyrkania 32, 764 7. 43 7 Totals 220, 561 50 48 State
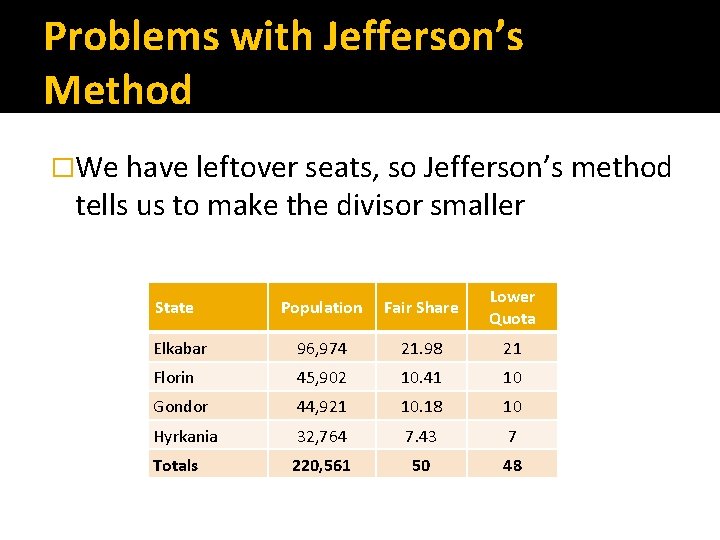
Problems with Jefferson’s Method �We have leftover seats, so Jefferson’s method tells us to make the divisor smaller Population Fair Share Lower Quota Elkabar 96, 974 21. 98 21 Florin 45, 902 10. 41 10 Gondor 44, 921 10. 18 10 Hyrkania 32, 764 7. 43 7 Totals 220, 561 50 48 State
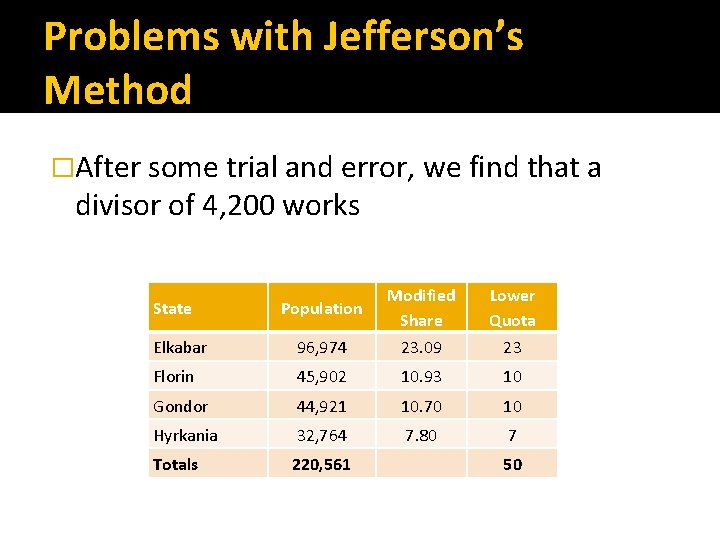
Problems with Jefferson’s Method �After some trial and error, we find that a divisor of 4, 200 works Population Modified Share Lower Quota Elkabar 96, 974 23. 09 23 Florin 45, 902 10. 93 10 Gondor 44, 921 10. 70 10 Hyrkania 32, 764 7. 80 7 Totals 220, 561 State 50
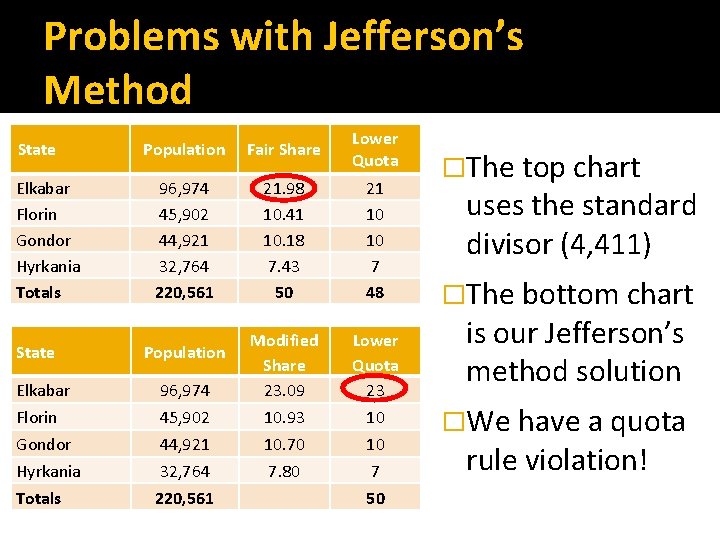
Problems with Jefferson’s Method State Elkabar Florin Gondor Hyrkania Totals Population Fair Share Lower Quota 96, 974 45, 902 44, 921 32, 764 220, 561 21. 98 10. 41 10. 18 7. 43 50 21 10 10 7 48 Modified Share 23. 09 10. 93 10. 70 7. 80 Lower Quota 23 10 10 7 50 Population 96, 974 45, 902 44, 921 32, 764 220, 561 �The top chart uses the standard divisor (4, 411) �The bottom chart is our Jefferson’s method solution �We have a quota rule violation!
Alternatives to the Alternative �As we saw, Jefferson’s method can violate the quota rule �This tends to favor larger states over smaller ones
Alternatives to the Alternative �Variations of Jefferson’s method were proposed Adams’ method (developed by the 6 th US President John Quincy Adams) Webster’s method (developed by famed orator and lawyer Daniel Webster)
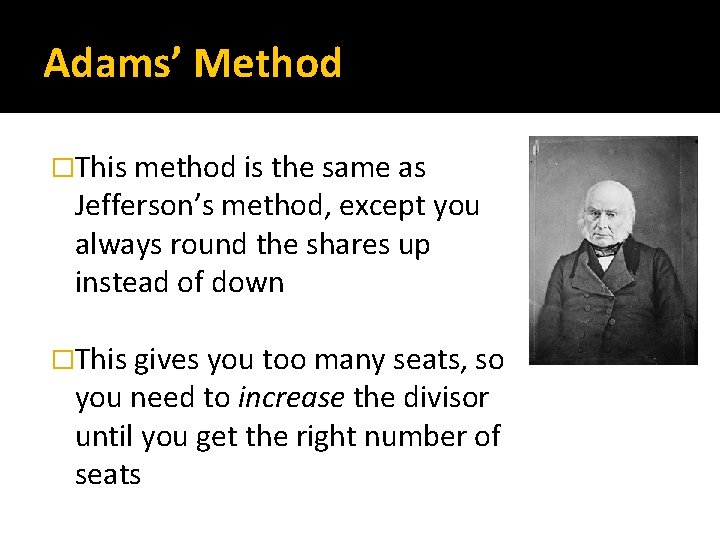
Adams’ Method �This method is the same as Jefferson’s method, except you always round the shares up instead of down �This gives you too many seats, so you need to increase the divisor until you get the right number of seats
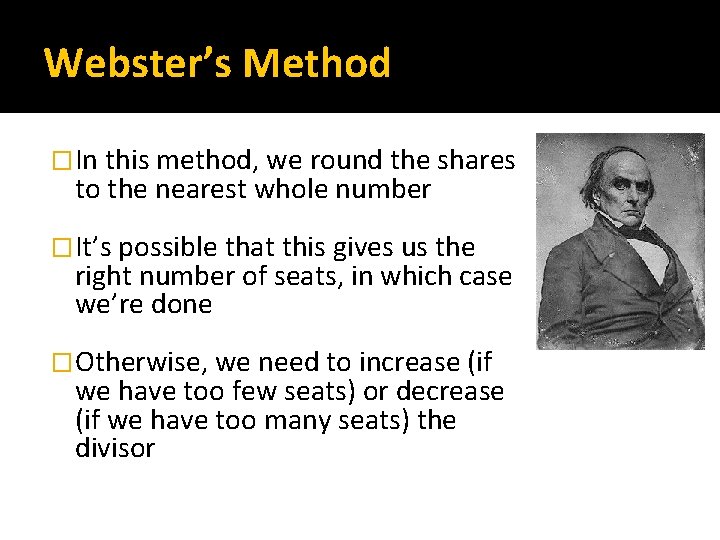
Webster’s Method �In this method, we round the shares to the nearest whole number �It’s possible that this gives us the right number of seats, in which case we’re done �Otherwise, we need to increase (if we have too few seats) or decrease (if we have too many seats) the divisor
Impossibility… Again �Even these alternative methods can cause quota rule violations �In fact, it was proved in 1980 that it is impossible to find an apportionment system that both avoids the paradoxes we discussed doesn’t violate the quota rule
- Slides: 67