Math 11 Apprenticeship and Workplace Unit 1 Slope


 Hours 0 1 2 3 4 Pay $9 $18 $27 $36 0")


- Slides: 14
Math 11 Apprenticeship and Workplace Unit 1 – Slope and Rate of Change 1. 3 – Rate of Change
Review •
Terms • Rate of Change • Dependent Variable • Independent Variable $/hour Definitions/Examples • The rate at which one variable changes compared to another one. • A variable whose value relies on the values of other variables • A variable whose values may be freely chosen.
Pay ($) Hours 0 1 2 3 4 Pay $9 $18 $27 $36 0 36 27 18 9 0 1 2 3 4 Hours Worked
• Linear Relation • When a relationship between the variables remains constant, it has a linear mathematical relationship. In other words, if you graph the points from your table of values, the points that you plot will form a straight line.
• Zero Slope • A line with a slope of zero is horizontal • Undefined Slope • A line with a slope that cannot be defined (the denominator is zero) is vertical • Positive Slope • A line that rises from left to right has a positive slope • Negative Slope • A line that drops from left to right has a negative slope
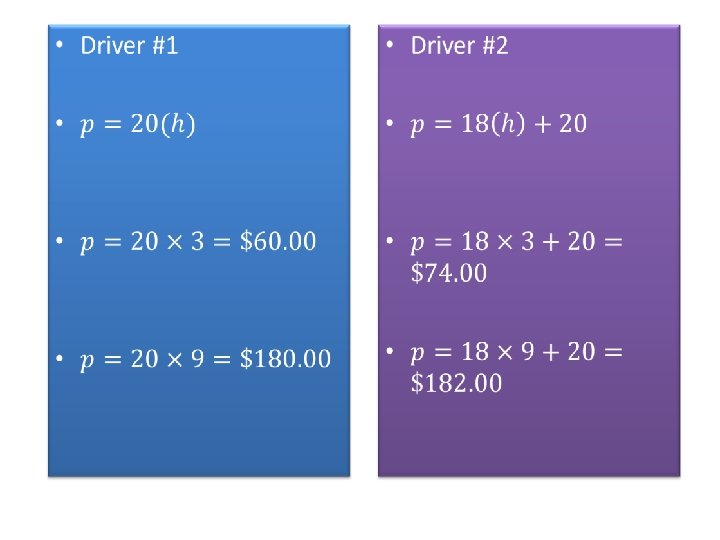
• A driver gets paid $20. 00/hour and another driver gets paid $18/hour plus a $20 gas allowance at the beginning of each workday for using their own vehicle. Write an equation to calculate each person’s pay, using p for pay and h for hours. Who makes more after 3 hours of work, 9 hours of work, and is there a point where they make the same amount?
Step 1 : Make a table of values with five points for each driver. Driver #1 Driver #2 Hours (h) Pay (p) 1 20 1 38 2 40 2 56 4 80 4 92 6 120 6 128 8 160 8 164
• Step 2: Write an equation for each driver. • Step 3: Draw the graph. Driver #1 Driver #2 Hours Pay (h) (p) 1 20 1 38 2 40 2 56 4 80 4 92 4 120 6 128 5 160 8 164 •
Today’s Assignment: Math Works Section 1. 3 – Rate of Change Go Over All Examples Do: P. 36 – P. 54 All missing work due Wednesday, Oct. 3 rd. See Printout