MATERIAL FLOW COST ACCOUNTING MFCA By NATIONAL PRODUCTIVITY
 By NATIONAL PRODUCTIVITY COUNCIL")
MATERIAL FLOW COST ACCOUNTING (MFCA) By NATIONAL PRODUCTIVITY COUNCIL

ABOUT MFCA �MFCA is an environmental management accounting tool developed in Germany in the late 1990 s; �MFCA , can help boost an company's economic and environmental performance;

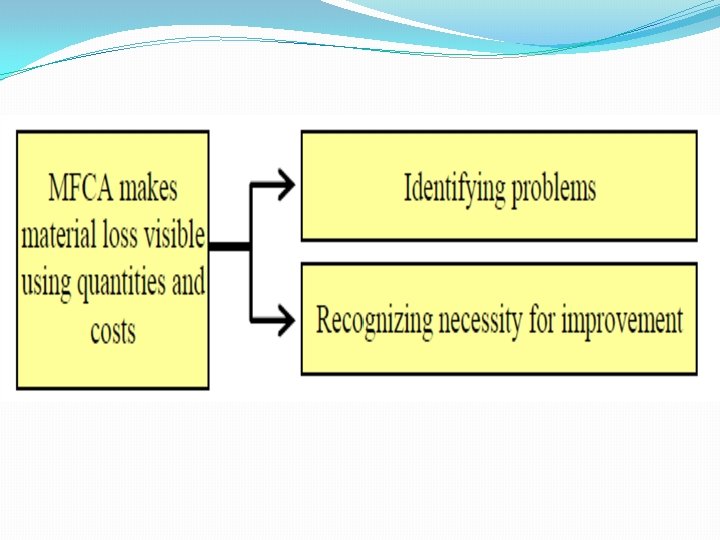
SIGNIFICANCE OF MFCA • MFCA focuses on Wastes, as profit is hidden in wastes • MFCA finds out the hidden profit Rs. MFCA Japanese “Mottainai” Concept, “What a shame to be wasteful” in ISO 3

SELECTED MODEL COMPANIES Sl. No. Name of Model Company Sector 1. M/s Somany Ceramics Ltd. , Kadi Ceramic 2. M/s Sainest Tubes Pvt. Ltd. , Chatral Steel Re-rolling 3. M/s Bhagwati Spherocast Pvt. Ltd. , Odhav Foundry 4. M/s Baroda Moulds and Dies, Vadodara Molds and Dies

INITIATION OF MFCA �The original MFCA concept was developed by Prof. Bernd Wagner & colleagues at IMU (Institute für Management und Umwelt) in Augsburg, Germany; �Introduced in Japan around 2000; �Many Japanese companies have since adopted MFCA;

Benefits of MFCA Internal benefits l l Increases Profit Improves Productivity External benefits l l Reduces Environmental Impacts Reduces Wastages Contributes to Sustainable Development 7 7

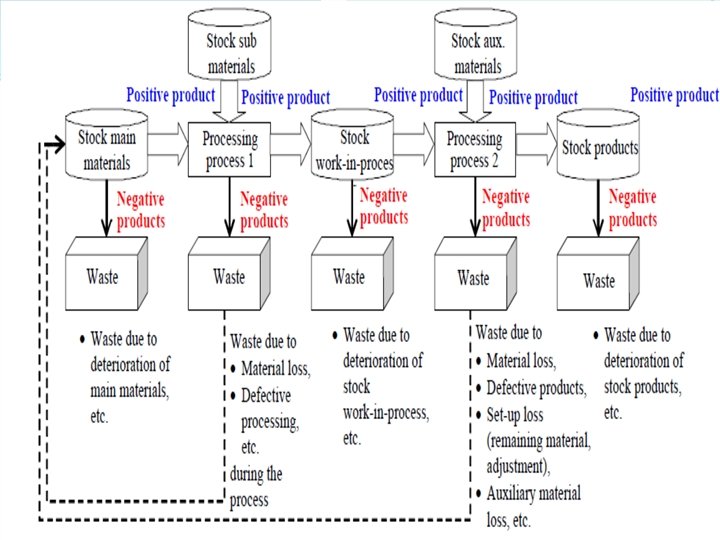
MFCA Evaluation Quantify & Track Flows & Stocks of Materials Evaluate Costs of Material Flows

MFCA The resulting information can help companies & managers to seek opportunities to generate financial benefits & reduce environmental impacts. MFCA is applicable to any organization that uses materials and energy.

Cost Elements: MFCA Cost Elements 1. Material: Input Value of Material 2. Energy: Input Value of Energy 3. System: Labor, Depreciation etc. , 4. Disposal: Waste Management Cost 10

MFCA and PDCA Cycle Determine the applicable product and boundary Make the flow cost matrix Set up the material flow model Analyze material flow data (loss analysis and process analysis) Establish quantity centers Collect material flow data Repeat this cycle Plan measures to solve problems Decide data collection methods Implement measures planned Determine allocation methods of energy and system cost Collect material flow data Cost reduction and lowered environmental impacts 11

QUANTITY CENTER IN MFCA

CASE 1: PLASTIC MOLDING
")
PLASTIC MOLDING (2)

MFCA FLOW MODEL
 (Rs. )")
MATERIAL FLOW COST MATRIX Mass Material Cost Energy Cost System Cost (kg) (Rs. ) Waste Mgmt. Cost (Rs. ) Sum Total Input 100 6600 700 2000 700 10000 (100%) Positive Product (Product) 65 (65%) 4290 455 1300 - 6045 (60%) Negative Product (Material Loss) 35 (35%) 2310 245 700 3955 (40%) (Rs. )

MFCA IN SUPPLY CHAIN

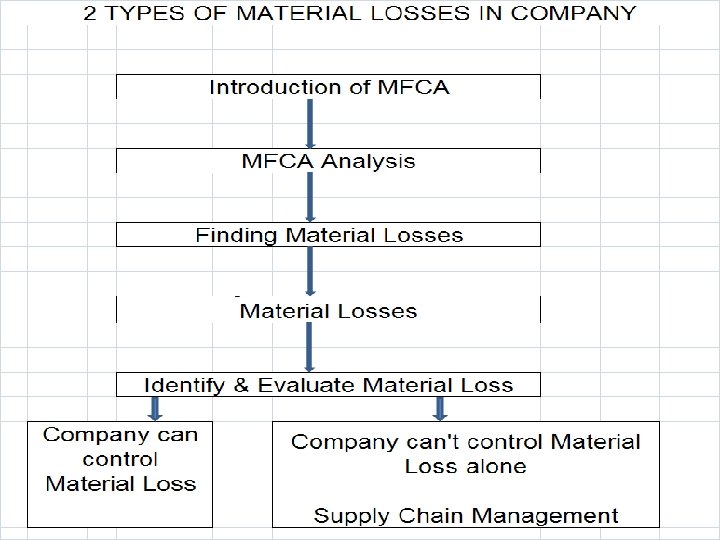
MFCA – SUPPLY CHAIN �MFCA can be extended to other organizations in the supply chain, both upstream and downstream; �Waste generation in an organization is often driven by the nature or quality of materials provided by a supplier, or the specification of the product requested by a customer.

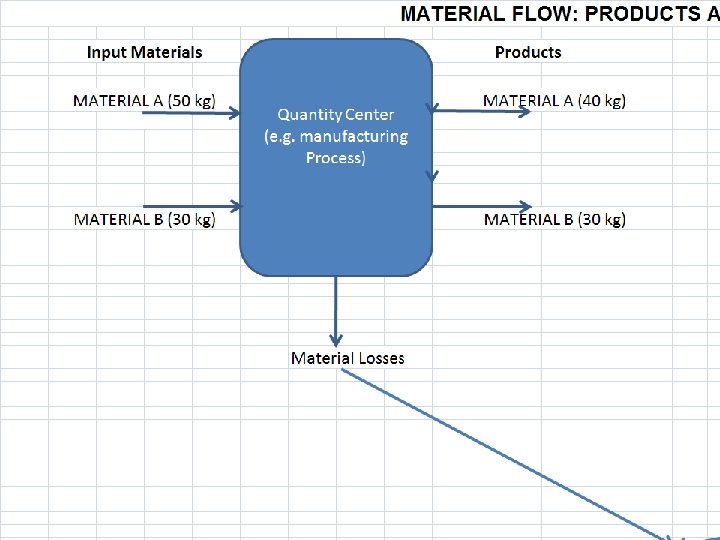
PRODUCTS AND MATERIAL LOSSES

COST EVALUATION OF MFCA POSITIVE PRODUCTS 1. Material Costs NEGATIVE PRODUCTS Material Costs • Material A : 40 kg x Rs. 100/kg = Rs. 4000/10 kg x Rs. 100/kg = Rs. 1000/ • Material B : 30 kg = Rs. 500/2. Energy Costs 3. System Costs 4. Waste Management Costs
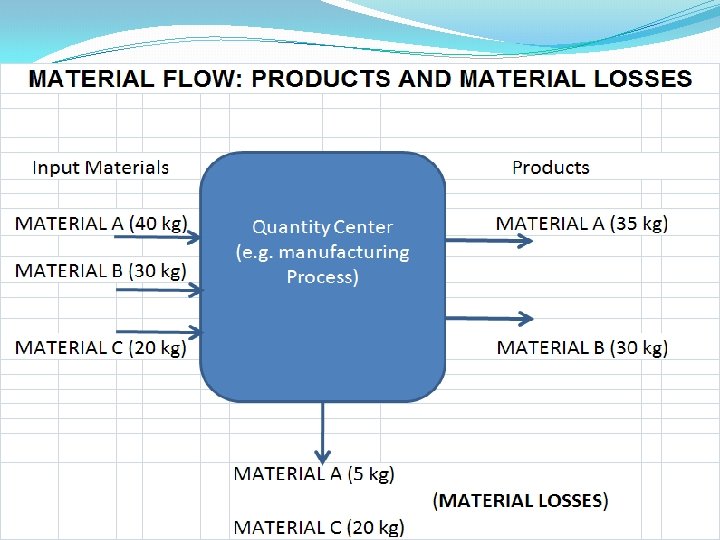

COST EVALUATION OF MFCA POSITIVE PRODUCTS NEGATIVE PRODUCTS 1. Material Costs • Material A : 35 kg x Rs. 100/kg = Rs. 3500/- • Material A : 5 kg x Rs. 100/kg = Rs. 500/- • Material B : 30 kg = Rs. 500/- • Material C : 20 kg= Rs. 250/- 2. Energy Costs 3. System Costs 4. Waste Management Costs
 Simple")
BENEFITS- MODEL COMPANIES Name of Model Company Investment Annual Monetary Savings (Rs. ) Simple Payback Period M/s Somany Ceramics Ltd. 2, 000/- 35, 000/- Immediate M/s Sainest Tubes Pvt. Ltd. 4, 95, 000/- 2, 09, 43, 924/- 09 days 1, 74, 17, 496/- About 1 Year M/s Bhagwati Spherocast Pvt. Ltd. 1, 00, 000/M/s Baroda Molds and Dies 2, 00, 000/- 2, 47, 000/- About 1 Year

BENEFITS- MODEL COMPANIES By implementation of MFCA, Model Companies have improved their overall material savings, resource and energy savings with enhanced monetary savings bringing about improvement in company’s overall productivity.

- Slides: 28