
MASTER SCHEDULE CALCULATION EXAMPLE BIBLIOGRAPHY The following are
MASTER SCHEDULE CALCULATION EXAMPLE BIBLIOGRAPHY The following are the reference books used for this section: APICS Dictionary, 12 th Edition 2008 APICS Learning System, Version 2. 1, 2010 Edition Arnold, J. R. Tony, S. N. Chapman, and L. M. Clive. Introduction to Materials Management, 6 th edition, Prentice Hall, 2008 References: Quality Management Solutions Slide 1
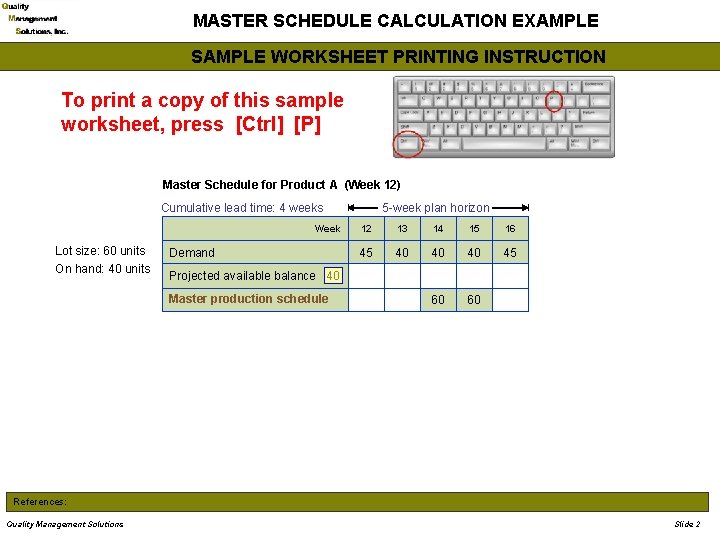
MASTER SCHEDULE CALCULATION EXAMPLE SAMPLE WORKSHEET PRINTING INSTRUCTION To print a copy of this sample worksheet, press [Ctrl] [P] Master Schedule for Product A (Week 12) Cumulative lead time: 4 weeks Week Lot size: 60 units On hand: 40 units Demand 5 -week plan horizon 12 13 14 15 16 45 40 40 40 45 60 60 Projected available balance 40 Master production schedule References: Quality Management Solutions Slide 2
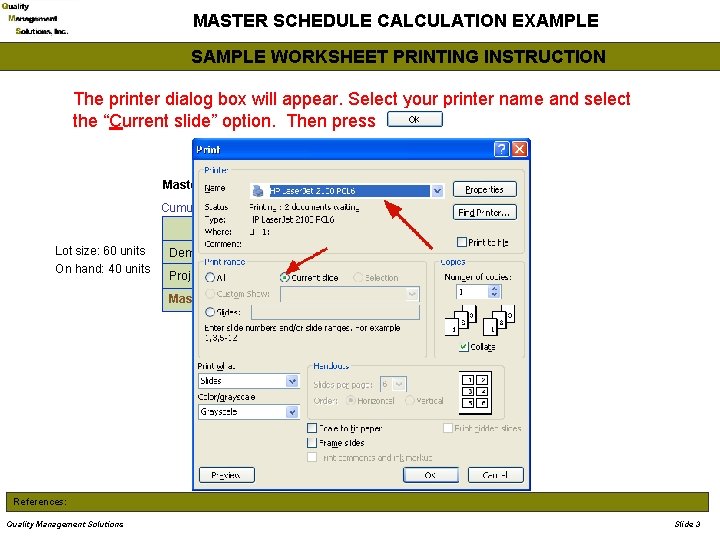
MASTER SCHEDULE CALCULATION EXAMPLE SAMPLE WORKSHEET PRINTING INSTRUCTION The printer dialog box will appear. Select your printer name and select the “Current slide” option. Then press Master Schedule for Product A (Week 12) Cumulative lead time: 4 weeks Week Lot size: 60 units On hand: 40 units Demand 5 -week plan horizon 12 13 14 15 16 45 40 40 40 45 60 60 Projected available balance 40 Master production schedule References: Quality Management Solutions Slide 3
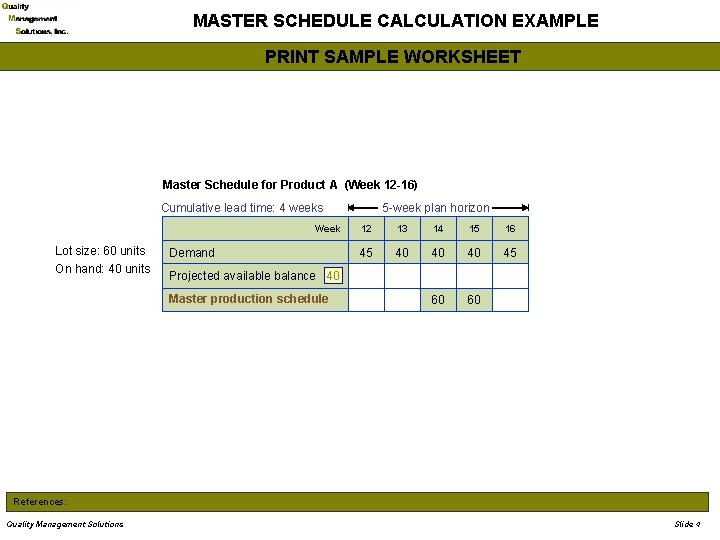
MASTER SCHEDULE CALCULATION EXAMPLE PRINT SAMPLE WORKSHEET Master Schedule for Product A (Week 12 -16) Cumulative lead time: 4 weeks Week Lot size: 60 units On hand: 40 units Demand 5 -week plan horizon 12 13 14 15 16 45 40 40 40 45 60 60 Projected available balance 40 Master production schedule References: Quality Management Solutions Slide 4
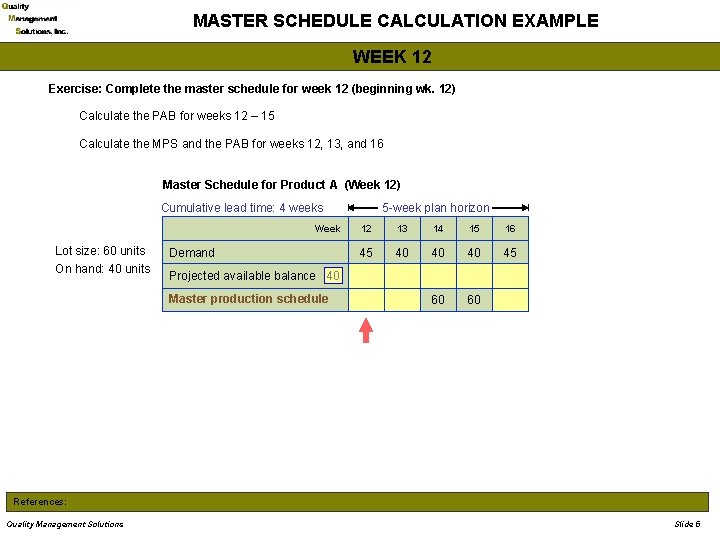
MASTER SCHEDULE CALCULATION EXAMPLE WEEK 12 Exercise: Complete the master schedule for week 12 (beginning wk. 12) Calculate the PAB for weeks 12 – 15 Calculate the MPS and the PAB for weeks 12, 13, and 16 Master Schedule for Product A (Week 12) Cumulative lead time: 4 weeks Week Lot size: 60 units On hand: 40 units Demand 5 -week plan horizon 12 13 14 15 16 45 40 40 40 45 60 60 Projected available balance 40 Master production schedule References: Quality Management Solutions Slide 5
MASTER SCHEDULE CALCULATION EXAMPLE WEEK 12 References:
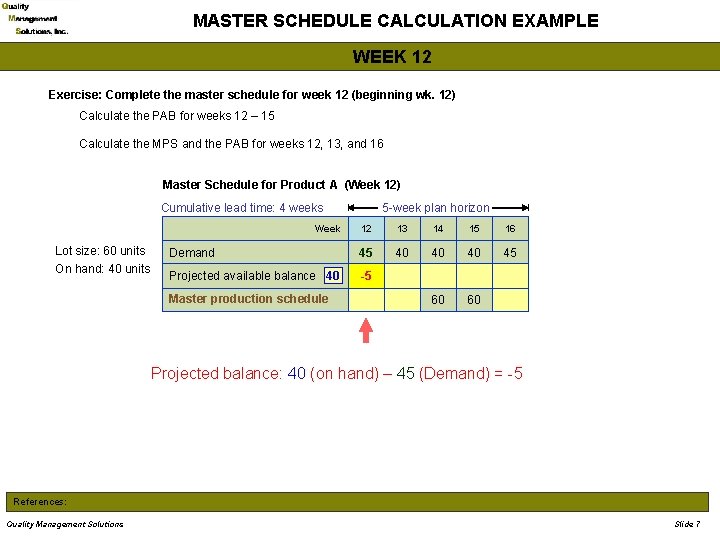
MASTER SCHEDULE CALCULATION EXAMPLE WEEK 12 Exercise: Complete the master schedule for week 12 (beginning wk. 12) Calculate the PAB for weeks 12 – 15 Calculate the MPS and the PAB for weeks 12, 13, and 16 Master Schedule for Product A (Week 12) Cumulative lead time: 4 weeks Week Lot size: 60 units On hand: 40 units 5 -week plan horizon 12 13 14 15 16 Demand 45 40 40 40 45 Projected available balance 40 -5 60 60 Master production schedule Projected balance: 40 (on hand) – 45 (Demand) = -5 References: Quality Management Solutions Slide 7
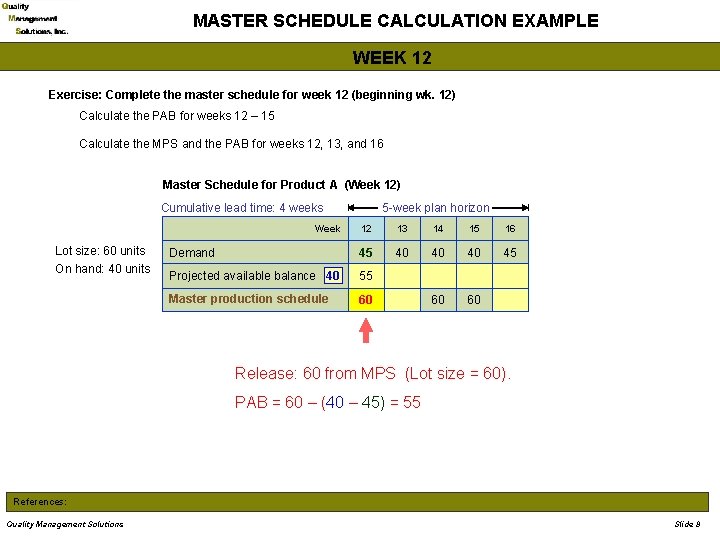
MASTER SCHEDULE CALCULATION EXAMPLE WEEK 12 Exercise: Complete the master schedule for week 12 (beginning wk. 12) Calculate the PAB for weeks 12 – 15 Calculate the MPS and the PAB for weeks 12, 13, and 16 Master Schedule for Product A (Week 12) Cumulative lead time: 4 weeks Week Lot size: 60 units On hand: 40 units 5 -week plan horizon 12 13 14 15 16 Demand 45 40 40 40 45 Projected available balance 40 55 Master production schedule 60 60 60 Release: 60 from MPS (Lot size = 60). PAB = 60 – (40 – 45) = 55 References: Quality Management Solutions Slide 8
MASTER SCHEDULE CALCULATION EXAMPLE WEEK 13 References:
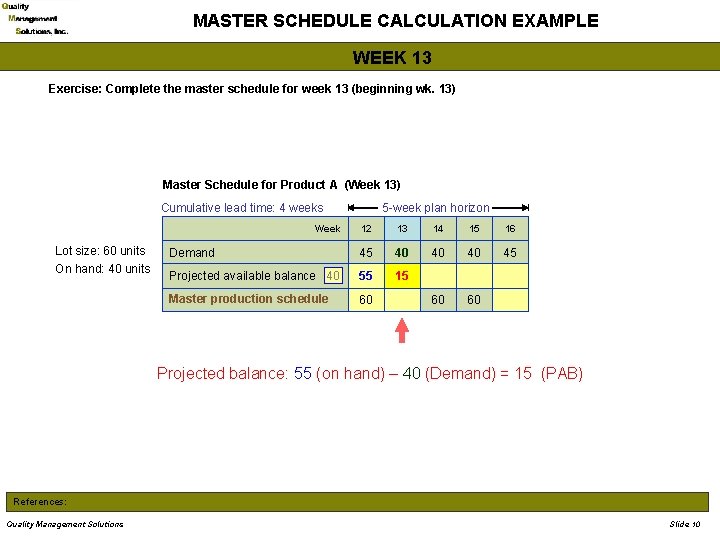
MASTER SCHEDULE CALCULATION EXAMPLE WEEK 13 Exercise: Complete the master schedule for week 13 (beginning wk. 13) Master Schedule for Product A (Week 13) Cumulative lead time: 4 weeks 12 13 14 15 16 Demand 45 40 40 40 45 Projected available balance 40 55 15 Master production schedule 60 60 60 Week Lot size: 60 units On hand: 40 units 5 -week plan horizon Projected balance: 55 (on hand) – 40 (Demand) = 15 (PAB) References: Quality Management Solutions Slide 10
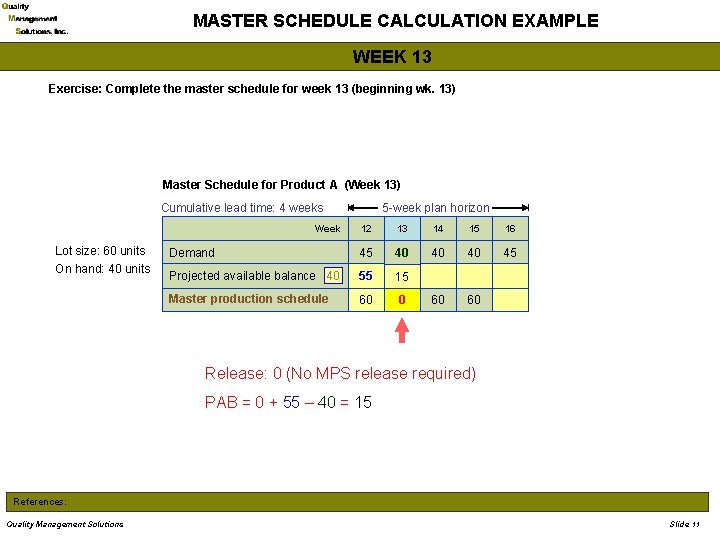
MASTER SCHEDULE CALCULATION EXAMPLE WEEK 13 Exercise: Complete the master schedule for week 13 (beginning wk. 13) Master Schedule for Product A (Week 13) Cumulative lead time: 4 weeks Week Lot size: 60 units On hand: 40 units 5 -week plan horizon 12 13 14 15 16 Demand 45 40 40 40 45 Projected available balance 40 55 15 Master production schedule 60 0 60 60 Release: 0 (No MPS release required) PAB = 0 + 55 – 40 = 15 References: Quality Management Solutions Slide 11
MASTER SCHEDULE CALCULATION EXAMPLE WEEK 14 References:
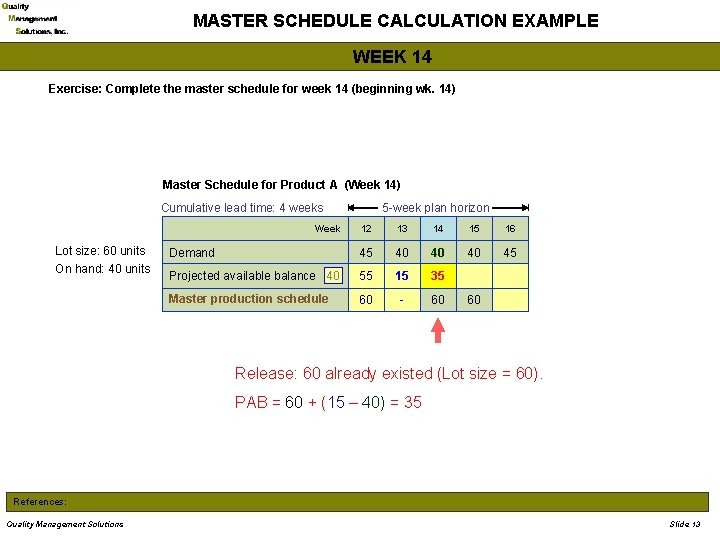
MASTER SCHEDULE CALCULATION EXAMPLE WEEK 14 Exercise: Complete the master schedule for week 14 (beginning wk. 14) Master Schedule for Product A (Week 14) Cumulative lead time: 4 weeks Week Lot size: 60 units On hand: 40 units 5 -week plan horizon 12 13 14 15 16 Demand 45 40 40 40 45 Projected available balance 40 55 15 35 Master production schedule 60 - 60 60 Release: 60 already existed (Lot size = 60). PAB = 60 + (15 – 40) = 35 References: Quality Management Solutions Slide 13
MASTER SCHEDULE CALCULATION EXAMPLE WEEK 15 References:
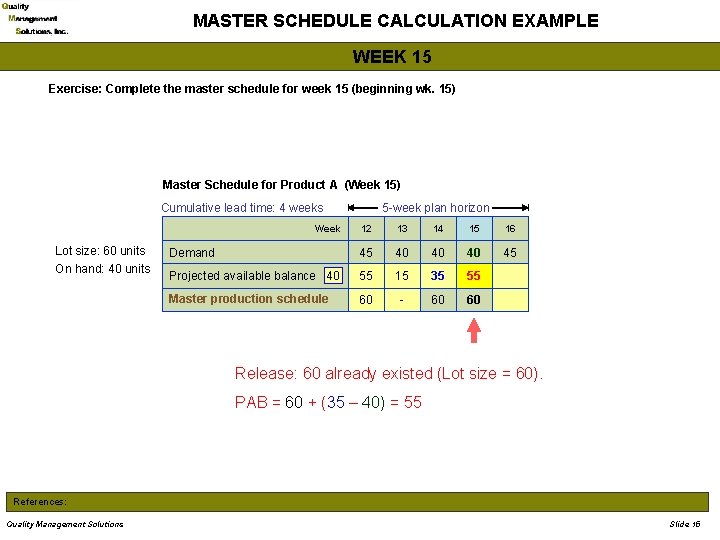
MASTER SCHEDULE CALCULATION EXAMPLE WEEK 15 Exercise: Complete the master schedule for week 15 (beginning wk. 15) Master Schedule for Product A (Week 15) Cumulative lead time: 4 weeks Week Lot size: 60 units On hand: 40 units 5 -week plan horizon 12 13 14 15 16 Demand 45 40 40 40 45 Projected available balance 40 55 15 35 55 Master production schedule 60 - 60 60 Release: 60 already existed (Lot size = 60). PAB = 60 + (35 – 40) = 55 References: Quality Management Solutions Slide 15
MASTER SCHEDULE CALCULATION EXAMPLE WEEK 16 References:
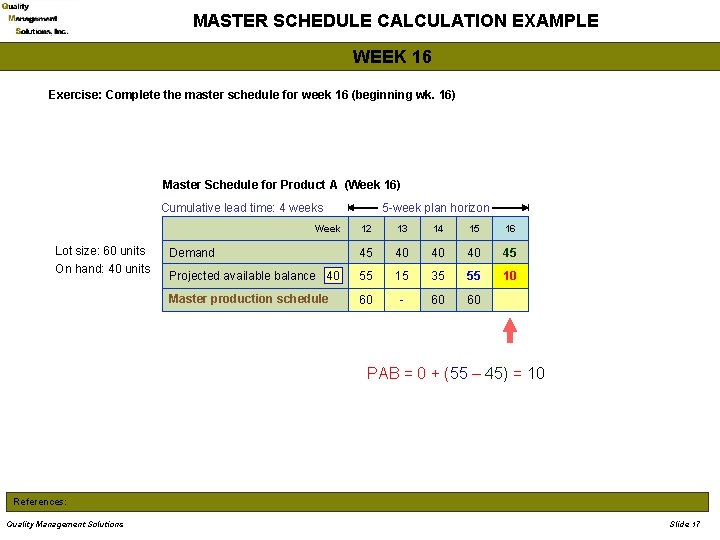
MASTER SCHEDULE CALCULATION EXAMPLE WEEK 16 Exercise: Complete the master schedule for week 16 (beginning wk. 16) Master Schedule for Product A (Week 16) Cumulative lead time: 4 weeks Week Lot size: 60 units On hand: 40 units 5 -week plan horizon 12 13 14 15 16 Demand 45 40 40 40 45 Projected available balance 40 55 15 35 55 10 Master production schedule 60 - 60 60 PAB = 0 + (55 – 45) = 10 References: Quality Management Solutions Slide 17
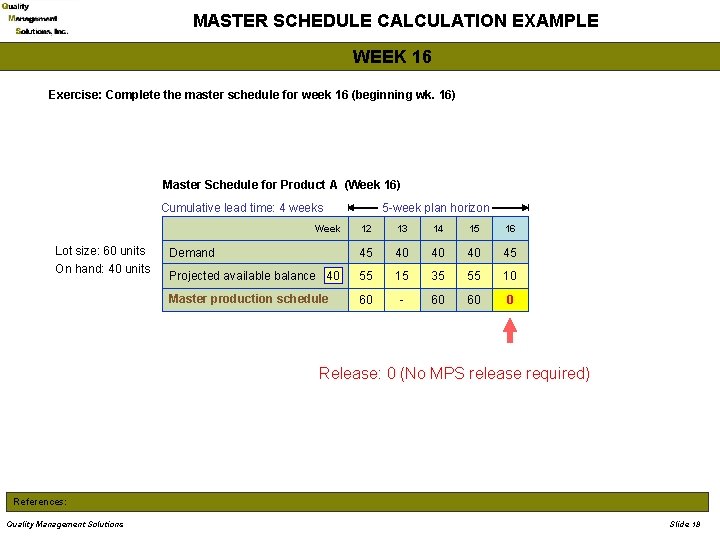
MASTER SCHEDULE CALCULATION EXAMPLE WEEK 16 Exercise: Complete the master schedule for week 16 (beginning wk. 16) Master Schedule for Product A (Week 16) Cumulative lead time: 4 weeks Week Lot size: 60 units On hand: 40 units 5 -week plan horizon 12 13 14 15 16 Demand 45 40 40 40 45 Projected available balance 40 55 15 35 55 10 Master production schedule 60 - 60 60 0 Release: 0 (No MPS release required) References: Quality Management Solutions Slide 18
MASTER SCHEDULE CALCULATION EXAMPLE FINAL ANSWER SHEET References:
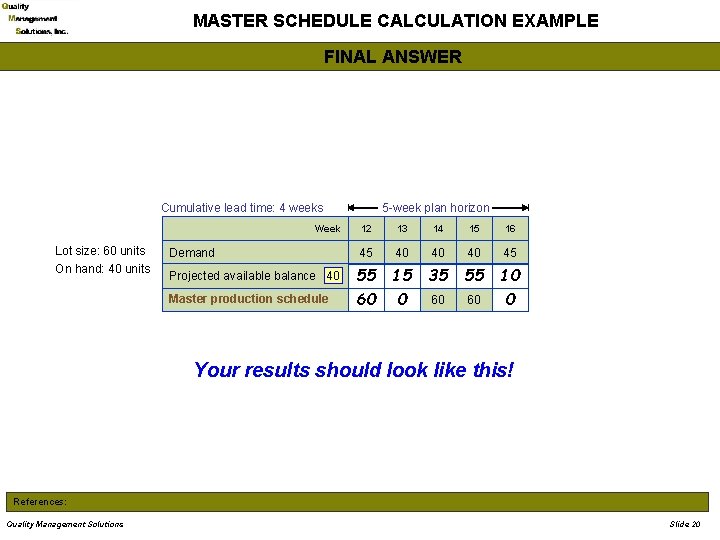
MASTER SCHEDULE CALCULATION EXAMPLE FINAL ANSWER Cumulative lead time: 4 weeks Week Lot size: 60 units On hand: 40 units 5 -week plan horizon 12 13 14 15 16 Demand 45 40 40 40 45 Projected available balance 40 55 15 35 55 10 Master production schedule 60 0 60 60 0 Your results should look like this! References: Quality Management Solutions Slide 20
- Slides: 20