
Mass Transit OSullivan Chapter 11 Outline of the

- Slides: 16
Mass Transit O’Sullivan Chapter 11
Outline of the Chapter • Analyze some empirical facts about public transit in the United States • Analyze the commuter’s decision of travel mode • Analyze the policy maker’s decision to design public transportation
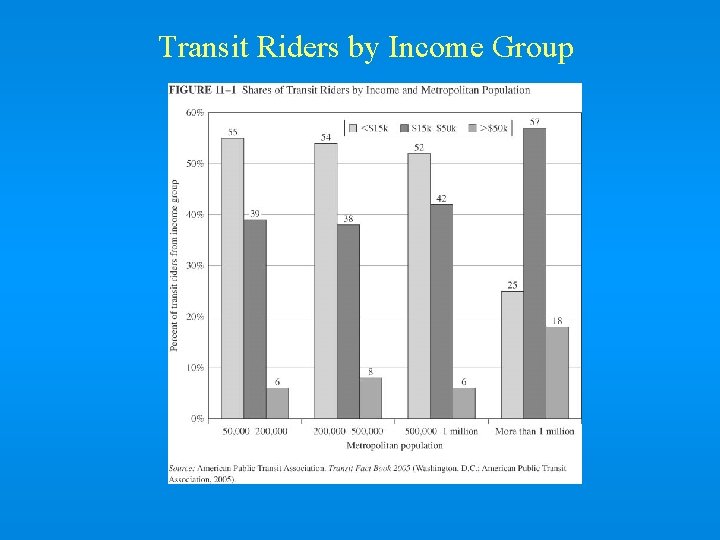
Transit Riders by Income Group
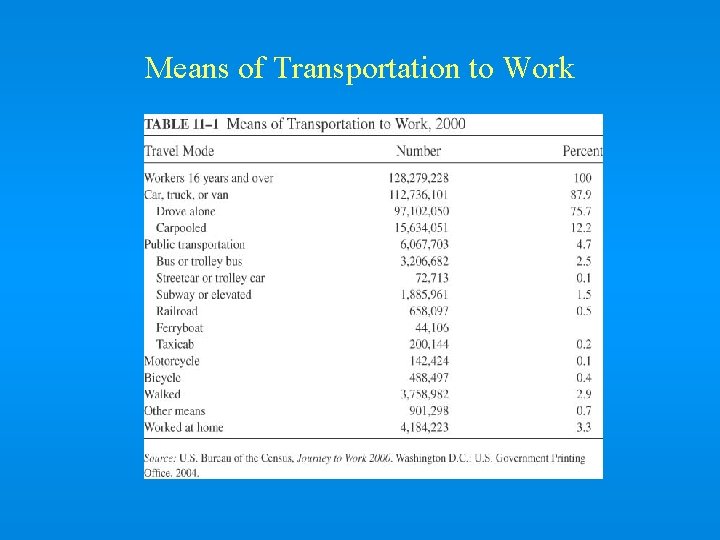
Means of Transportation to Work
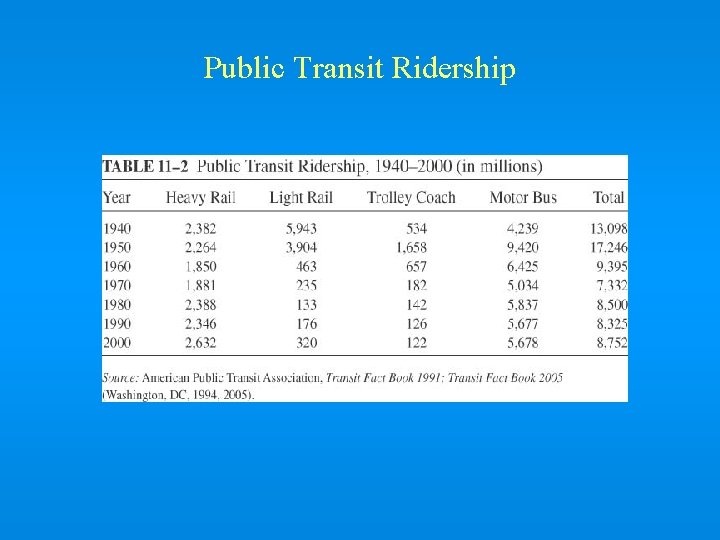
Public Transit Ridership
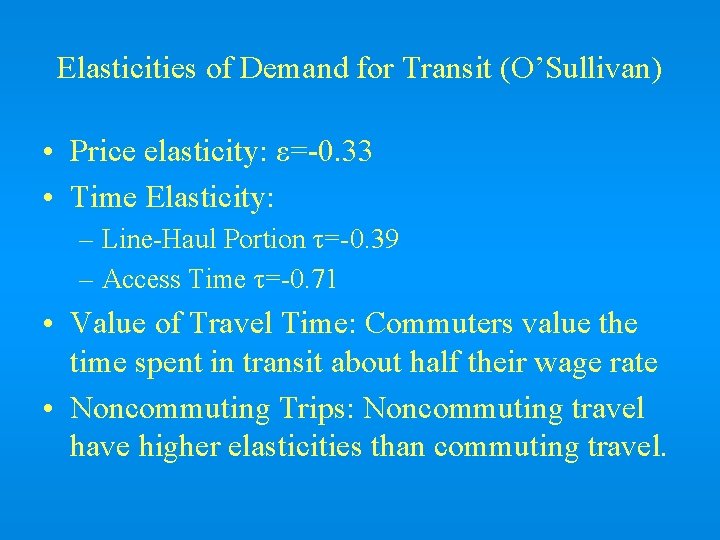
Elasticities of Demand for Transit (O’Sullivan) • Price elasticity: ε=-0. 33 • Time Elasticity: – Line-Haul Portion τ=-0. 39 – Access Time τ=-0. 71 • Value of Travel Time: Commuters value the time spent in transit about half their wage rate • Noncommuting Trips: Noncommuting travel have higher elasticities than commuting travel.
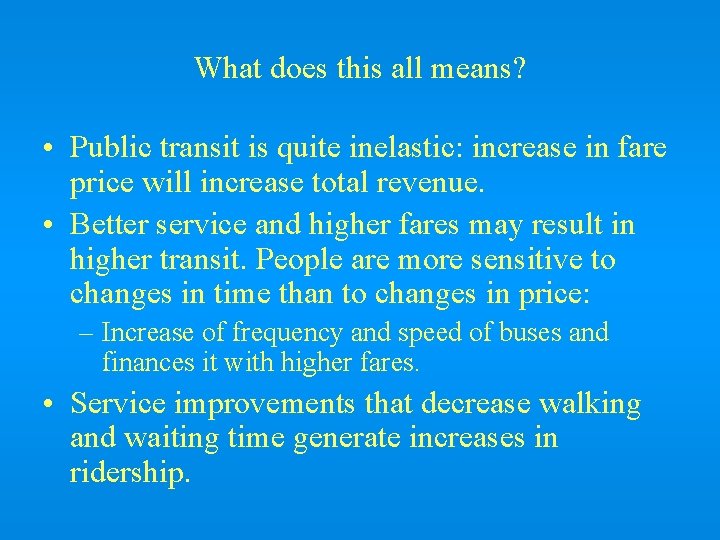
What does this all means? • Public transit is quite inelastic: increase in fare price will increase total revenue. • Better service and higher fares may result in higher transit. People are more sensitive to changes in time than to changes in price: – Increase of frequency and speed of buses and finances it with higher fares. • Service improvements that decrease walking and waiting time generate increases in ridership.
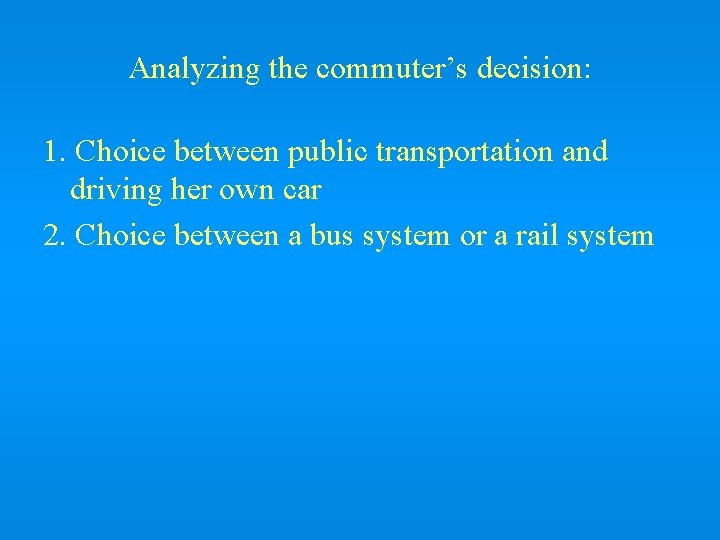
Analyzing the commuter’s decision: 1. Choice between public transportation and driving her own car 2. Choice between a bus system or a rail system
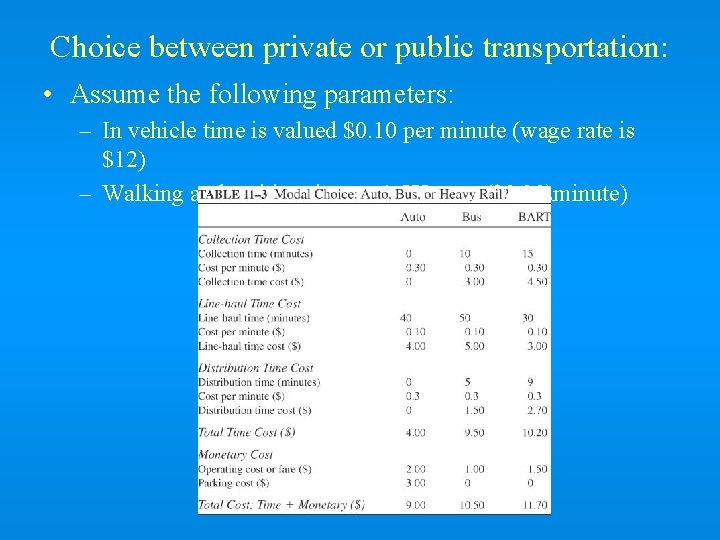
Choice between private or public transportation: • Assume the following parameters: – In vehicle time is valued $0. 10 per minute (wage rate is $12) – Walking and waiting time at 1. 5 Xwage ($0. 30minute)
How can we get the consumer to ride the bus? • Raise cost of car driving: – Congestion Tax – Gasoline Tax • Improve Service – Lower collection and distribution tax – Lower line-haul time • Lower the cost of public transportation – What if we make it free?
Choice between bus or rail system • Buses: – Bus headway: period of time between buses on the bus route – Space between stops: increases line-haul time, but decreases collection and distribution time • Rail System – Mainline versus integrated systems • Mainline Systems: Relies on other modes to collect riders • Integrated System: Entire trip in single vehicle – Spacing between stations (tradeoff between linehaul and collection time)
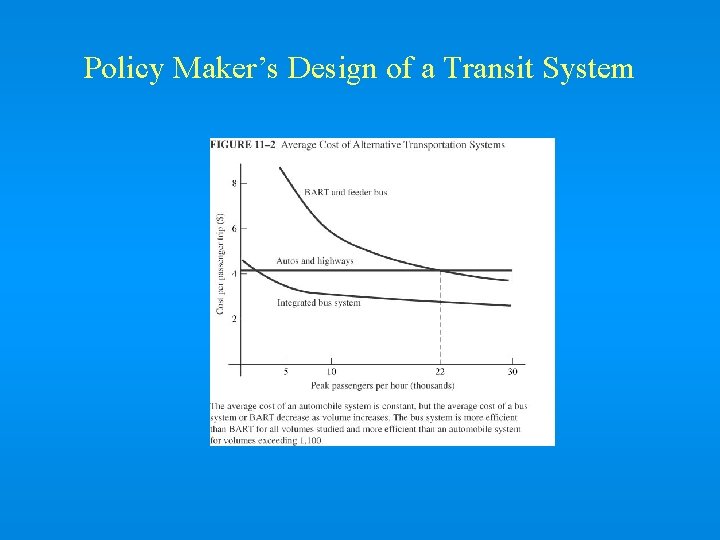
Policy Maker’s Design of a Transit System
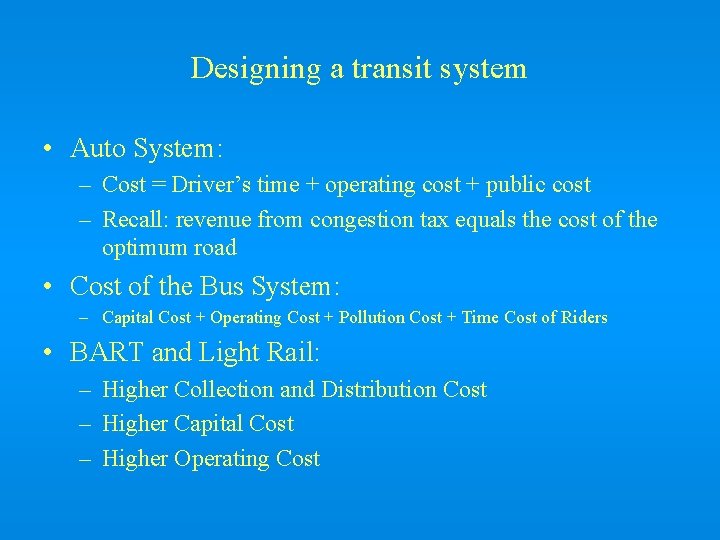
Designing a transit system • Auto System: – Cost = Driver’s time + operating cost + public cost – Recall: revenue from congestion tax equals the cost of the optimum road • Cost of the Bus System: – Capital Cost + Operating Cost + Pollution Cost + Time Cost of Riders • BART and Light Rail: – Higher Collection and Distribution Cost – Higher Capital Cost – Higher Operating Cost
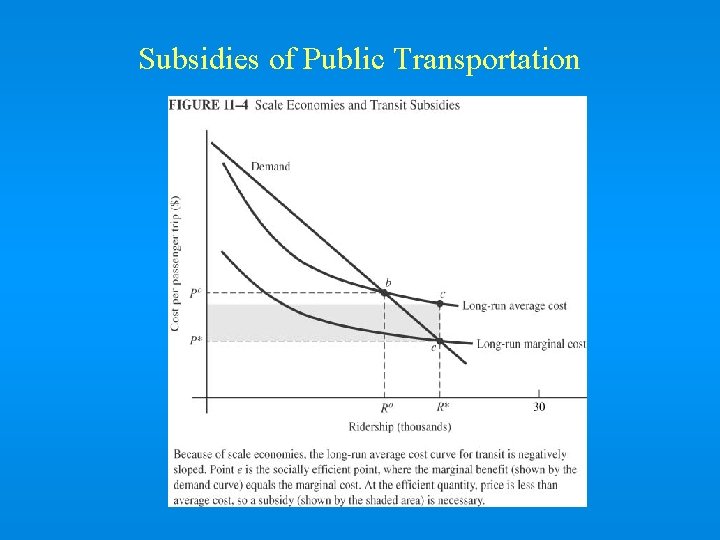
Subsidies of Public Transportation
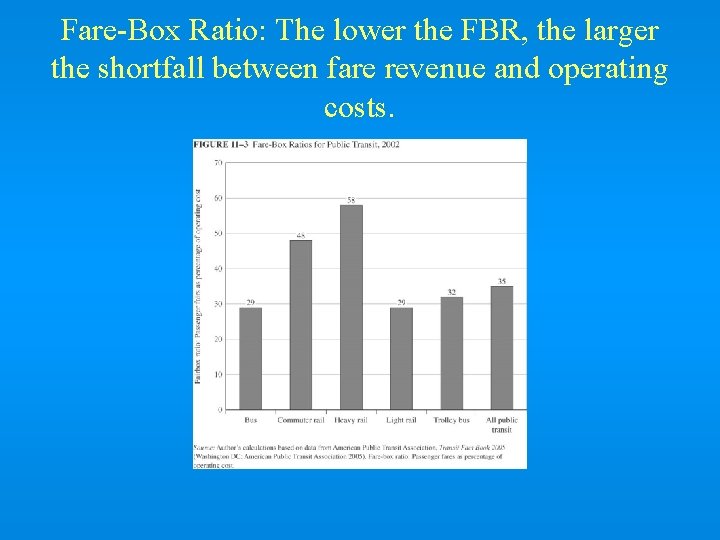
Fare-Box Ratio: The lower the FBR, the larger the shortfall between fare revenue and operating costs.