Mass Spectrometer Block Diagram High Vacuum System Inlet

Mass Spectrometer Block Diagram High Vacuum System Inlet Ion source Mass Analyzer Detector Data System

Bir kütle spektrometrenin şematik diyagramı

Kütle Spektroskopisi – Kullanım Alanları • Maddelerin elementel bileşiminin belirlenmesinde • İnorganik, organik ve biyolojik moleküllerin yapılarının aydınlatılmasında • Kompleks karışımların kalitatif ve kantitatif tayininde • Bir numunedeki atomların izotop oranlarının belirlenmesinde

Common Small Ions m/z 15 Da 17 18 19 26 27 28 29 30 31 33 34 35(37) 36(38) 39 41 42 43 44 46 57 60 79(81) 80(82) 91 127 composition CH 3 OH H 2 O H 3 O, F C 2 H 2, CN C 2 H 3 C 2 H 4, CO, H 2 CN C 2 H 5, CHO CH 2 NH 2 CH 3 O SH, CH 2 F H 2 S Cl HCl C 3 H 3 C 3 H 5, C 2 H 3 N C 3 H 6, C 2 H 2 O, C 2 H 4 N C 3 H 7, CH 3 CO C 2 H 4 O NO 2 C 4 H 8 C 4 H 9 CH 4 CO 2 Br HBr C 7 H 7 I Common Neutral Fragments mass loss 1 Da 15 17 18 19 20 27 28 30 31 32 33 35(37) 36(38) 42 43 44 45 57 59 60 64 79(81) 80(82) 127 composition H CH 3 OH H 2 O F HF C 2 H 3, HCN C 2 H 4, CO CH 2 O CH 3 O CH 4 O, S CH 3 + H 2 O, HS H 2 S Cl HCl C 3 H 6, C 2 H 2 O, C 2 H 4 N C 3 H 7, CH 3 CO CO 2 O, CONH 2 C 2 H 5 O C 4 H 7 C 4 H 9 C 2 H 3 O 2 C 2 H 4 O 2 SO 2 Br HBr I

43 58 15 29 44

4 -methyl-3 -pentene-2 -one,

29 58

Mc-Laferty parçalanması

The MS of benzyl alcohol is shown below. The molecular ion is seen at m/z = 108. Fragmentation via loss of 17 (-OH) gives a common fragment seen for alkyl benzenes at m/z = 91. Loss of 31 (-CH 2 OH) from the molecular ion gives 77 corresponding to the phenyl cation. Note the small peaks at 109 and 110 which correspond to the presence of small amounts of 13 C in the sample (which has about 1% natural abundance).

4 -nonanone The odd-electron fragment ions at m/z = 86 and 58 are the result of a Mc. Lafferty rearrangement, involving the larger alkyl chain, and a subsequent loss of ethene (the "double -Mc. Lafferty" rearrangement). Alpha-cleavage leads to the m/z = 99, 71 and 43 ions. The charge is apparently distributed over both fragments.

sec-butyl isopropyl ether The peak at m/z = 43 is due to isopropyl cation, the peak at 57 is due to isobutyl cation, the peak at 87 is due to loss of ethyl from the molecular ion, and the peak at 101 is due to loss of methyl. M is at m/z = 116.

butylpentanoate Alpha-cleavage gives ions at m/z=57 & 85 Da. The Mc. Lafferty rearrangement on the acid side generates a m/z=116 ion. Subsequent rearrangement on the alcohol side generates m/z=60 and 56 ions. The m/z=103 ion is probably C 4 H 9 CO 2 H 2(+).

4, 4 -dimethylcyclohexene The loss of a methyl radical generates the base peak at m/z=95 Da. The m/z=81 & 67 ions are smaller homologues of this ion (14 mass units less). Cyclohexene compounds undergo a retro-Diel-Alder rearrangement to give diene and alkene fragments. The charge may reside on either fragment, with the larger usually predominating. In this case both ions are relatively strong (m/z=54 & 56).

Alkenlerin Kütle Spektrumu Rezonans ile kararlı hale gelen karbokatyonların olusumu tercih edilir.

Alkoller ve aminler kütle spektroskopisinde moleküler iyon piki veremiyebilirler. Çünkü heteroatomlu bileşiklerden oluşan moleküler iyon pikleri kararsızdır ve dedektöre varamadan genellikle parçalanırlar. Yapılarında heteroatoma (N veya O) komşu karbondan sonraki bağda homolitik yarılma gözlenir. Heteroatomdan bir bağ yapmamış elektronun çıkartılmasıyla oluşan moleküler iyon derhal bitişik atomdan sonraki sigma bağının homolitik parçalanmasına uğrar(α-cleavage). Parçalanma sonucu oluşan oksonyum/iminyumkatyonları temel pik olarak gözlenir.

m/z=73 kararsiz Molecular ion peak is an odd number. Alpha-cleavage dominates aliphatic amines. 5 -methyl-5 -hexen-3 -ol The molecular ion (m/z=114 Da) is not observed under electron impact ionization conditions. The highest mass ion (m/z=85) is due to an alpha-cleavage of ethyl; the other alpha-cleavage generates m/z=59. The rearrangement cleavage shown here generates the m/z=56 ion.

3 -Pentanol C 5 H 12 O MW = 88. 15 An alcohol's molecular ion is small or non-existent. Cleavage of the C-C bond next to the oxygen usually occurs. A loss of H 2 O may occur as in the spectra below. 3 -Phenyl-2 -propenal C 9 H 8 O MW = 132. 16 Cleavage of bonds next to the carboxyl group results in the loss of hydrogen (molecular ion less 1) or the loss of CHO (molecular ion less 29).

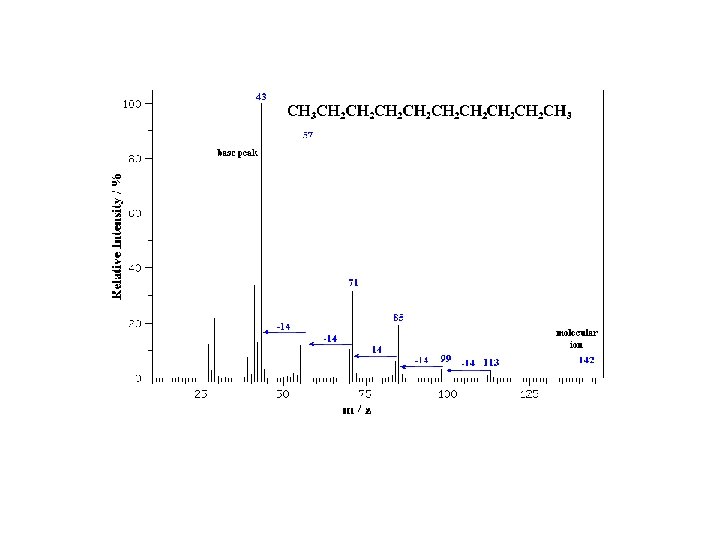
Hexane C 6 H 14 MW = 86. 18 Molecular ion peaks are present, possibly with low intensity. The fragmentation pattern contains clusters of peaks 14 mass units apart (which represent loss of (CH 2)n. CH 3). 3 -Methylbutyramide C 5 H 11 NO MW = 101. 15 Primary amides show a base peak due to the Mc. Lafferty rearrangement.

4 -Heptanone C 7 H 14 O MW = 114. 19 Major fragmentation peaks result from cleavage of the C-C bonds adjacent to the carbonyl. n-Methylbenzylamine C 8 H 11 N MW = 121. 18 Another example is a secondary amine shown below. Again, the molecular ion peak is an odd number. The base peak is from the C-C cleavage adjacent to the C-N bond.

Naphthalene C 10 H 8 MW = 128. 17 Molecular ion peaks are strong due to the stable structure. 2 -Butenoic acid C 4 H 6 O 2 MW = 86. 09 In short chain acids, peaks due to the loss of OH (molecular ion less 17) and COOH (molecular ion less 45) are prominent due to cleavage of bonds next to C=O.

Ethyl acetate C 4 H 8 O 2 MW = 88. 11 Fragments appear due to bond cleavage next to C=O (alkoxy group loss, -OR) and hydrogen rearrangements. Ethyl methyl ether C 3 H 8 O MW = 60. 10 Fragmentation tends to occur alpha to the oxygen atom (C-C bond next to the oxygen).

The mass spectrum of 2, 2 -dimethylpropanal contains a small peak at m/z= 86 and a base peak at m/z= 57. a) Draw the structure of the molecular ion of 2, 2 -dimethylpropanal b) Write an equation for the fragmentation of the molecular ion shown in part a that leads to the formation of the ion that gives rise to the base peak

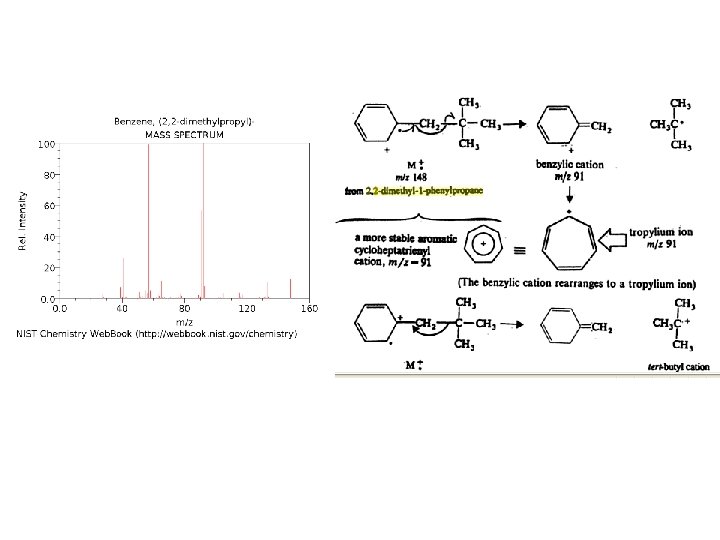
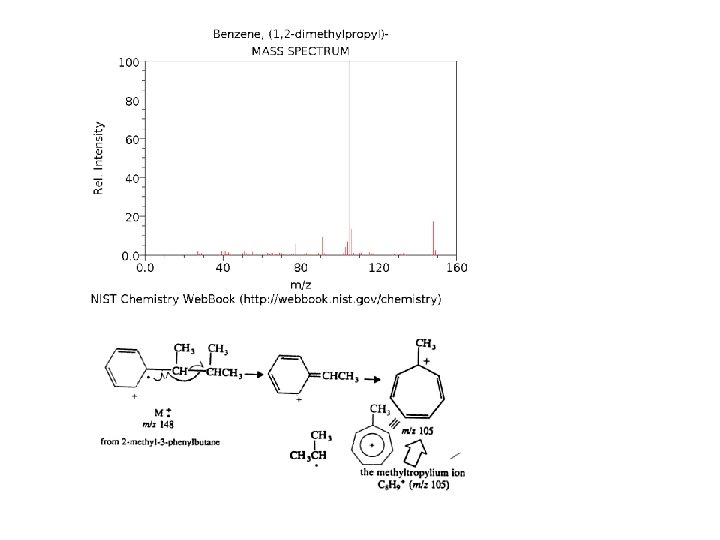
Even though these compounds are very similar in size, it is a simple matter to identify them from their individual mass spectra.

Relative Isotope Abundance of Common Elements: Isotope Relative Abundance Natural abundance Carbon 12 C 100 Hydrogen 1 H Nitrogen Natural abundance Isotope Relative Abundance 98. 89 13 C 1. 11 100 99. 99 2 H . 016 14 N 100 99. 64 15 N . 38 Oxygen 16 O 100 99. 76 17 O . 04 18 O . 20 Sulfur 32 S 100 95 33 S . 78 34 S 4. 40 Chlorine 35 Cl 100 75. 77 37 Cl 32. 5 24. 23 Bromine 79 Br 100 50. 69 81 Br 98. 0 49. 31 Fluorine 19 F 100 Iodine 127 I 100 Element

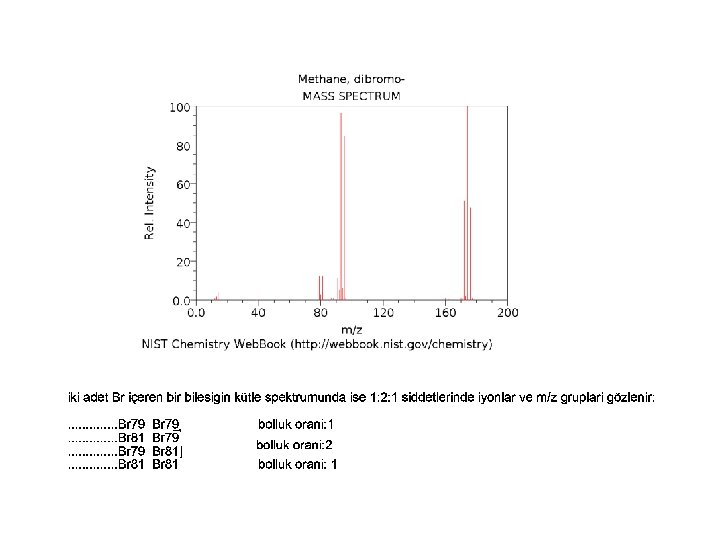
Methyl Bromide: An example of how isotopes can aid in peak identification. The ratio of peaks containing 79 Br and its isotope 81 Br (100/98) confirms the presence of bromine in the compound
 m/z=93 (95) m/z=121(123) m/z=57 (59) m/z=121(123) 1 -Bromopropane C 3 H 7")
m/z=150 (152) m/z=93 (95) m/z=121(123) m/z=57 (59) m/z=121(123) 1 -Bromopropane C 3 H 7 Br MW = 123. 00 Note the isotope pattern at 122 and 124 that represent the M amd M+2 in a 1: 1 ratio. Loss of 79 Br from 122 or 81 Br from 124 gives the base peak a m/z = 43, corresponding to the propyl cation. Note that other peaks, such as those at m/z = 107 and 109 still contain Br and therefore also show the 1: 1 isotope pattern.

The first MS is of 2 -chloropropane. Note the isotope pattern at 78 and 80 that represent the M amd M+2 in a 3: 1 ratio. Loss of 35 Cl from 78 or 37 Cl from 80 gives the base peak a m/z = 43, corresponding to the secondary propyl cation. Note that the peaks at m/z = 63 and 65 still contain Cl and therefore also show the 3: 1 isotope pattern.

Sülfürlü Bilesiğin Kütle Spektrumu
")
tropilyum katyonu (m/z=91)

An array of ionization methods and mass analyzers are available to meet the needs of many types of chemical analysis. A few are listed here with a highlight of their usefulness. Sample introduction/ionization method: Ionization method Typical Analytes Sample Introduction Mass Range Method Highlights Hard method versatile provides structure info Electron Impact (EI) Relatively small , neutral, volatile organic molecules GC or liquid/solid probe to 1, 000 Daltons Chemical Ionization (CI) Relatively small volatile GC or liquid/solid probe to 1, 000 Daltons Soft method molecular ion peak [M+H]+ Electrospray (ESI) Peptides Proteins nonvolatile Liquid Chromatography or syringe to 200, 000 Daltons Soft method ions often multiply charged Fast Atom Bombardment (FAB) Carbohydrates Organometallics Peptides nonvolatile Sample mixed in viscous matrix to 6, 000 Daltons Soft method but harder than ESI or MALDI Matrix Assisted Laser Desorption (MALDI) Peptides Proteins Nucleotides nonvolatile Sample mixed in solid matrix to 500, 000 Daltons Soft method very high mass
 Elektron Impact İyonizasyon (EI) : Isıtılan bir fİlamentden")
İYON KAYNAKLARI : (Uçucu bileşikler için) Elektron Impact İyonizasyon (EI) : Isıtılan bir fİlamentden oluşan elektronlar bir elektrik alandan geçirilip hızlandırılırlar ve sonra molekül üzerine gönderilirler. Yüksek enerjili olan bu elektronlar molekülden elektron sökerek onu iyonize ederler. Parçalanma pikleri ağırlıklı olur. Yüksek hassasiyetli bir analizdir. Ancak numune uçuculaştırılmalıdır. Bu yüzden yüksek kaynama noktasına sahip numuneler ve termal olarak dayanıklı olmayan için uygun bir yöntem değildir. Aşırı parçalanma ürünlerinin oluşu MA pikini perdeleyebilir. “sert” iyonizasyon tekniğidir, 10 -5 torr yüksek vakum altında çalışılır. GC-MS bağlantılı sistemlerde kullanımı oldukça yaygındır.
: Elektron iyonizasyondan daha “yumuşak” bir")
İYON KAYNAKLARI : Uçucu bileşikler için: Kimyasal İyonizasyon (CI): Elektron iyonizasyondan daha “yumuşak” bir iyonizasyon tekniğidir; fragman sayısı daha azdır. Molekül ağırlığı ağırlıklı görülür. Gaz fazındaki numune molekülleri başka iyonlarla çarpıştıklarında da iyonlaşabilirler. Gaz olarak genellikle metan, propan, izobütan veya amonyak kullanılır. Spektrum M+1 ve M-1 moleküler iyon piklerini içerir.
 elektron iyonizasyon (EI), ve (b)(izobütan reaktifi ile kimyasal iyonizasyon (CI) kütle spektrumları")
Efedrinin, (a) elektron iyonizasyon (EI), ve (b)(izobütan reaktifi ile kimyasal iyonizasyon (CI) kütle spektrumları
 70 e. V EI, ve (b) metan reaktif gaz ile CI")
Aminoasit metioninin, (a) 70 e. V EI, ve (b) metan reaktif gaz ile CI kütle spektrumları
 : allowing the")
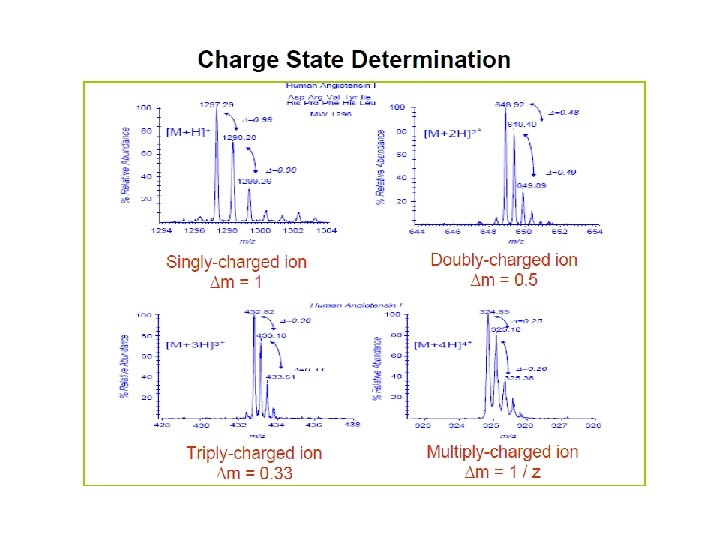
İYON KAYNAKLARI : Uçucu olmayan bileşikler için: Matrix-assisted laser desorption/ionization (MALDI) : allowing the analysis of biomolecules (biopolymers such as DNA, proteins, peptides and sugars) and large organic molecules (such as polymers, dendrimers and other macromolecules). Numune radyasyon absorblayıcı matrix ihtiva eden, su/alkol çözeltisi içinde hazırlanır. Numune matriksi metalik bir yüzey üzerine konulup kurutulur. Karışım lazer ışınlarına maruz bırakılır. Numune katyonları serbest hale geçerek karışımdan ayrılırlar. Kullanıma başlanıldığından beri molekül kütleleri 100000 akb den büyük olan biyomoleküllerin analizinde kullanım alanı bulan bir iyonlaştırma tekniğidir. Hem pozitif, hem negatif iyonlar üretir. Ayrıca +3’e kadar çok yüklü iyonlarla, dimerler, trimerler, vs meydana gelir. Ana pik ya da ana pikler sadece tek yük taşır. Fragmentation of the sample ions does not usually occur.
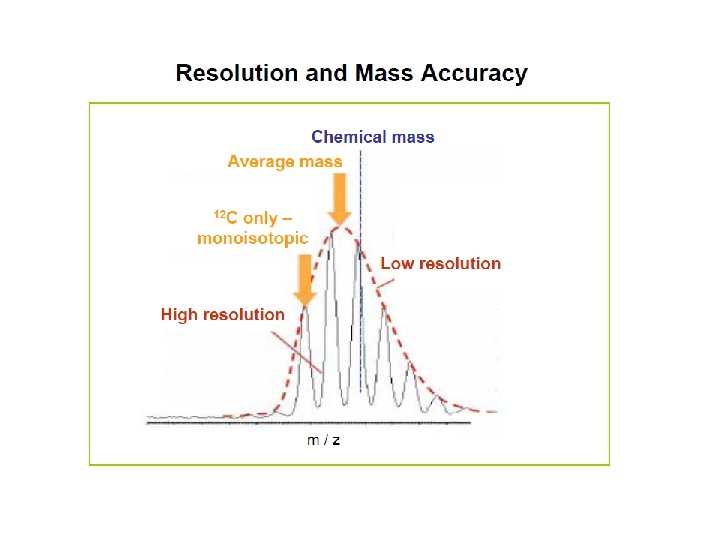
 “Monoisotopic mass” No")
Mass spectrum of peptide with 94 C-atoms (19 amino acid residues) “Monoisotopic mass” No 13 C atoms (all 12 C) 1981. 84 1982. 84 One 13 C atom 1983. 84 Two 13 C atoms

although the peaks look like individual "sticks" when shown at full scale, they are actually groups of peaks. An expanded view of the peak at ~2465 is shown in Figure 2. The group of peaks shown in Figure 2 is called an isotope distribution. This is caused by naturally occuring Carbon-13 (13 C has an abundance of approximately 1% of 12 C). As a peptide of this size contains many carbon atoms (for this particular peptide 112 carbon atoms), then the contribution from 13 C can be significant. The peak on the left is the 'monoisotopic' peak, and only contains 12 C. The next contains one 13 C (and thus has a mass of 1 Da greater). The next has two 13 C (and thus has a mass of 2 Da greater than the monoisotopic peak) etc.

Commonly used MALDI Matrices:

The mass spectrum shows the results MALDI TOF spectrum of Ig. G MH+ Relative Abundance 40000 30000 (M+2 H)2+ 20000 10000 (M+3 H)3+ 0 50000 100000 Mass (m/z) 150000 200000

Mass spectrum of insulin 2 x 13 C 12 C : 5730. 61 Insulin has 257 C-atoms. Above this mass, the monoisotopic peak is too small to be very useful, and the average mass is usually used.
: • Use for")
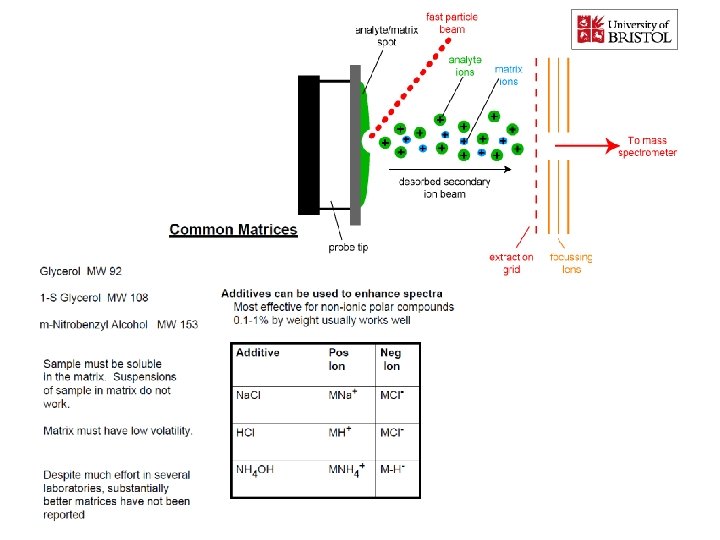
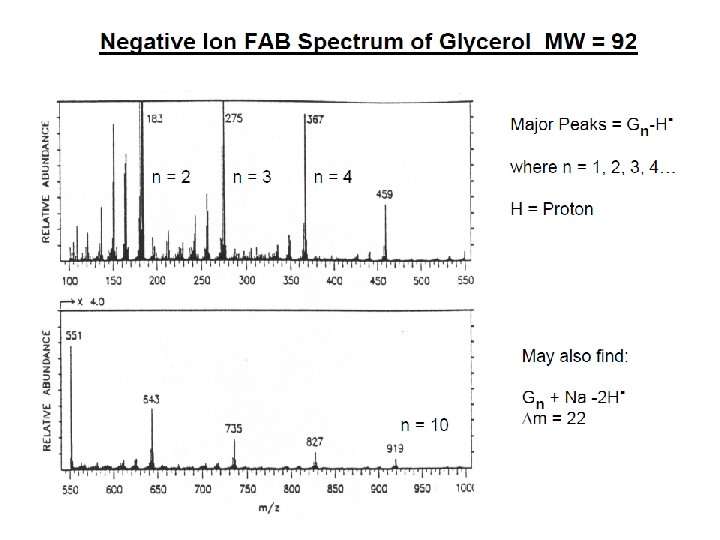
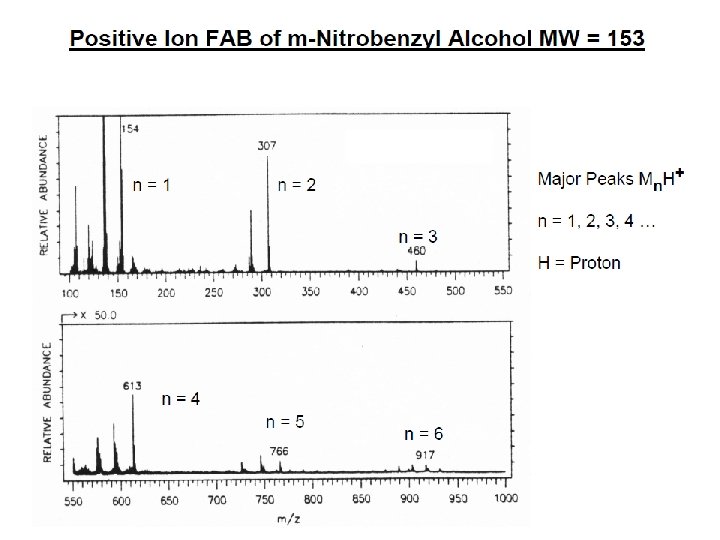
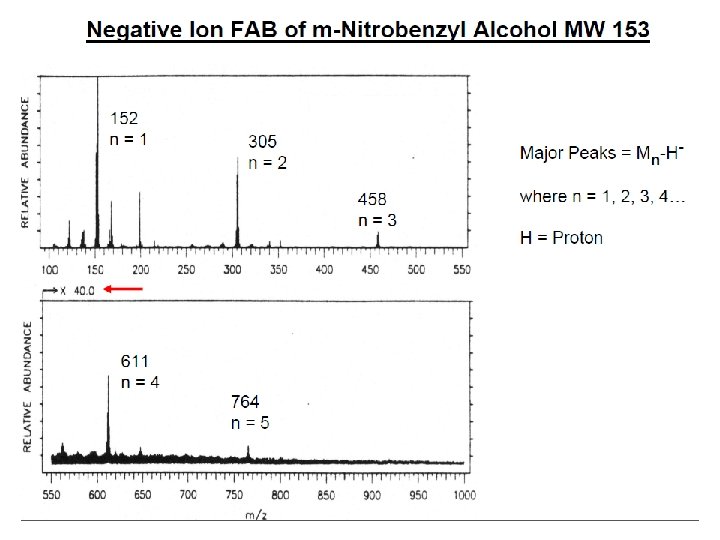
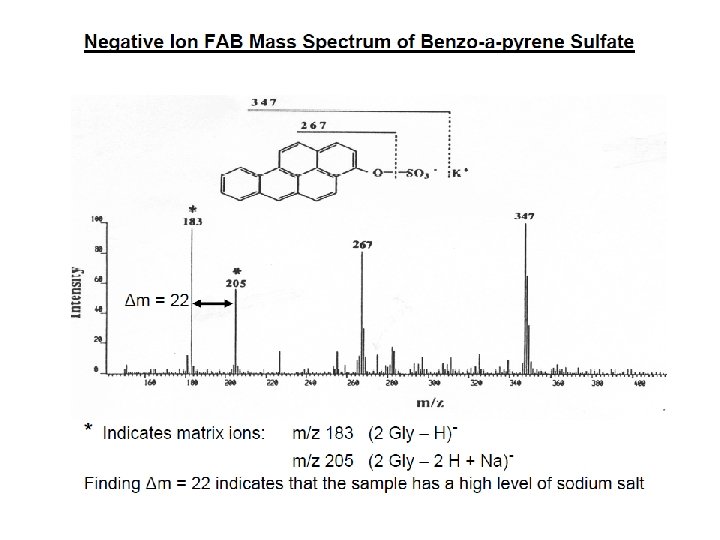
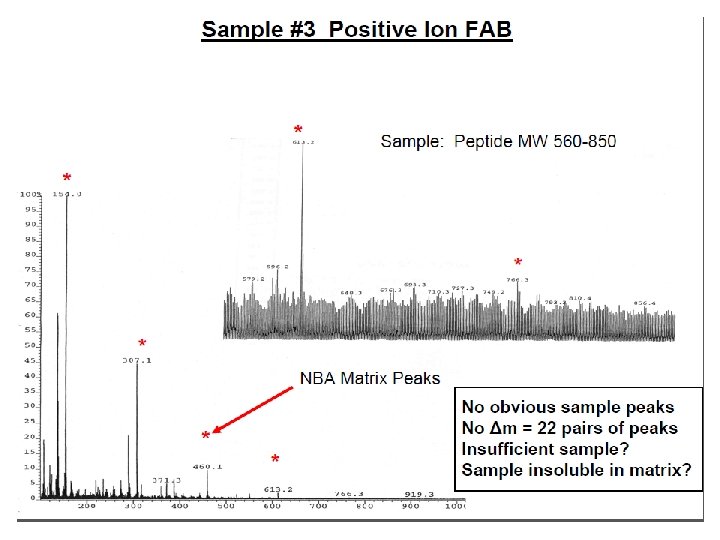
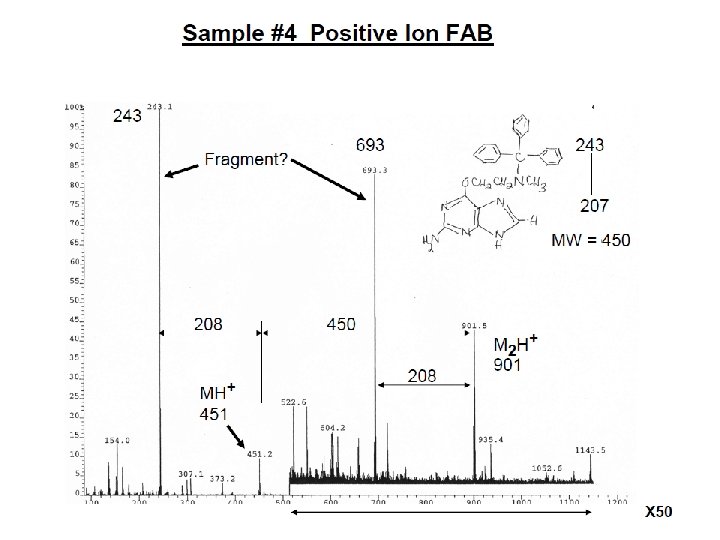
İYON KAYNAKLARI : Uçucu olmayan bileşikler için: Hızlı Atom Bombardımanı (FAB): • Use for compounds with MW less than <1500 (with low volatility ) • Peptides, drugs, natural products, pollutants, metalorganics (polar biomolecules and natural products) polar, ionic, thermally labile, energetically labile, and high molecular weight compounds. • Samples should be easily charged in solution. Acids, bases, highly polar compounds. • Samples must be soluble in a non-volatile liquid matrix such as glycerol, crown ethers, nitrobenzyl alcohol. • Use with solids probe. • Immobilised matrix is bombarded with a fast beam of Argon or Xenon atoms. • Samples should be relatively pure and free of additional salts, buffers, etc. • Often used to confirm MW of compounds analyzed by EI or CI. • May give some fragments; • No heating required; Sample directly from solution. • The resulting spectra consist largely of intact molecular species (e. g. [M+H]+ and [M+Na]+) with some minor structural fragmentation. • Yapısal parçalanma çok azdır.


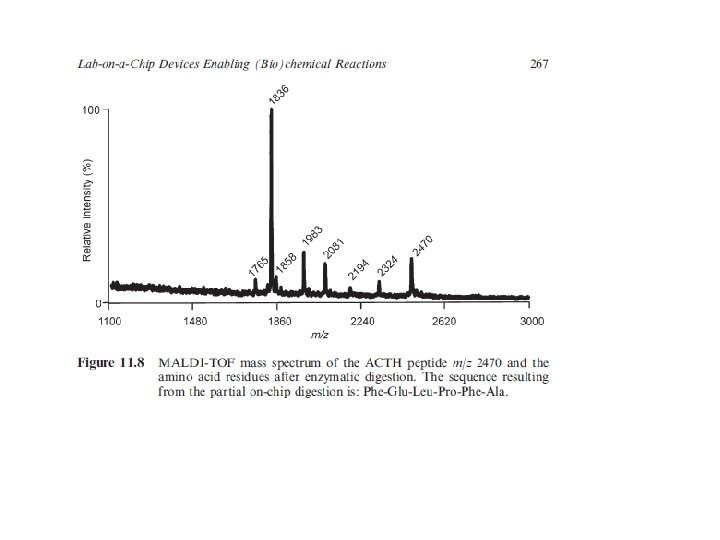
E=Glu G=Gly S=Ser F=Phe N=Asn P=Pro V=Val A=Ala R=Arg Peptide Fragmentation => E G S F F G E E N P N V A R 175. 10 246. 14 345. 21 459. 25 556. 30 670. 35 799. 39 928. 43 985. 45 1132. 52 1279. 59 1366. 62 1423. 64 1552. 69 = = =
- Slides: 61