Markov Random Fields Graph Cuts Belief Propagation Computational

Markov Random Fields, Graph Cuts, Belief Propagation Computational Photography Connelly Barnes Slides from Bill Freeman
![Stereo Correspondence Problem L R Squared difference, (L[x] – R[x-d])^2, for some x. d](http://slidetodoc.com/presentation_image/186560b1159799df00d17fe3e24d6a80/image-2.jpg "Stereo Correspondence Problem L R Squared difference, (L[x] – R[x-d])^2, for some x. d")
Stereo Correspondence Problem L R Squared difference, (L[x] – R[x-d])^2, for some x. d x d Showing local disparity evidence vectors for a set of neighboring positions, x.

Super-resolution image synthesis How to choose which selection of high resolution patches best fits together? Ignoring which patch fits well with which gives this result for the high frequency components of an image:

Things we want to be able to articulate in a spatial prior • Favor neighboring pixels having the same state (state, meaning: estimated depth, stereo disparity, group segment membership) • Favor neighboring nodes have compatible states (a patch at node i should fit well with selected patch at node j). • But encourage state changes to occur at certain places (like regions of high image gradient).

Graphical models: tinker toys to build complex probability distributions • Circles represent random variables. • Lines represent statistical dependencies. • There is a corresponding equation that gives P(x 1, x 2, x 3, y, z), but often it’s easier to understand things from the picture. • These tinker toys for probabilities let you build up, from simple, easy-to-understand pieces, complicated probability distributions involving many variables. x 1 x 2 y z x 3 http: //mark. michaelis. net/weblog/2002/12/29/Tinker%20 Toys%20 Car. jpg

Steps in building and using graphical models • First, define the function you want to optimize. Note the two common ways of framing the problem – In terms of probabilities. Multiply together component terms, which typically involve exponentials. – In terms of energies. The log of the probabilities. Typically add together the exponentiated terms from above. • The second step: optimize that function. For probabilities, take the mean or the max (or use some other “loss function”). For energies, take the min. • 3 rd step: in many cases, you want to learn the function from the 1 st step.

Define model parameters
")
A more general compatibility matrix (values shown as grey scale)

One type of graphical model: Markov Random Fields • Allows rich probabilistic models for images. • But built in a local, modular way. Learn local relationships, get global effects out. “Observed” variables, e. g. pixel intensity “Hidden” variables, e. g. depth at each pixel

MRF nodes as pixels Winkler, 1995, p. 32
 image Y(xi, xj) scene")
MRF nodes as patches image patches scene patches F(xi, yi) image Y(xi, xj) scene
 = Z scene image ÕY(")
Network joint probability 1 P ( x, y ) = Z scene image ÕY( x , x ) ÕF( x , y ) i i, j j i i i Scene-scene Image-scene compatibility function neighboring local scene nodes observations

In order to use MRFs: • Given observations y, and the parameters of the MRF, how infer the hidden variables, x? • How to learn the parameters of the MRF?
 –")
Outline of MRF section • Inference in MRF’s. – Iterated conditional modes (ICM) – Gibbs sampling, simulated annealing – Belief propagation – Graph cuts • Applications of inference in MRF’s.
 • For each node: –")
Iterated conditional modes • Initialize nodes (e. g. random) • For each node: – Condition on all the neighbors – Find the mode – Repeat. Described in: Winkler, 1995. Introduced by Besag in 1986.

Winkler, 1995
 –")
Outline of MRF section • Inference in MRF’s. – Iterated conditional modes (ICM) – Gibbs sampling, simulated annealing – Belief propagation – Graph cuts • Applications of inference in MRF’s.

Gibbs Sampling and Simulated Annealing • Gibbs sampling: – A way to generate random samples from a (potentially very complicated) probability distribution. • Simulated annealing: – A schedule for modifying the probability distribution so that, at “zero temperature”, you draw samples only from the MAP solution. Reference: Geman and Geman, IEEE PAMI 1984.

Simulated Annealing Visualization https: //en. wikipedia. org/wiki/Simulated_annealing

Gibbs Sampling x 2 Slide by Ce Liu x 1

Gibbs sampling and simulated annealing Simulated annealing as you gradually lower the “temperature” of the probability distribution ultimately giving zero probability to all but the MAP estimate. What’s good about it: finds global MAP solution. What’s bad about it: takes forever. Gibbs sampling is in the inner loop…
 of")
Gibbs sampling and simulated annealing You can find the mean value (MMSE estimate) of a variable by doing Gibbs sampling and averaging over the values that come out of your sampler. You can find the MAP value of a variable by doing Gibbs sampling and gradually lowering the temperature parameter to zero.
 –")
Outline of MRF section • Inference in MRF’s. – Iterated conditional modes (ICM) – Gibbs sampling, simulated annealing – Belief propagation – Graph cuts • Applications of inference in MRF’s.

Derivation of belief propagation y 1 y 2 y 3 “Observed variables”, e. g. image intensity x 1 x 2 x 3 “Hidden variables”, e. g. depth in scene Goal: Compute marginal probabilities of x 1 (probabilities of x 1 alone, given the observed variables) From these, compute MMSE, Minimum Mean Squared Error estimator of x 1, which is just E(x 1 | observed variables) BP Tutorial: http: //graphics. tu-bs. de/static/teaching/seminars/ss 13/CG/papers/Klose 02. pdf

Derivation of belief propagation y 1 y 2 y 3 x 1 x 2 x 3

The posterior factorizes y 1 y 2 y 3 x 1 x 2 x 3

Propagation rules y 1 y 2 y 3 x 1 x 2 x 3

Propagation rules y 1 y 2 y 3 x 1 x 2 x 3

Propagation rules y 1 y 2 y 3 x 1 x 2 x 3

Belief propagation: the nosey neighbor rule “Given everything that I know, here’s what I think you should think” (Given the probabilities of my being in different states, and how my states relate to your states, here’s what I think the probabilities of your states should be)

Belief propagation messages A message: can be thought of as a set of weights on each of your possible states To send a message: Multiply together all the incoming messages, except from the node you’re sending to, then multiply by the compatibility matrix and marginalize over the sender’s states. i j = i j

Beliefs To find a node’s beliefs: Multiply together all the messages coming in to that node. j

Simple BP example y 1 y 3 x 1 x 2 x 3

Simple BP example x 1 x 2 x 3 To find the marginal probability for each variable, you can (a) Marginalize out the other variables of: (b) Or you can run belief propagation, (BP). BP redistributes the various partial sums, leading to a very efficient calculation.

Belief, and message updates j i = i j

Optimal solution in a chain or tree: Belief Propagation • “Do the right thing” Bayesian algorithm. • For Gaussian random variables over time: Kalman filter. • For hidden Markov models: forward/backward algorithm (and MAP variant is Viterbi).
 y 2")
No factorization with loops! Y ( x 1 , x 3 ) y 2 y 1 x 2 y 3 x 3

Justification for running belief propagation in networks with loops • Experimental results: – Error-correcting codes Kschischang and Frey, 1998; Mc. Eliece et al. , 1998 – Vision applications Freeman and Pasztor, 1999; Frey, 2000 • Theoretical results: – For Gaussian processes, means are correct. Weiss and Freeman, 1999 – Large neighborhood local maximum for MAP. Weiss and Freeman, 2000 – Equivalent to Bethe approx. in statistical physics. Yedidia, Freeman, and Weiss, 2000 – Tree-weighted reparameterization Wainwright, Willsky, Jaakkola, 2001
 –")
Outline of MRF section • Inference in MRF’s. – Iterated conditional modes (ICM) – Gibbs sampling, simulated annealing – Belief propagation – Graph cuts • Applications of inference in MRF’s.

Graph cuts • Algorithm: uses node label swaps or expansions as moves in the algorithm to reduce the energy. Swaps many labels at once, not just one at a time, as with ICM. • Find which pixel labels to swap using min cut/max flow algorithms from network theory. • Can offer bounds on optimality. • Paper: Boykov, Veksler, Zabih, IEEE PAMI 2001

Graph cuts

Graph cuts
 • Graph Cuts: – http: //www. csd. uwo. ca/~olga/code. html •")
Source codes (MATLAB) • Graph Cuts: – http: //www. csd. uwo. ca/~olga/code. html • Belief Propagation: – http: //www. di. ens. fr/~mschmidt/Software/UGM. html

Outline of MRF section • Inference in MRF’s. – Gibbs sampling, simulated annealing – Iterated condtional modes (ICM) – Belief propagation – Graph cuts • Applications of inference in MRF’s.

Applications of MRF’s • • • Stereo Motion estimation Labelling shading and reflectance Matting Texture synthesis Many more…

Applications of MRF’s • • • Stereo Motion estimation Labelling shading and reflectance Matting Texture synthesis Many others…

Motion application image patches image scene patches scene

What behavior should we see in a motion algorithm? • Aperture problem • Resolution through propagation of information • Figure/ground discrimination

Aperture Problem • https: //en. wikipedia. org/wiki/Motion_perce ption#The_aperture_problem

Motion analysis: related work • Markov network – Luettgen, Karl, Willsky and collaborators. • Neural network or learning-based – Nowlan & T. J. Senjowski; Sereno. • Optical flow analysis – Weiss & Adelson; Darrell & Pentland; Ju, Black & Jepson; Simoncelli; Grzywacz & Yuille; Hildreth; Horn & Schunk; etc.
 Image data Iterations 0")
Inference: Motion estimation results (maxima of scene probability distributions displayed) Image data Iterations 0 and 1 Initial guesses only show motion at edges.
 Iterations 2 and 3 Figure/ground")
Motion estimation results (maxima of scene probability distributions displayed) Iterations 2 and 3 Figure/ground still unresolved here.
 Iterations 4 and 5 Final")
Motion estimation results (maxima of scene probability distributions displayed) Iterations 4 and 5 Final result compares well with vector quantized true (uniform) velocities.

Vision applications of MRF’s • • • Stereo Motion estimation Labelling shading and reflectance Matting Texture synthesis Many others…
 Shading Image The")
Forming an Image Illuminate the surface to get: Surface (Height Map) Shading Image The shading image is the interaction of the shape of the surface, the material, and the illumination

Painting the Surface Scene Image Add a reflectance pattern to the surface. Points inside the squares should reflect less light

Goal Image Shading Image Reflectance Image

Basic Steps 1. Compute the x and y image derivatives 2. Classify each derivative as being caused by either shading or a reflectance change 3. Set derivatives with the wrong label to zero. 4. Recover the intrinsic images by finding the leastsquares solution of the derivatives. Original x derivative image Classify each derivative (White is reflectance)

Learning the Classifiers • Combine multiple classifiers into a strong classifier using Ada. Boost (Freund and Schapire) • Choose weak classifiers greedily similar to (Tieu and Viola 2000) • Train on synthetic images • Assume the light direction is from the right Shading Training Set Reflectance Change Training Set

Using Both Color and Gray-Scale Information Results without considering gray-scale

Some Areas of the Image Are Locally Ambiguous Is the change here better explained as Input ? or Shading Reflectance

Propagating Information • Can disambiguate areas by propagating information from reliable areas of the image into ambiguous areas of the image

Propagating Information • Consider relationship between neighboring derivatives • Use Generalized Belief Propagation to infer labels

Setting Compatibilities • Set compatibilities according to image contours – All derivatives along a contour should have the same label • Derivatives along an image contour strongly influence each other β= 0. 5 1. 0

Improvements Using Propagation Input Image Reflectance Image Without Propagation Reflectance Image With Propagation
 Input Image Shading Image Reflectance Image")
(More Results) Input Image Shading Image Reflectance Image

Vision applications of MRF’s • • • Stereo Motion estimation Labelling shading and reflectance Matting Texture synthesis Many others…

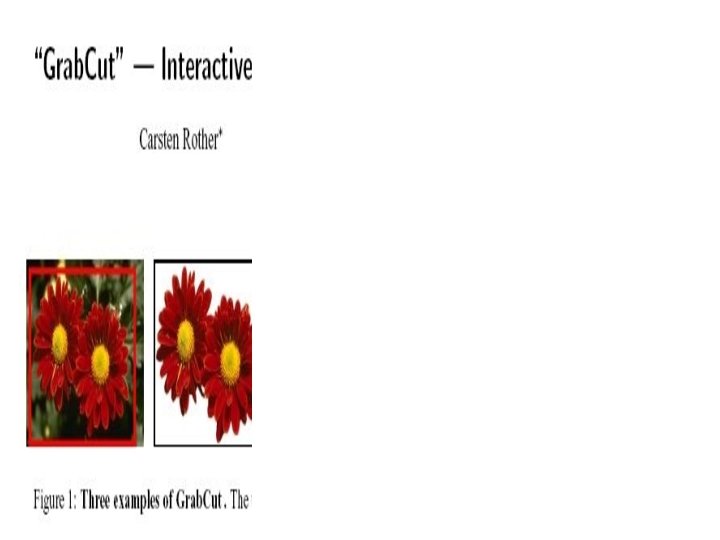
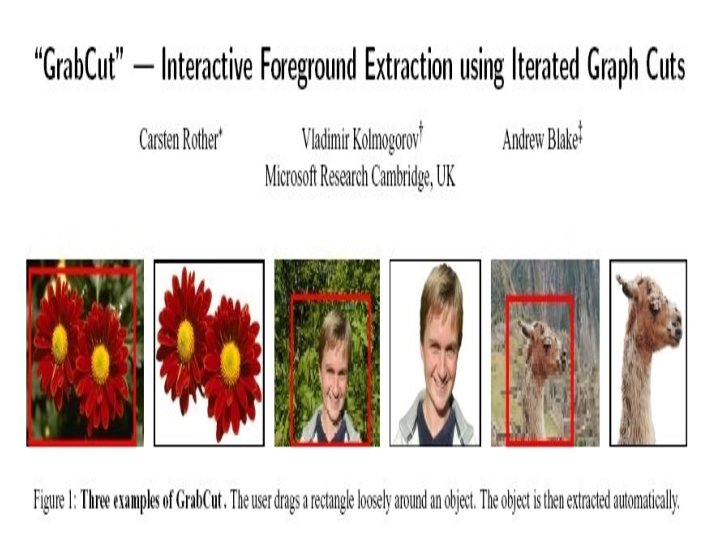
Grab. Cut http: //research. microsoft. com/vision/Cambridge/papers/siggraph 04. pdf

Graphical models other than MRF grids • For a nice on-line tutorial about Bayes nets, see Kevin Murphy’s tutorial in his web page.
- Slides: 72