Markets Bringing Demand Supply Together What is a

Markets - Bringing Demand Supply Together -

What is a Market ? • In economic theory, a market is where buyers and sellers of goods and services (or resources) are come together to carry out an exchange/transaction. • In addition to the physical places, markets also includes non-physical places where buyers and sellers can come together through – Internet/online, phone, fax, etc. • Markets can be local (buyers and sellers in the local region e. g. local grocery), national (within the country), and international (anywhere in the world e. g. oil) • types: – Goods and services (product markets) – Resources (factor markets eg labor market) – Financial markets where international currencies, securities and stocks (ownership of companies) are bought and sold • and underlying all markets is the concept of Demand Supply

 market price and quantity demanded and")
Market Mechanism • How is the final (actual) market price and quantity demanded and supplied determined? • This is through the interaction, negotiation, bargaining between the demand supply of the good and services • Assume the objective/goal of the consumers and producers – Maximize utility given their limited income – Maximize profit given the cost of production – there is a clash of interest!

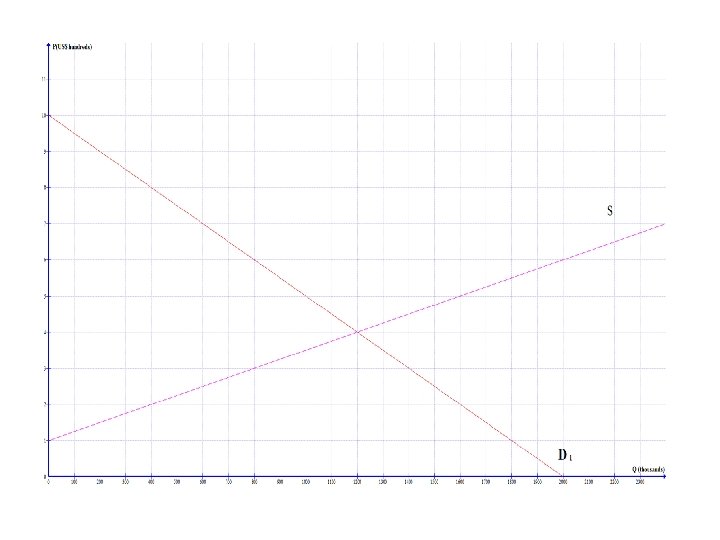
Interaction process… Disequilibrium situations • Suppose market price is initially at $5 (next slide or graoh on handout Page 3) Excess Supply (surplus) of 600 units Qd < Qs stocks of unsold goods pile up discounts P will go down and as it falls Qd increases while Qs falls _______________________ Or if P= $2 Excess Demand (shortage) of 1200 thousand units Qd > Qs “empty shelves” and “queues” P moves up and as it increases Qd falls while Qs rises equilibrium Notice that as Price changes there is a MOVEMENT

 Qd = Qs •")
Equilibrium • Definition: occurs when the market “clears” • 1) Qd = Qs • 2) No excess demand or excess supply • 3) All plans are fulfilled • consequently • 4) If in equilibrium, ……………. • 5) If in disequilibrium, will …………. • Though may take time through a COBWEB
 • Need to be able to find")
Graphing the equilibrium (Page 3 of H/0) • Need to be able to find the equilibrium • a) graphically b) algebraically • How much do consumers spend? • How much REVENUE do producers earn? .

Consumer Surplus • Consumer surplus is defined as • ……. the highest price the consumers are willing to pay for a good minus the price actually paid. • It represents the difference between total benefits (satisfaction or utility) consumers receive from buying a good and the price paid to receive them • It is the bargain and gain you get through buying an item you wanted but for a price lower than you were willing to pay!

Graphically, • Consumer surplus is indicated by the area between the demand curve (your marginal benefit and utility) and the market price for the units of goods consumed

Producer Surplus • Producer surplus is defined as the price received by firms minus the lowest price that they are willing to accept to produce the good. • It is the excess earnings producers receive from given quantity of output, over and above the (minimum) amount they were prepared to accept • It is the “profit”, return, and $$$ that they wanted!

Graphically, • It is the area above the firms’ supply curve and below the price received by firms (determined by the market)
 surplus • What can you say about")
consumer and producer surplus together= community (social) surplus • What can you say about the CS and PS at the market equilibrium? • Suppose P = P 3 instead? Pages 7 and 8 of H/O
 SURPLUS • = consumer surplus + producer surplus • It is")
COMMUNITY (social) SURPLUS • = consumer surplus + producer surplus • It is often referred to as the social welfare or well being of society. • Where is it maximized? • CALCULATE on graph (can ignore units) • concept of WELFARE LOSS • (or DEADWEIGHT LOSS)

So to sum, • The final decision on how to • allocate our scarce resources efficiently • can be evaluated through looking at the satisfaction or welfare of the people running this economy (market) consumers and producers – Consumer surplus – Producer surplus
 surplus is MAXIMIZED at the EQUILIBRIUM, which is therefore the OPTIMUM")
The Social (community) surplus is MAXIMIZED at the EQUILIBRIUM, which is therefore the OPTIMUM
 • Allocative efficiency refers to producing the combination of")
Allocative Efficiency ( Pareto Optimality) • Allocative efficiency refers to producing the combination of the goods mostly wanted by society. • It is THE allocation of scarce resources that “best” satisfies the unlimited wants…it is the “optimal” choice made for the society given their scarce resources • And the finding above shows that free and perfectly competitive markets can achieve Allocative Efficiency at the equilibrium

Explanation • The demand curve represents the interests of the consumers while the supply curve represents the interests of the producers • We can assume that D = MU/MB (marginal utility/benefit) while S = MC (marginal cost) • Then we can (re)interpret the market equilibrium as a point where MB = MC • This equality tells us that the extra benefit to society of getting one more unit of the good is equal to the extra cost to society of producing one more unit of the good… this implies that the society’s scarce resources are being used to produce the “right” quantity two interests in balance, equilibrium • That is, society has allocated the “right” amount of resources to the production of the good and producing the quantity of the good that is mostly wanted by the society

To understand this better, • Consider that if MB > MC, then society would be placing a greater value on the last unit of the good produced than it costs to produce it and so more of it should be produced (disequilibrium of excess D) • Consider that if MB < MC, then it would be costing society more to produce the last unit of the good produced than the value society puts on it, so less should be produced (disequilibrium of excess S) • Thus allocation where MB = MC is the optimum for society
")
Suppose disequilibrium due to shift in…. . Demand - Income (normal and inferior good) - Taste and Preferences - Price of related goods (substitutes and complements) - Population size - Age structure - Government policy - Seasonal change - these things are constantly changing in the real world Supply - Factors of production and cost - Technology - Price of related goods (competitive and joint supply) - Producer expectation - Government policies - Number of firms - Shocks and natural disasters

Δ in market equilibrium due to a shift in D or S • Shift in Demand to the right (e. g. due to………. ) • excess demand= • ………. . pressure on prices • incentive for producers to increase Qs • And signal to consumers to decrease Qd • The price rise also RATIONS the good to consumers willing to pay the higher prices • +examples on pages 4 -6

What happens to the market equilibrium when there is a shift in D or S? • Case 2: Shift in Supply to the right • (e. g. new technology or more resources found)
 ( • Act as • SIGNALS…. . prices communicate information")
PRICES (the PRICE MECHANISM) ( • Act as • SIGNALS…. . prices communicate information to the decision makers. • INCENTIVES. . . . prices motivate decision makers (who want utility or profits) to respond to the information • In order to reallocate resources and RATION scarce resources • In other words act as an INVISIBLE HAND • ALLOCATIVE EFFICIENCY

• The process is called the Market Mechanism and/or the Price Mechanism – Introduced and founded by the Father of Economics called Adam Smith • What is the significance or essence of this?

Market Mechanism and Price Mechanism • The what to produce question of resource allocation is answered because firms produce only those goods consumers are willing and able to buy, while consumers buy only those goods producers are willing and able to supply power to the people! (Consumer Sovereignty) • The how to produce question of resource allocation is answered because firms use those resources and technologies they are willing and able to pay for (in the resource market) • But what about the third question…… • does allocative efficiency= equity?
 “best” answers the fundamental economic")
In other words… • So free (and competitive market) “best” answers the fundamental economic questions of: – What to produce – allocative efficiency refers to producing what the consumers mostly want – How to produce – productive efficiency means producing with the fewest possible resources • BUT it falls short and fails to answer – For whom to produce – only the most efficient and productive (or competitive) individuals benefit, equity or fairness is not ensured – This leads and justifies the need of governments

Adam Smith stated…. that the invisible hand working through the market mechanism and prices succeeds in coordinating the buying and selling decisions of thousands and millions of individuals without any central authority (government). At the equilibrium, the buying and selling choices of all buyers and sellers are satisfied and in balance THE END
 • Do Section (e) of Page 3 of H/O")
Calculating the Market Equilibrium (Review) • Do Section (e) of Page 3 of H/O • Using the demand supply functions for the chocolate bars: Qd = 14 – 2 P Qs = 2 + 2 P • Market equilibrium price and quantity are values where • Qd = Qs • Therefore, the equilibrium price is $3 and equilibrium quantity is 8, 000 chocolate bars – You can check your calculation by inserting P = 3 into the demand or supply equations and see whether you obtain Qd = Qs = 8
- Slides: 29