MARKET EFFICIENCY THREE FORMS Weak form random walk


- Slides: 22
MARKET EFFICIENCY - THREE FORMS Weak form - random walk • past prices hold no information about future prices • can't beat buy/hold strategy • much evidence to support including correlation tests, filter test - fail Semi-strong form • all publicly available information is immediately reflected in price.
SEMI-STRONG FORM • subsumes weak form since price data is publicly available • assumes rational investors seek information impound quickly. • result - prices may rise or fall with few trades - few chances to make money • quite a bit of information such as stock split and earnings information are impounded quickly. EXAMPLE: Yield curve misalignment in US. Treasury market - takes 15 seconds to correct.
STRONG FORM • all relevant information reflected in stock prices due to insiders, specialists • evidence shows announcements of important information often anticipated beforehand. • implies outside investors should buy and hold market.
MARKET EFFICIENCY - PROPERTIES • Market is not always correct - just unbiased and usually close to correct • Price changes are independent and random - prices adjust rapidly to new information • Much available information • Liquidity - price continuity - SEC & Fed watches • Low transaction costs
IMPLICATIONS OF MARKET EFFICIENCY Investors should • define risk level • hold a diversified portfolio that is a combination of the market portfolio and risk free assets • minimize trading transaction costs Example: May 27, 1968, submarine USS Scorpion declared missing with 99 men within a 20 mile circle of Atlantic ocean. After 5 months searching, it could not be found. Navy scientist, John Craven found the sub after asking 30 submarine salvage experts to guess where it was based on the data available. They found the sub 220 yards away from the average guess (no one survived). Do Bean Jar – if too many students – assume 50 above and 50 below true value as the range where the average guess falls. Ask them to raise hands – who thinks below X, who thinks above Y
THREE FACTORS MAKE IT DIFFICULT TO TELL WHETHER THE MARKET IS EFFICIENT • Market variance is so large, superior investment performance must be very large before it is statistically significant. • Selection bias - those with profitable investment rules do not reveal them, hence, we can't be sure that some managers are profitable. – Note Broker’s Trick. • Luck - by chance some will have superior performance. QUESTION: Some stocks have very high returns and others very low returns even after adjustment for risk. Is this evidence of market inefficiency? No, because some firms may do surprisingly well for some periods.
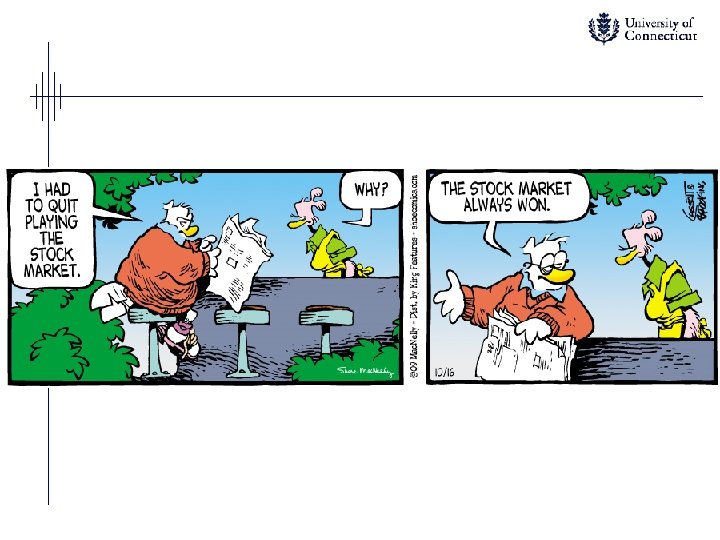
TECHNICAL ANALYSIS • Fundamental analysis - what we've done up to now - economy, industry, company information. • Technical analysis - use past price and trading volume to predict future price. • Technical Analysis is popular, perhaps because it is very visual and intuitive - analysts use charts
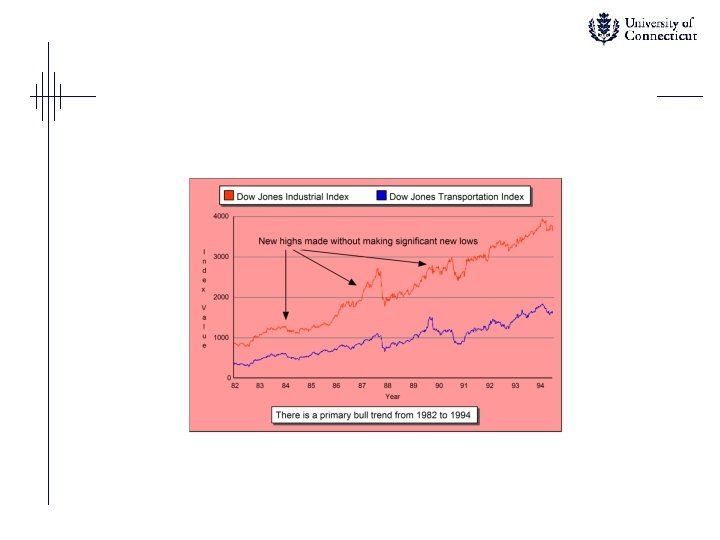
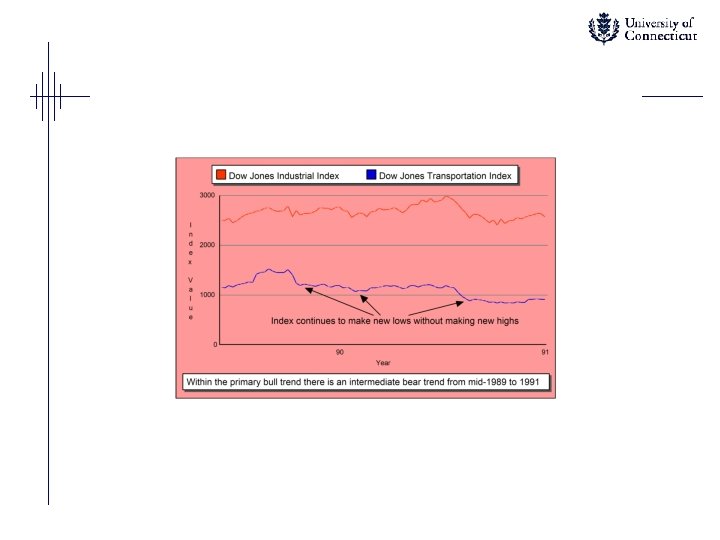
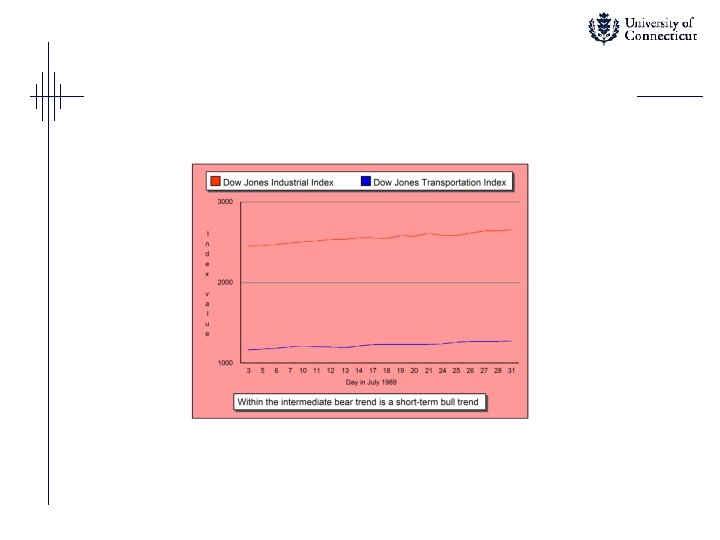
DOW THEORY - BEST KNOWN TECHNICAL THEORY • THREE TIME TRENDS primary trend intermediate trend short term corrections - day to day • TWO DIRECTIONAL TRENDS bull trend - higher highs bear trend - lower lows
The Dow Transport index should make similar movements to the dow industrials to confirm trends. QUESTION: What is the rationale for this? Goods transported before being sold so transportation stocks move first. QUESTION: Why do fewer technical analysts rely on transport confirmation? Service sector growth
VOLUME ANALYSIS - SUPPLY/DEMAND • Large volume signals turning points followed by weak volume. • Volume goes with trend Bull market - prices up on high volume -prices down on low volume Bear market -prices up on low volume -prices down on high volume
PROBLEMS WITH DOW THEORY • Often late in identifying major trends • Not much help for short term trader - or which stocks to buy.
BASIS FOR TECHNICAL ANALYSIS • Supply-demand determine price • Both supply & demand are affected by rational and irrational factors. • Prices move in trends - trends persist because price adjustments to new information takes time
INVESTMENT ADVANTAGES OF TECHNICIANS • Aren't required to get good fundamental information and process quickly, this is difficult. • Just interpret price and volume movements to get information indirectly, don’t care about what a company does. • No need to decipher financial statements that are biased.
OTHER TECHNICAL THEORIES • Short interest - signals latent demand - not supported • Odd lot Theory - small investors trade incorrectly - not supported • New High / New Low - Bull => increase New high, decrease new low lagging, not leading indicator • Moving average - compare to actual, a momentum indicator like rate of change analysis - when actual falls below rising average - bear - when actual rises above rising average - bull • Advance / Decline (Breadth)- a reading of general market
• Mutual Fund Cash Position - latent demand - actually a concurrent indicator. • Contrary opinion - must be different to make money evidence? - only at certain times. • Call / Put ratio - usually more calls - increase in puts is bearish. • Inside Information Indicators - insider sell / buy ratio - since many companies pay in shares - expect some to sell, if none sell - bullish - buy / sell differential by NYSE members - short selling by specialists
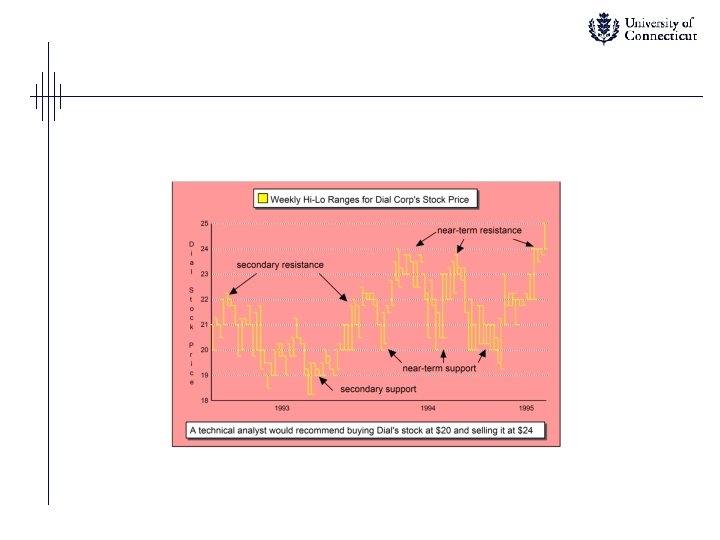
TECHNICAL ANALYSIS CAN BE APPLIED TO INDIVIDUAL STOCKS • PRICE LEVELS resistance levels support levels • PRICE FORMATIONS hard to tell one from another their use reflects individuals effort to see pattern in randomness, tests show people see patterns in random generated pictures general trends and sideways movements
Websites for Technical Analysis 1. Futuresource. com – has examples of formations and trendlines. 2. Prophetfinance. com – use Prophet Java. Charts for drawing in trendlines – interactive. 3. Stockcharts – has Market. Carpets that give a visual of how sectors are doing day-to-day.