Market and Economic Insights for GridScale Renewable Power

Market and Economic Insights for Grid-Scale Renewable Power Alexander Stickler September 11, 2019

Topics • Wind Economics • Trends in Wind Industry • Operational Performance • Mission: 40 -year turbine life • Solar Economics • Solar, Wind, and Storage

30 -year Electricity Generation Projection

How did we get here? Wind: 66% Copyright © Hatch 2016. All Rights Reserved. Solar: 85%

Levelized Cost of Electricity, 2017 5 Source: Lazard, 2017

Wind

Wind Cost Projections

66% of Wind Cap. EX is the WTG

OPEX - ranges • Hatch Database - $71/k. W/year • Average farm in Canadian database – 29 turbines, 54 MW (1. 8 MW machines) • Larger farms, machines should see some reductions from this level • Our own models suggest that new projects will have to achieve OPEX below $45/k. W/year to get to the recently awarded (Alberta, Sask) PPA prices… • EDPR Annual Reporting - $77/k. W/year (converted to CAD) • 4. 6 GW of US Projects • Breakdown: 61% supplies and services, 20% personnel, 19% taxes, leases, rents • NREL 2017 Cost of Wind Energy Review - $37 -93/k. W/year (converted to CAD)

How to Improve Wind Cost Further? Often a trade-off here The biggest industry topics right now

Mission: 40 -year project life ‒Analytical ‒RUL Calculation Analytical ‒Practical ‒Increased Inspection ‒Proactive Maintenance ‒Data-driven ‒Condition Monitoring ‒Predictive Analytics ‒“Big Data” 12 Practical Data-Driven

Analytical approach to RUL • Load cycles and S-N curves • • Focus on large, high energy components Large - proxy for ‘expensive’ High energy safety What: • Major mechanical components • HV electrical components • Foundation, tower bolts • Caveat – inexpensive components with long lead times 13 create costly downtime • If you REALLY want to be sure, you need to do this. (And at some point, you should REALLY want to be sure)

Practical approach In the field: • Increased Inspection Frequency • Preventative maintenance • Blade maintenance program 14

Data-driven approach • What does history tell us about the future? Actual loading vs. design loading RUL Turbine performance Costs, types, and frequency of failures Looking to predict the future costs (accelerating vs. flat costs vs. lumpy) • What can we learn from: owner’s other assets, similar platforms, comparable region • • • Must use the data to predict maintenance needs before a failure 15

Solar

Solar is an economy of scale and efficiency

Solar Module Efficiency Progression 2006 -2018 ~25% efficiency gain in 12 years

Solar Cost Drivers & Trends • Higher module efficiency • Bifacial modules capture ground reflection (10 -30% gain) • Shingled modules aka “seamless” (5% greater power density) • Optimized structural design • 600 V 1000 V 1500 V systems • Streamlined permitting, development costs • Inverters also dropping in price

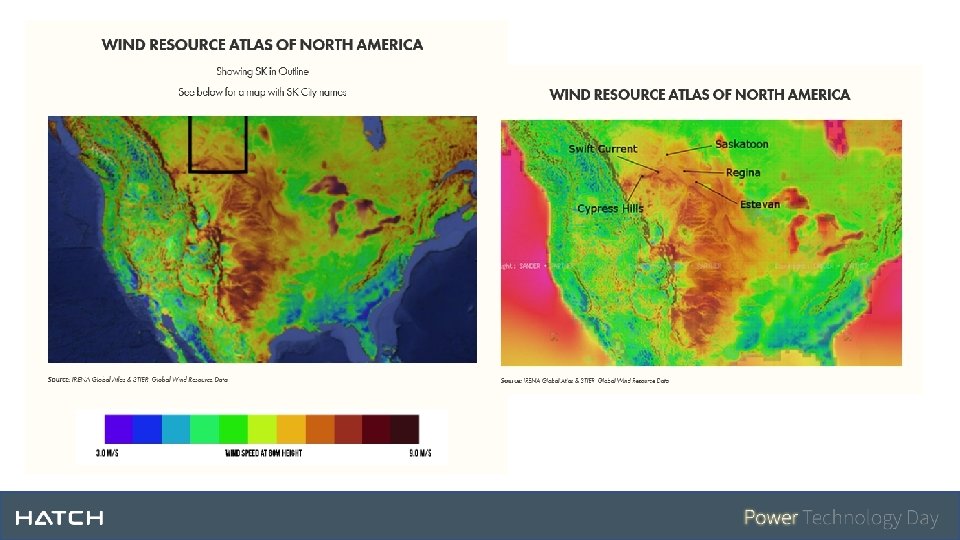
Solar Opportunity in Northern Climates

Saskatchewan Solar

Solar Efficiency Inverse to Temp

Solar, Wind, and Storage

100% Renewables? ? 20 -30 hours of Storage Capacity Less than 10 hours of Storage Capacity 10 -20 hours of Storage Capacity

Solar – Diesel - Storage Hybrid $ 0. 800 $ 90. 000 79. 26 $ 0. 700 $ 70. 000 $ 0. 600 $ 60. 000 CAPEX (USD Millions) Cost of Energy (USD/k. Wh) $ 80. 000 $ 0. 500 $ 50. 000 41. 48 $ 0. 400 $ 40. 000 36. 15 $ 0. 300 29. 63 $ 30. 000 23. 41 $ 0. 200 17. 41 $ 20. 000 11. 41 $ 0. 100 $- 2. 74 3. 78 20% 30% 6. 52 40% $ 10. 000 50% 60% 70% Renewable Penetration CAPEX 80% COE 90% 95% 100% $- Solar & Storage 40%, $190/MWh

Wind – Diesel - Storage Hybrid $ 1. 000 $ 180. 000 $ 0. 900 153. 70 $ 140. 000 $ 0. 700 $ 120. 000 CAPEX (USD Millions) Cost of Energy (USD/k. Wh) $ 0. 800 $ 160. 000 $ 0. 600 $ 100. 000 $ 0. 500 $ 80. 000 $ 0. 400 $ 60. 000 $ 0. 300 45. 19 33. 26 $ 0. 200 $ 0. 100 $- 4. 48 5. 67 8. 59 0. 83 2. 59 20% 30% 40% 50% 60% 13. 89 70% 20. 81 $ 20. 000 Renewable Penetration CAPEX $ 40. 000 80% COE 90% 95% 100% $- Solar & Storage 40%, $190/MWh Wind & Storage 60%, $165/MWh

Wind – Solar – Diesel - Storage Hybrid $ 0. 500 $ 60. 000 52. 22 $ 0. 450 $ 50. 000 $ 0. 350 $ 40. 000 $ 0. 300 CAPEX (USD Millions) Cost of Energy (USD/k. Wh) $ 0. 400 32. 78 $ 0. 250 $ 30. 000 27. 07 $ 0. 200 18. 52 $ 20. 000 $ 0. 150 12. 70 $ 0. 100 8. 67 $ 0. 050 1. 07 $- 20% 2. 51 30% 4. 19 40% $ 10. 000 6. 15 50% 60% 70% 80% Renewable Penetration CAPEX COE 90% 95% 100% $- Solar & Storage 40%, $190/MWh Wind & Storage 60%, $165/MWh Solar, Wind & Stor 60%, $161/MWh
 • Andrew. Mc.")
Thank you! • More Information: • Alexander. Stickler@hatch. com (renewables director) • Andrew. Mc. Lean@hatch. com (solar) • Martin. Hamel@hatch. com (wind) • Michel. Carreau@hatch. com (hybrid systems)
- Slides: 28