
Mark Haggard Helen Spencer Mariella Gregori MRC Multicentre



- Slides: 50
Mark Haggard, Helen Spencer & Mariella Gregori MRC Multi-centre Otitis Media Study Group, Cambridge, UK with Wendy Floate Cathy Harper Mid-Cheshire Hospitals NHS Trust Kingston Hospital NHS Trust & Eurotitis 2 Study Group Collaborators BACDA 20 th Anniversary Meeting London, 27 January, revised Autumn 2006 for
It is necessary to have: ö Valid and reliable measures of outcome in important domains for clinical trials & other types of study ö Standardised efficient assessment tools: – defining cases as to health and development status, not just pathology – as clinical indicators for treatment decisions ö International comparability on such measures (for general communication about case types, or multi-national studies that seek to accumulate or contrast) 2
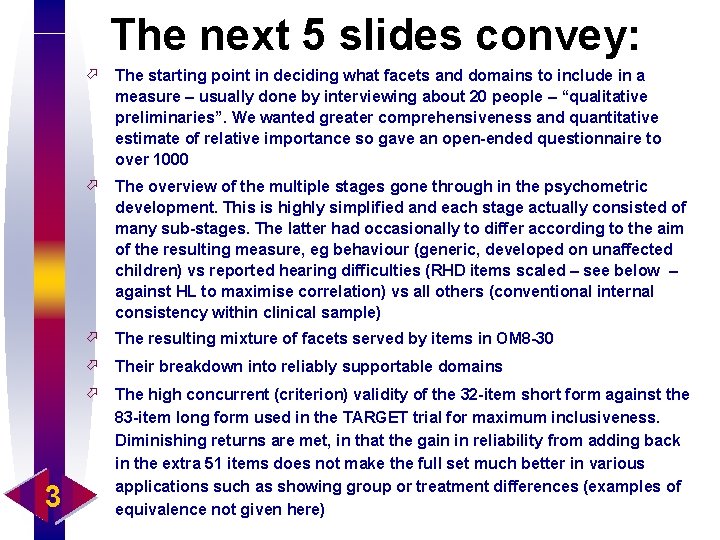
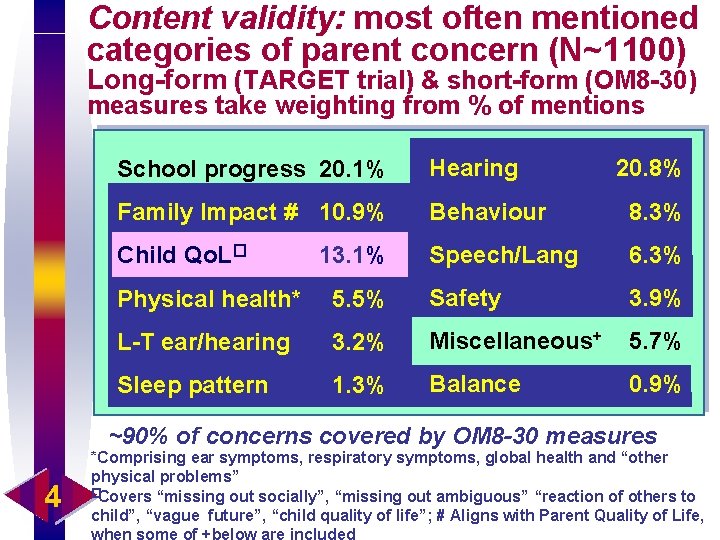
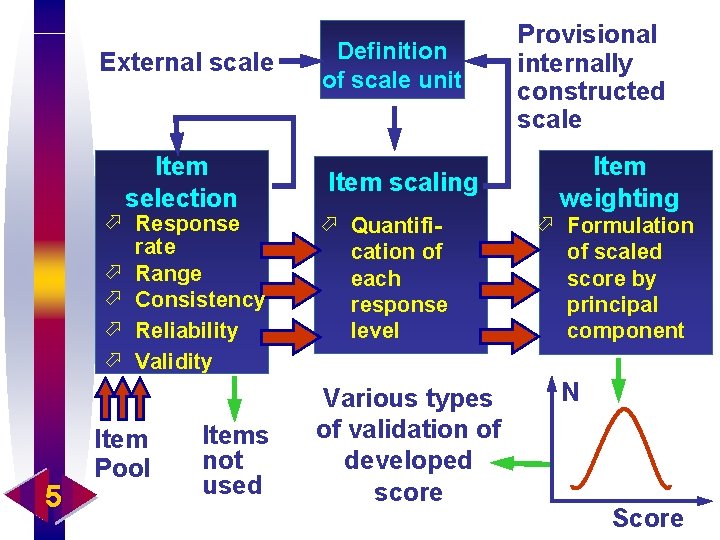
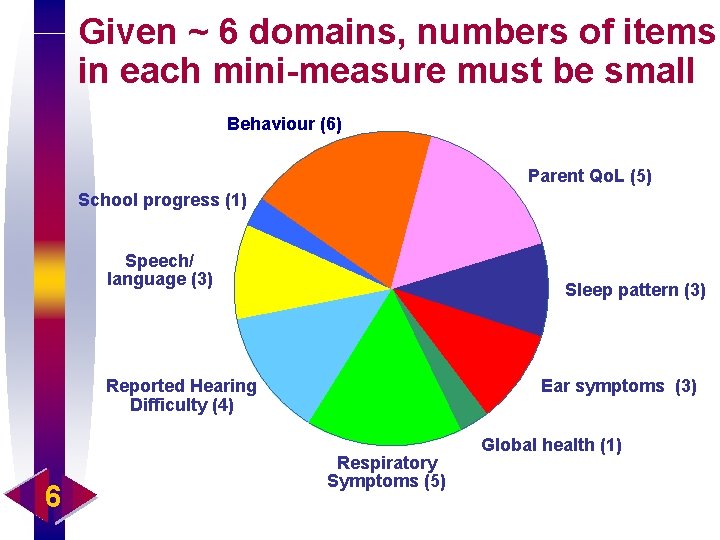
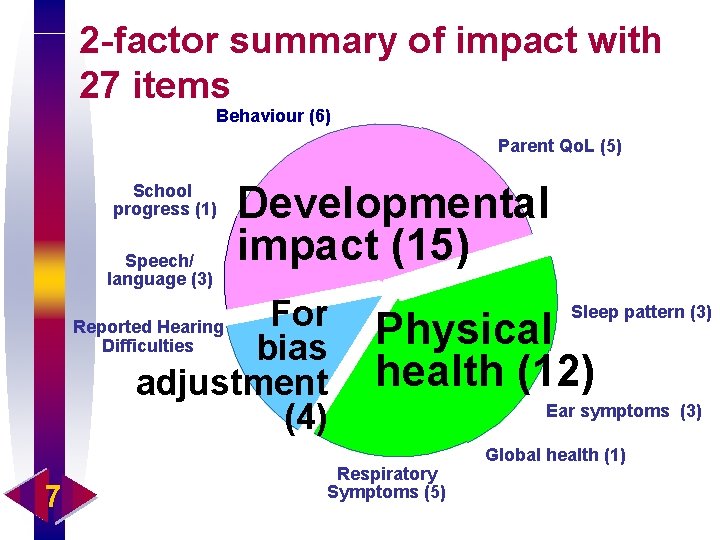
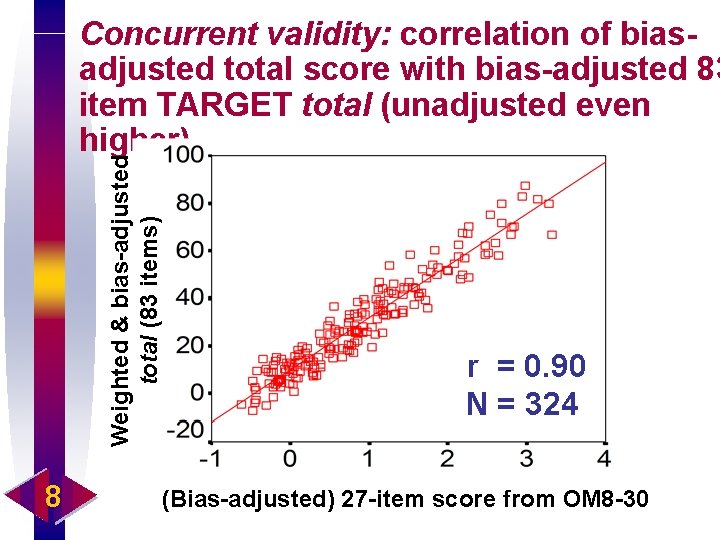
The next 5 slides convey: 3 ö The starting point in deciding what facets and domains to include in a measure – usually done by interviewing about 20 people – “qualitative preliminaries”. We wanted greater comprehensiveness and quantitative estimate of relative importance so gave an open-ended questionnaire to over 1000 ö The overview of the multiple stages gone through in the psychometric development. This is highly simplified and each stage actually consisted of many sub-stages. The latter had occasionally to differ according to the aim of the resulting measure, eg behaviour (generic, developed on unaffected children) vs reported hearing difficulties (RHD items scaled – see below – against HL to maximise correlation) vs all others (conventional internal consistency within clinical sample) ö The resulting mixture of facets served by items in OM 8 -30 ö Their breakdown into reliably supportable domains ö The high concurrent (criterion) validity of the 32 -item short form against the 83 -item long form used in the TARGET trial for maximum inclusiveness. Diminishing returns are met, in that the gain in reliability from adding back in the extra 51 items does not make the full set much better in various applications such as showing group or treatment differences (examples of equivalence not given here)
Content validity: most often mentioned categories of parent concern (N~1100) Long-form (TARGET trial) & short-form (OM 8 -30) measures take weighting from % of mentions School progress 20. 1% Hearing Family Impact # 10. 9% Behaviour 8. 3% Child Qo. L� Speech/Lang 6. 3% 13. 1% 20. 8% Physical health* 5. 5% Safety 3. 9% L-T ear/hearing 3. 2% Miscellaneous+ 5. 7% Sleep pattern 1. 3% Balance 0. 9% ~90% of concerns covered by OM 8 -30 measures 4 *Comprising ear symptoms, respiratory symptoms, global health and “other physical problems” �Covers “missing out socially”, “missing out ambiguous” “reaction of others to child”, “vague future”, “child quality of life”; # Aligns with Parent Quality of Life, when some of +below are included
External scale Item selection ö Response rate ö Range ö Consistency ö Reliability ö Validity 5 Item Pool Items not used Definition of scale unit Item scaling Ear ö Quantifi. Infecti cation of eachon response level Various types of validation of developed score Provisional internally constructed scale Item weighting ö Formulation of scaled score by principal component N Score
Given ~ 6 domains, numbers of items in each mini-measure must be small Behaviour (6) Parent Qo. L (5) School progress (1) Speech/ language (3) Sleep pattern (3) Ear symptoms (3) Reported Hearing Difficulty (4) 6 Respiratory Symptoms (5) Global health (1)
2 -factor summary of impact with 27 items Behaviour (6) Parent Qo. L (5) School progress (1) Speech/ language (3) Developmental impact (15) For Reported Hearing Difficulties bias adjustment (4) 7 Sleep pattern (3) Physical health (12) Respiratory Symptoms (5) Ear symptoms (3) Global health (1)
Weighted & bias-adjusted total (83 items) Concurrent validity: correlation of biasadjusted total score with bias-adjusted 83 item TARGET total (unadjusted even higher) 8 r = 0. 90 N = 324 (Bias-adjusted) 27 -item score from OM 8 -30
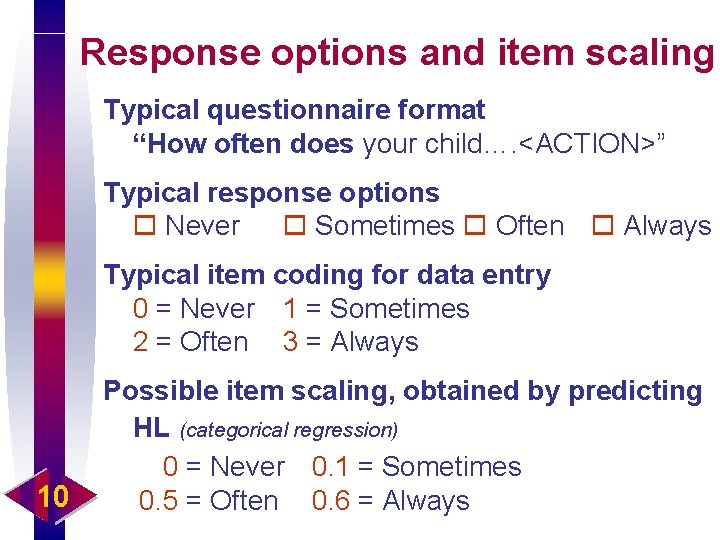
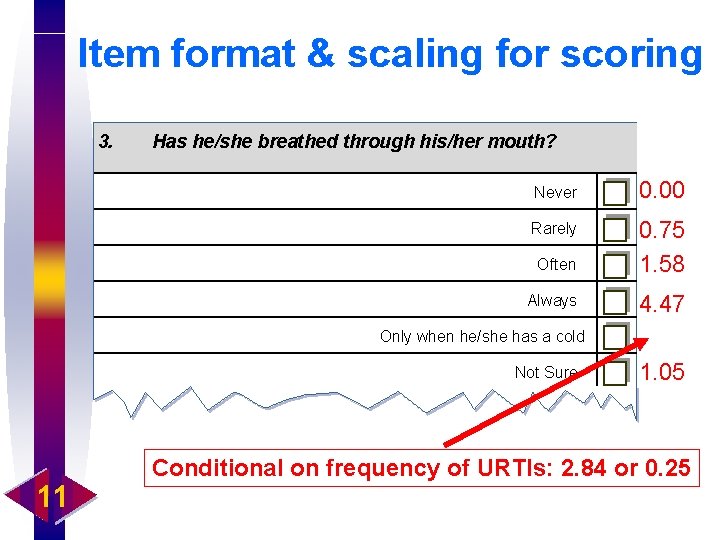
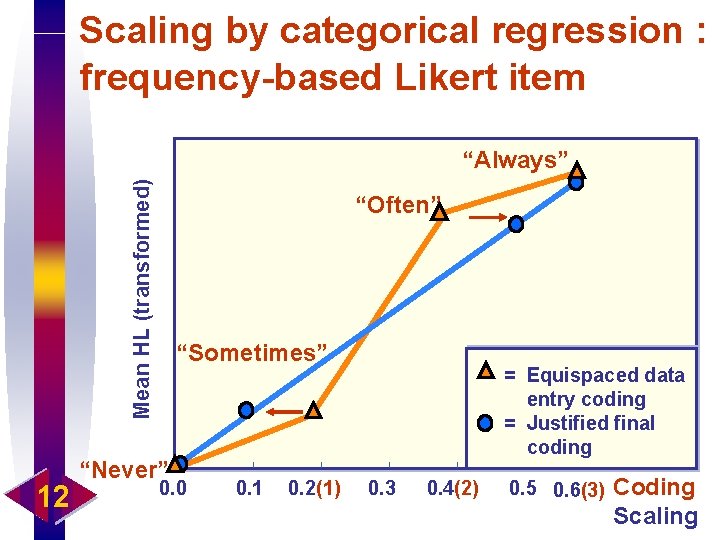
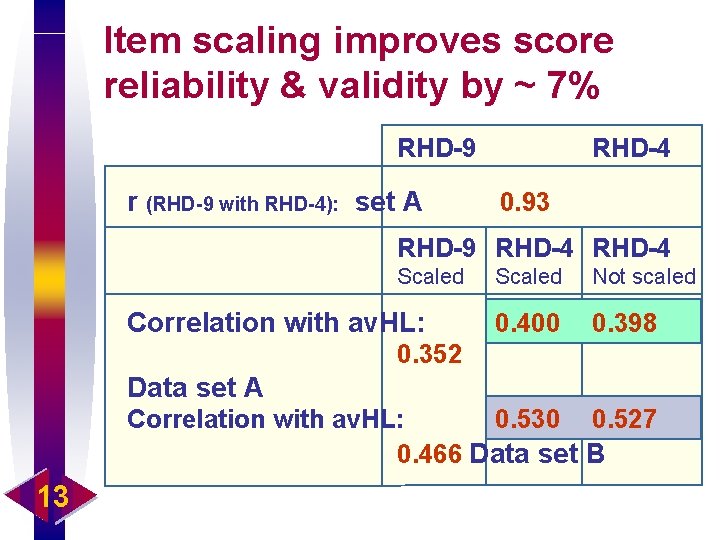
The next 6 slides convey: 9 ö The general format of the items and the need not to assume that the separations between the adjacent pairs of response levels are necessarily all equal ( eg = 1. 00) ö The idea of optimally scaling the response-levels for a Likert item, to maximise its discriminating potential. This is done by a regression between the item, distinguishing its response levels initially as floating categories, and the raw total count ( ie for each individual in a very large sample). Thus the best spacing between the response levels is determined by the average spacing in the item count for similar items, as this is what maximises the correlation. The particular example shows an additional sophistication: contingent scoring for one response category. That has now been abandoned as the multiplication involved has been found to add unnecessary variability; “frequent colds” is now scored as a separate additive item like any other and a single scale value attributed to the “only when colds” answers ö A graphic representation of this idea whereby for the underlying more sensitive scale the equality assumption is wrong (orange) whereas the scaled version with empirically assigned spacings between response levels is correct in the sense that it maps the item more efficiently onto a better and more highly aggregated version of what it is trying to measure. One could go round the iterative loop one or more further times, eg basing the total not on the raw dichotomy items but such scaled versions, and then re-scaling. However this is labourintensive and automatic algorithms to do this are perhaps not to be trusted at this stage. Maximum gain comes from the first stage as described ö Using the expected moderate correlation of a reported scale (RHD) with a measured one (HL) as a test, the enhancement to the correlation from scaling (compare penultimate with last column) is worth having. Although 7% does not sound huge, it can be mapped into substantial savings in sample size hence feasibility of studies. Evident in the comparison table is the equivalence of the gain from scaling to an approximate doubling of the length of the part of questionnaire by adding back in the less good 5 items discarded for OM 8 -30 ö Clarification of the distinction between the purpose and content of the long & short forms ö The particular items before and after the selection for the short form (OM 8 -30)
Response options and item scaling Typical questionnaire format “How often does your child…. <ACTION>” Typical response options Never Sometimes Often Always Typical item coding for data entry 0 = Never 1 = Sometimes 2 = Often 3 = Always 10 Possible item scaling, obtained by predicting HL (categorical regression) 0 = Never 0. 1 = Sometimes 0. 5 = Often 0. 6 = Always
Item format & scaling for scoring 3. Has he/she breathed through his/her mouth? Never 0. 00 Rarely Often 0. 75 1. 58 Always 4. 47 Only when he/she has a cold Not Sure 11 1. 05 Conditional on frequency of URTIs: 2. 84 or 0. 25
Scaling by categorical regression : frequency-based Likert item Mean HL (transformed) “Always” 12 “Often” “Sometimes” “Never” 0. 0 0. 1 0. 2(1) = Equispaced data entry coding = Justified final coding 0. 3 0. 4(2) 0. 5 0. 6(3) Coding Scaling
Item scaling improves score reliability & validity by ~ 7% RHD-9 r (RHD-9 with RHD-4): set A RHD-4 0. 93 RHD-9 RHD-4 Scaled Correlation with av. HL: Scaled Not scaled 0. 400 0. 398 0. 352 Data set A Correlation with av. HL: 0. 530 0. 527 0. 466 Data set B 13
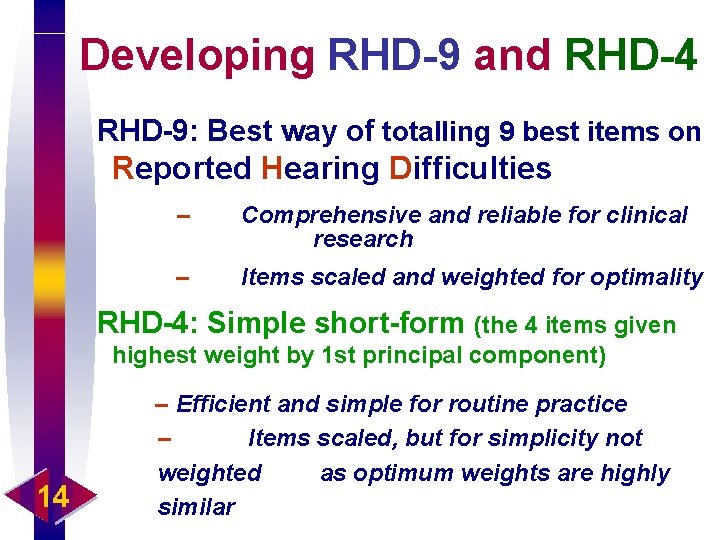
Developing RHD-9 and RHD-4 RHD-9: Best way of totalling 9 best items on Reported Hearing Difficulties – Comprehensive and reliable for clinical research – Items scaled and weighted for optimality RHD-4: Simple short-form (the 4 items given highest weight by 1 st principal component) 14 – Efficient and simple for routine practice – Items scaled, but for simplicity not weighted as optimum weights are highly similar
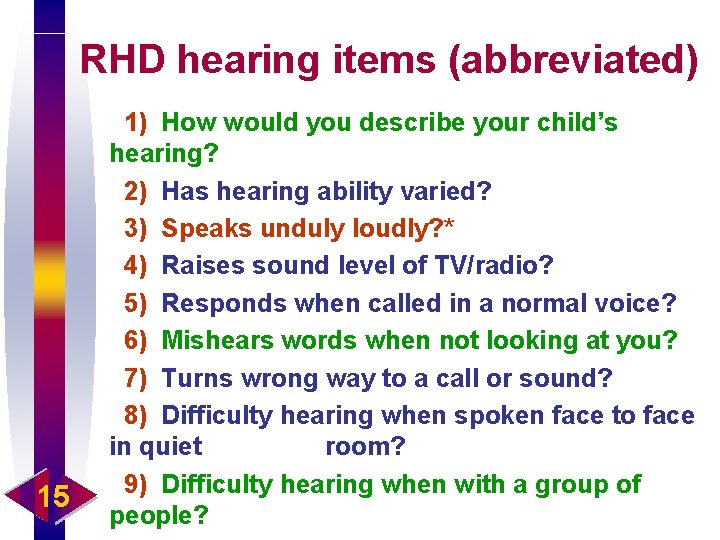
RHD hearing items (abbreviated) 15 1) How would you describe your child’s hearing? 2) Has hearing ability varied? 3) Speaks unduly loudly? * 4) Raises sound level of TV/radio? 5) Responds when called in a normal voice? 6) Mishears words when not looking at you? 7) Turns wrong way to a call or sound? 8) Difficulty hearing when spoken face to face in quiet room? 9) Difficulty hearing when with a group of people?
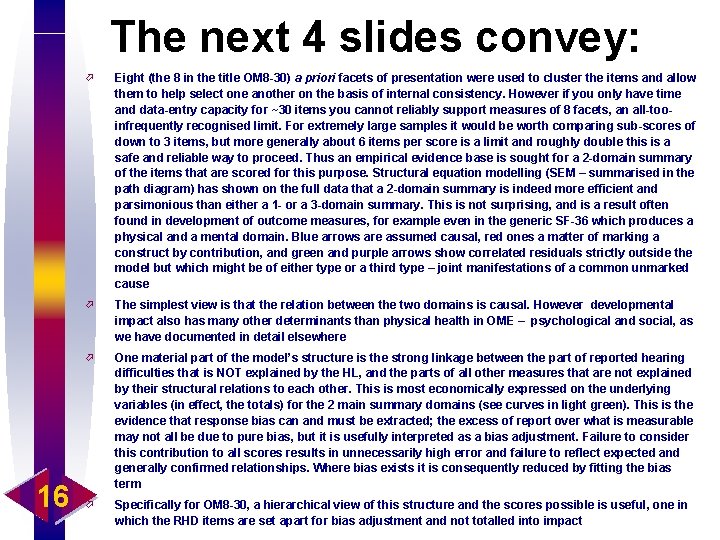
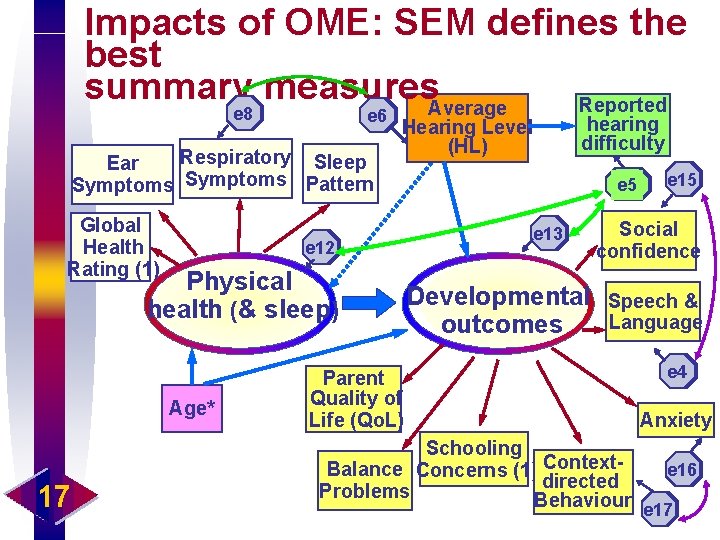
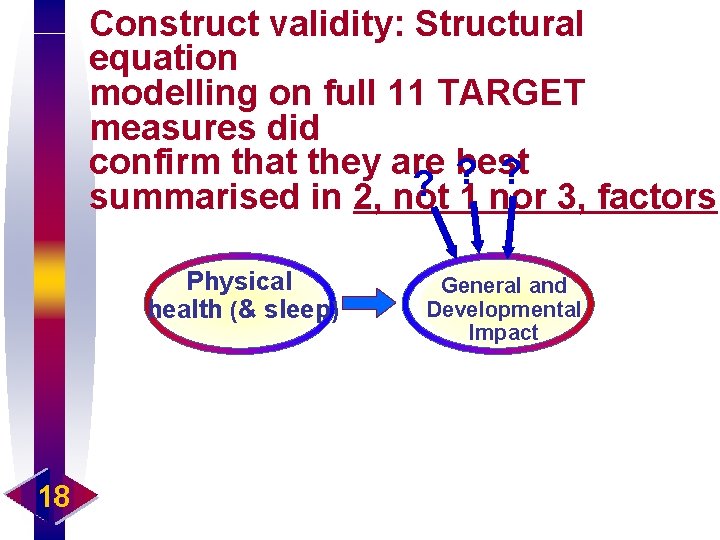
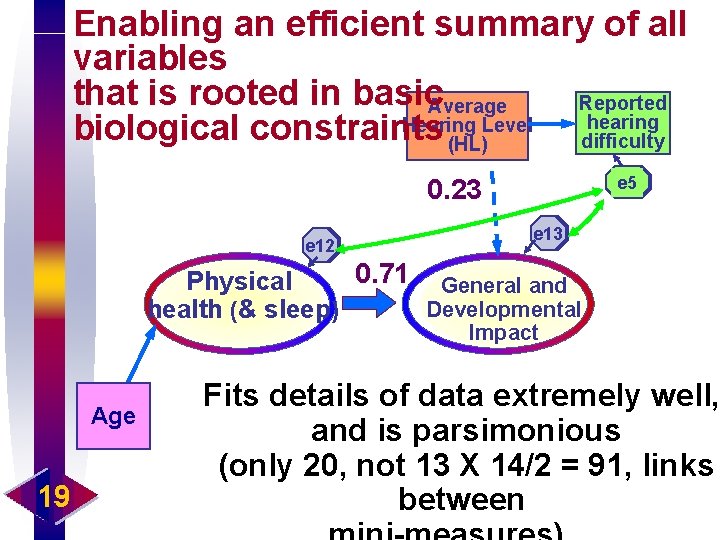
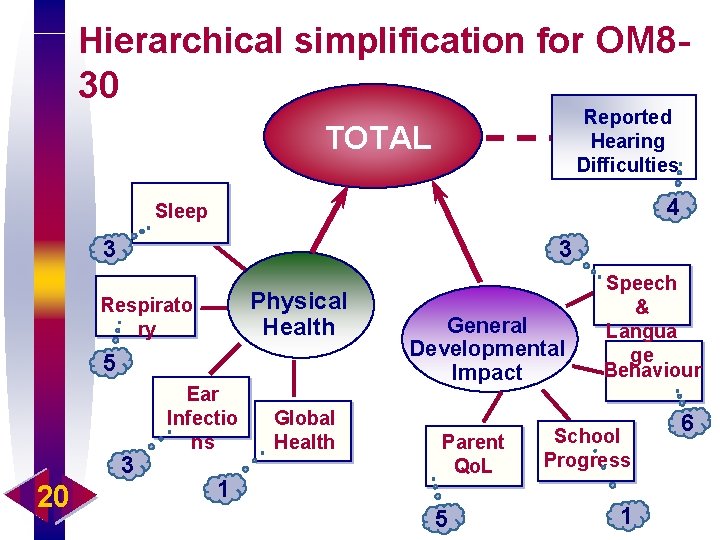
The next 4 slides convey: 16 ö Eight (the 8 in the title OM 8 -30) a priori facets of presentation were used to cluster the items and allow them to help select one another on the basis of internal consistency. However if you only have time and data-entry capacity for ~30 items you cannot reliably support measures of 8 facets, an all-tooinfrequently recognised limit. For extremely large samples it would be worth comparing sub-scores of down to 3 items, but more generally about 6 items per score is a limit and roughly double this is a safe and reliable way to proceed. Thus an empirical evidence base is sought for a 2 -domain summary of the items that are scored for this purpose. Structural equation modelling (SEM – summarised in the path diagram) has shown on the full data that a 2 -domain summary is indeed more efficient and parsimonious than either a 1 - or a 3 -domain summary. This is not surprising, and is a result often found in development of outcome measures, for example even in the generic SF-36 which produces a physical and a mental domain. Blue arrows are assumed causal, red ones a matter of marking a construct by contribution, and green and purple arrows show correlated residuals strictly outside the model but which might be of either type or a third type – joint manifestations of a common unmarked cause ö The simplest view is that the relation between the two domains is causal. However developmental impact also has many other determinants than physical health in OME – psychological and social, as we have documented in detail elsewhere ö One material part of the model’s structure is the strong linkage between the part of reported hearing difficulties that is NOT explained by the HL, and the parts of all other measures that are not explained by their structural relations to each other. This is most economically expressed on the underlying variables (in effect, the totals) for the 2 main summary domains (see curves in light green). This is the evidence that response bias can and must be extracted; the excess of report over what is measurable may not all be due to pure bias, but it is usefully interpreted as a bias adjustment. Failure to consider this contribution to all scores results in unnecessarily high error and failure to reflect expected and generally confirmed relationships. Where bias exists it is consequently reduced by fitting the bias term ö Specifically for OM 8 -30, a hierarchical view of this structure and the scores possible is useful, one in which the RHD items are set apart for bias adjustment and not totalled into impact
Impacts of OME: SEM defines the best summary measures. Average Reported e 8 e 6 Respiratory Sleep Ear Symptoms Pattern Global Health Rating (1) Hearing Level (HL) e 12 Physical health (& sleep) Age* 17 Parent Quality of Life (Qo. L) hearing difficulty e 5 e 13 Developmental outcomes e 15 Social confidence Speech & Language e 4 Anxiety Schooling e 16 Balance Concerns (1) Contextdirected Problems Behaviour e 17
Construct validity: Structural equation modelling on full 11 TARGET measures did confirm that they are best ? ? ? summarised in 2, not 1 nor 3, factors Physical health (& sleep) 18 General and Developmental Impact
Enabling an efficient summary of all variables that is rooted in basic. Average Reported hearing Hearing Level biological constraints difficulty (HL) e 5 0. 23 e 12 e 13 0. 71 General and Physical Developmental health (& sleep) Impact Age 19 Fits details of data extremely well, and is parsimonious (only 20, not 13 X 14/2 = 91, links between
Hierarchical simplification for OM 8 - 30 Reported Hearing Difficulties TOTAL 4 Sleep 3 3 Physical Health Respirato ry 5 3 20 Ear Infectio ns 1 Global Health General Developmental Impact Parent Qo. L 5 Speech & Langua ge Behaviour School Progress 1 6
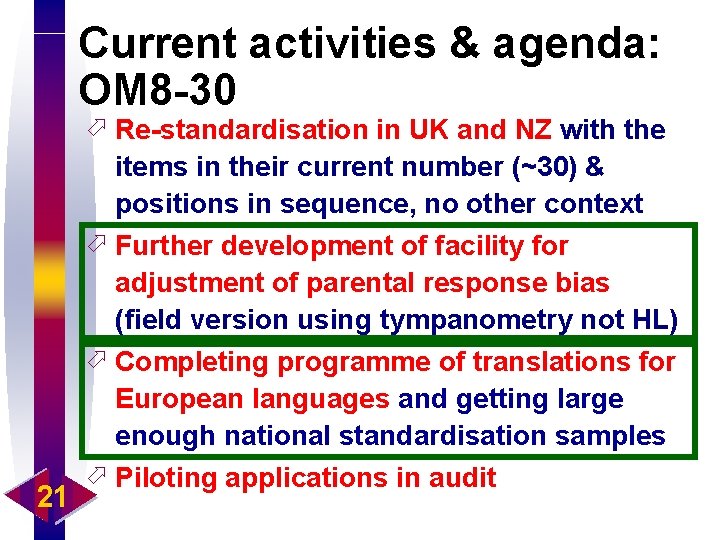
Current activities & agenda: OM 8 -30 21 ö Re-standardisation in UK and NZ with the items in their current number (~30) & positions in sequence, no other context ö Further development of facility for adjustment of parental response bias (field version using tympanometry not HL) ö Completing programme of translations for European languages and getting large enough national standardisation samples ö Piloting applications in audit
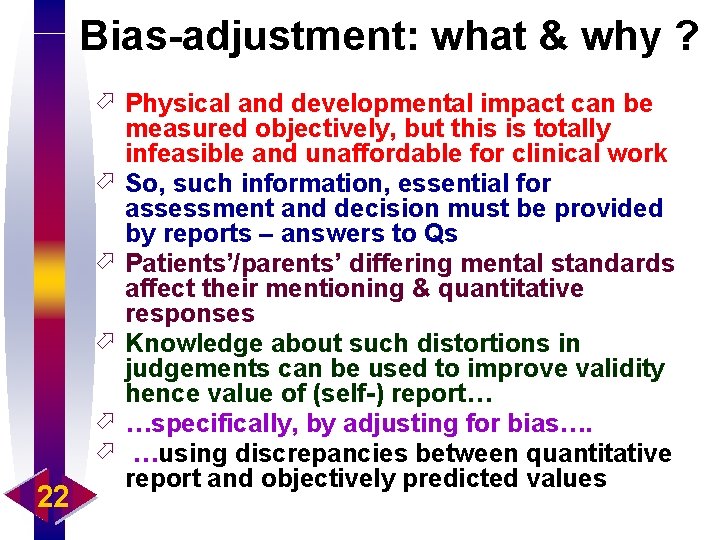
Bias-adjustment: what & why ? 22 ö Physical and developmental impact can be measured objectively, but this is totally infeasible and unaffordable for clinical work ö So, such information, essential for assessment and decision must be provided by reports – answers to Qs ö Patients’/parents’ differing mental standards affect their mentioning & quantitative responses ö Knowledge about such distortions in judgements can be used to improve validity hence value of (self-) report… ö …specifically, by adjusting for bias…. ö …using discrepancies between quantitative report and objectively predicted values
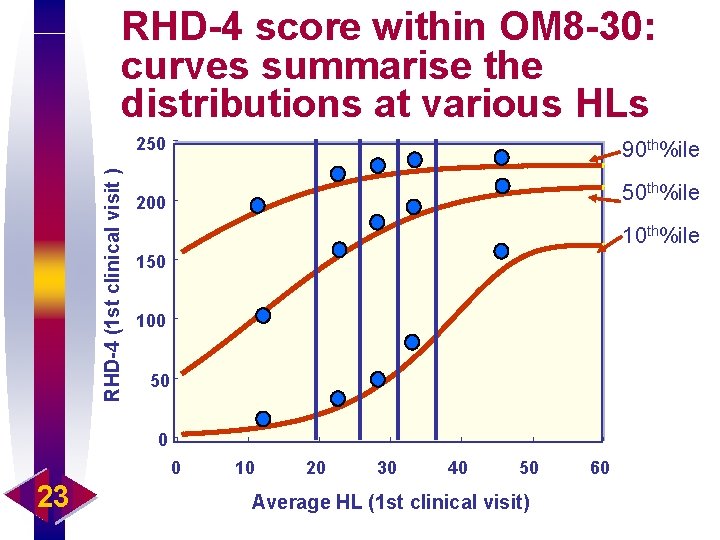
RHD-4 (1 st clinical visit ) RHD-4 score within OM 8 -30: curves summarise the distributions at various HLs 250 90 th%ile 200 50 th%ile 150 100 50 0 0 23 10 20 30 40 50 Average HL (1 st clinical visit) 60
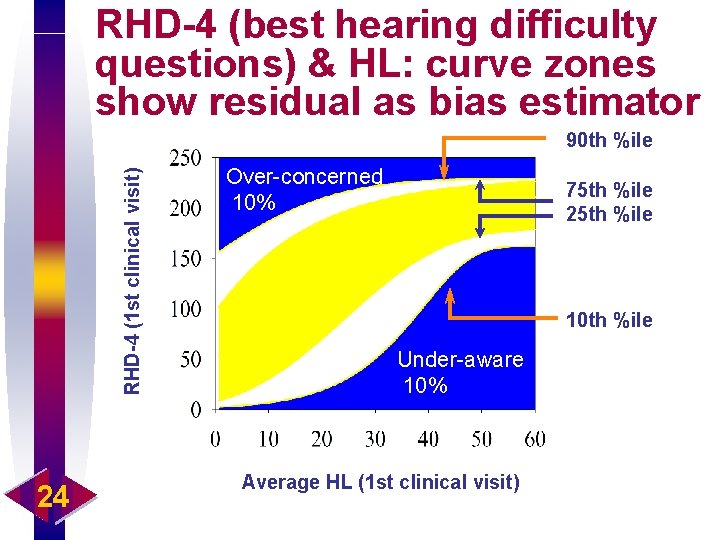
RHD-4 (best hearing difficulty questions) & HL: curve zones show residual as bias estimator RHD-4 (1 st clinical visit) 90 th %ile 24 Over-concerned 10% 75 th %ile 25 th %ile 10 th %ile Under-aware 10% Average HL (1 st clinical visit)
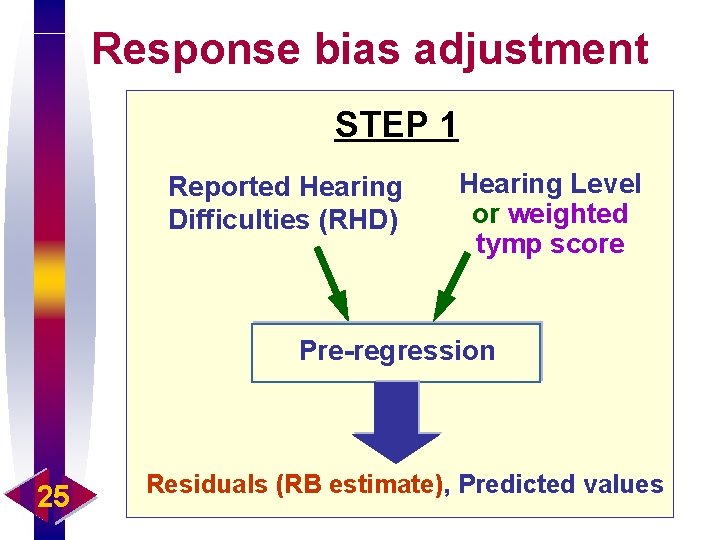
Response bias adjustment STEP 1 Reported Hearing Difficulties (RHD) Hearing Level or weighted tymp score Pre-regression 25 Residuals (RB estimate), Predicted values
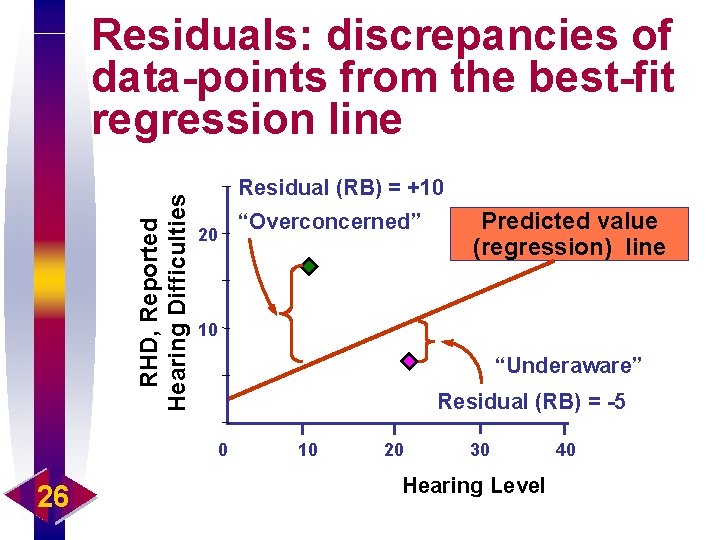
RHD, Reported Hearing Difficulties Residuals: discrepancies of data-points from the best-fit regression line Residual (RB) = +10 20 Predicted value (regression) line 10 “Underaware” Residual (RB) = -5 0 26 “Overconcerned” 10 20 30 Hearing Level 40
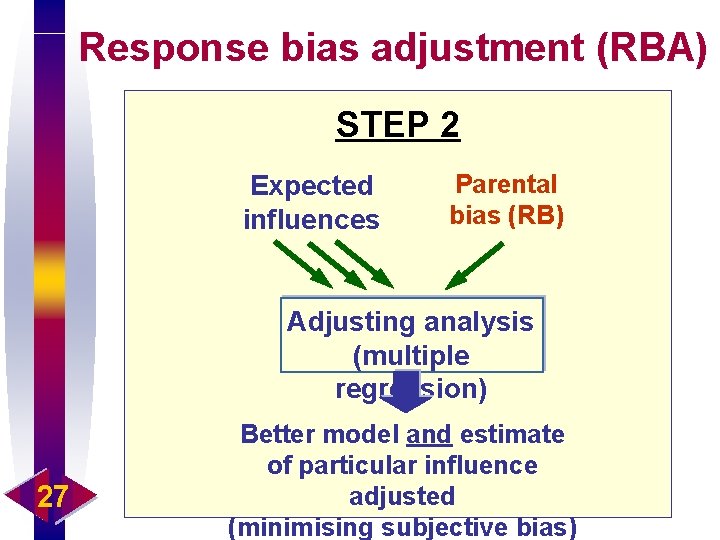
Response bias adjustment (RBA) STEP 2 Expected influences Parental bias (RB) Adjusting analysis (multiple regression) 27 Better model and estimate of particular influence adjusted (minimising subjective bias)
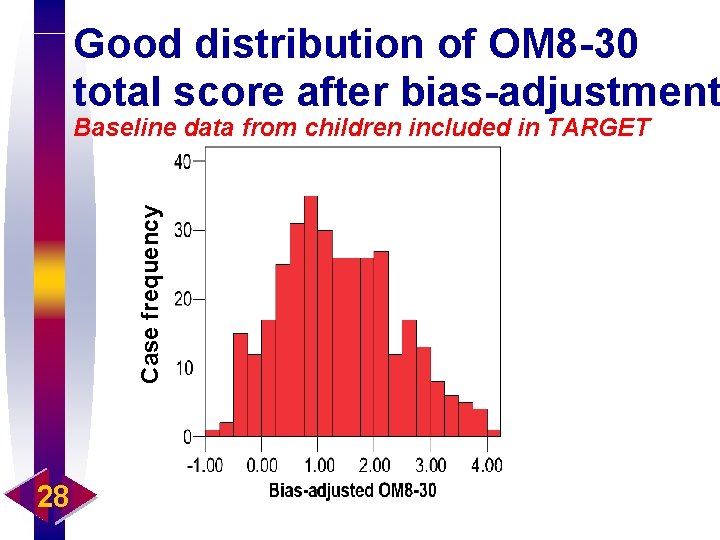
Good distribution of OM 8 -30 total score after bias-adjustment Case frequency Baseline data from children included in TARGET 28
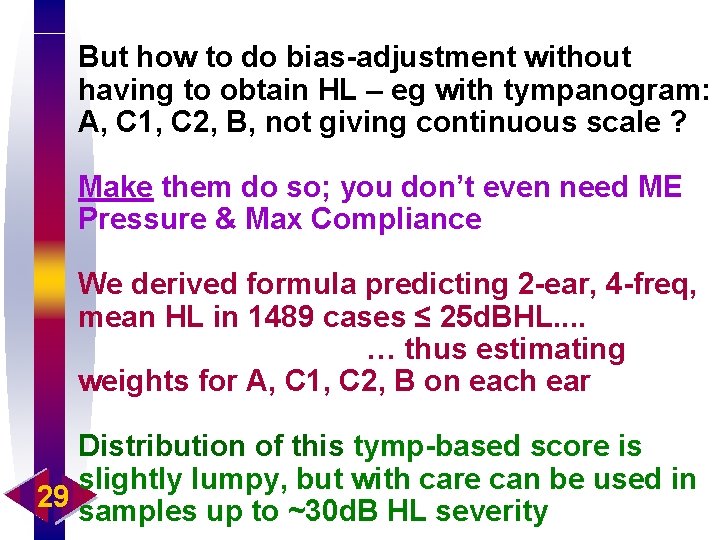
But how to do bias-adjustment without having to obtain HL – eg with tympanogram: A, C 1, C 2, B, not giving continuous scale ? Make them do so; you don’t even need ME Pressure & Max Compliance We derived formula predicting 2 -ear, 4 -freq, mean HL in 1489 cases ≤ 25 d. BHL. . … thus estimating weights for A, C 1, C 2, B on each ear Distribution of this tymp-based score is slightly lumpy, but with care can be used in 29 samples up to ~30 d. B HL severity
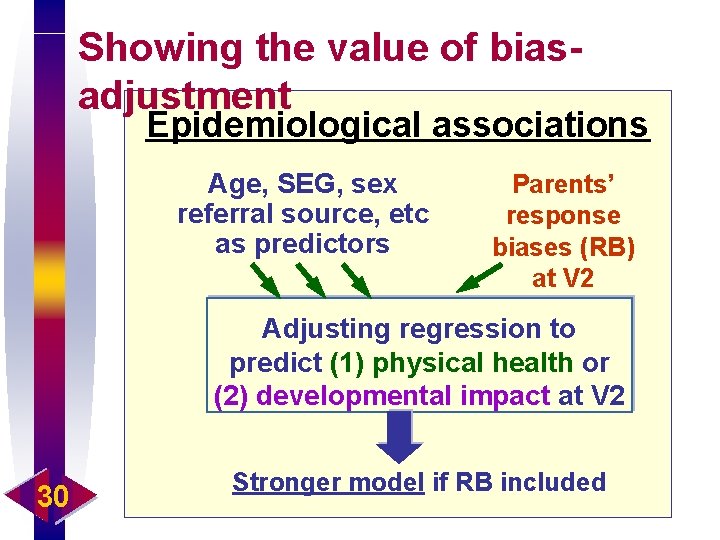
Showing the value of biasadjustment Epidemiological associations Age, SEG, sex referral source, etc as predictors Parents’ response biases (RB) at V 2 Adjusting regression to predict (1) physical health or (2) developmental impact at V 2 30 Stronger model if RB included
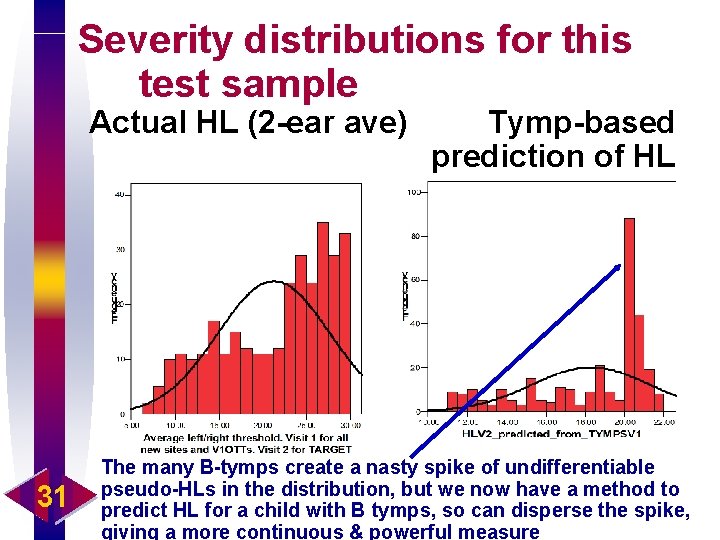
Severity distributions for this test sample Actual HL (2 -ear ave) 31 Tymp-based prediction of HL The many B-tymps create a nasty spike of undifferentiable pseudo-HLs in the distribution, but we now have a method to predict HL for a child with B tymps, so can disperse the spike, giving a more continuous & powerful measure
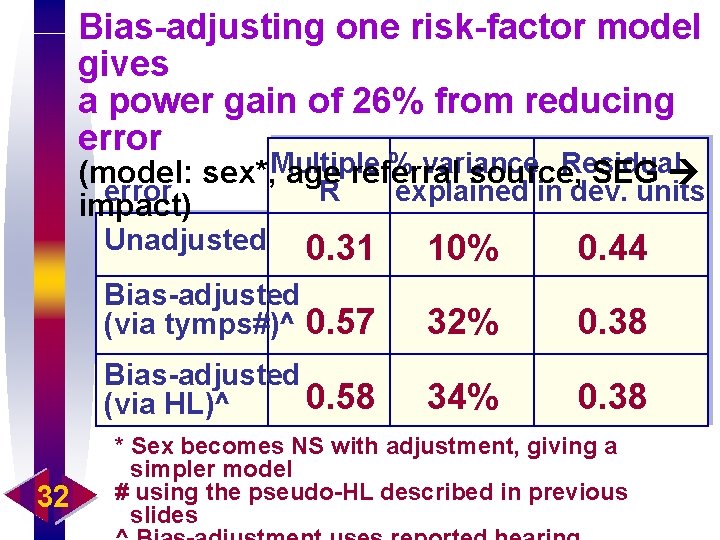
Bias-adjusting one risk-factor model gives a power gain of 26% from reducing error % variance Residual (model: sex*, Multiple age referral source, SEG error R explained in dev. units impact) Unadjusted 32 0. 31 10% 0. 44 Bias-adjusted (via tymps#)^ 0. 57 32% 0. 38 Bias-adjusted 0. 58 (via HL)^ 34% 0. 38 * Sex becomes NS with adjustment, giving a simpler model # using the pseudo-HL described in previous slides
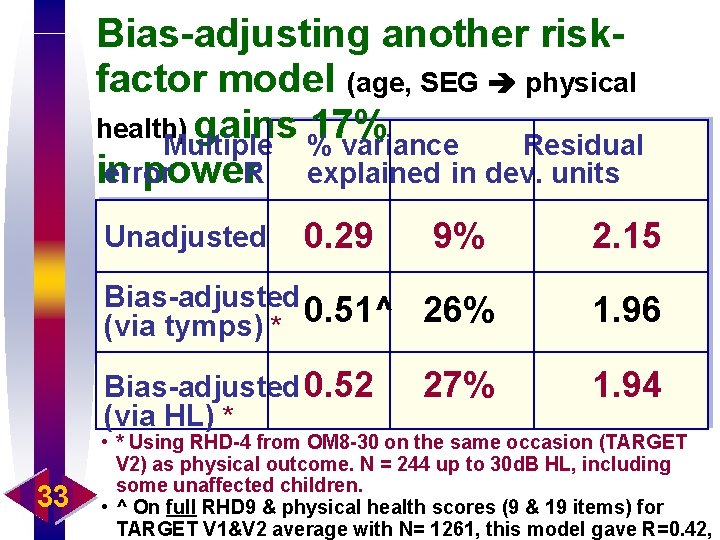
Bias-adjusting another riskfactor model (age, SEG physical health) gains 17% Multiple % variance Residual error in power. R explained in dev. units 9% 2. 15 Bias-adjusted 0. 51^ (via tymps) * 26% 1. 96 Bias-adjusted 0. 52 (via HL) * 27% 1. 94 Unadjusted 33 0. 29 • * Using RHD-4 from OM 8 -30 on the same occasion (TARGET V 2) as physical outcome. N = 244 up to 30 d. B HL, including some unaffected children. • ^ On full RHD 9 & physical health scores (9 & 19 items) for TARGET V 1&V 2 average with N= 1261, this model gave R=0. 42,
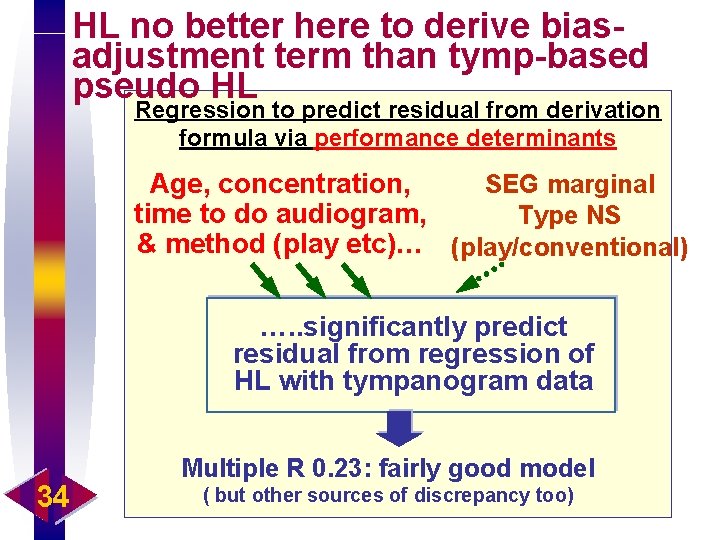
HL no better here to derive biasadjustment term than tymp-based pseudo HL Regression to predict residual from derivation formula via performance determinants Age, concentration, SEG marginal time to do audiogram, Type NS & method (play etc)… (play/conventional) …. . significantly predict residual from regression of HL with tympanogram data 34 Multiple R 0. 23: fairly good model ( but other sources of discrepancy too)
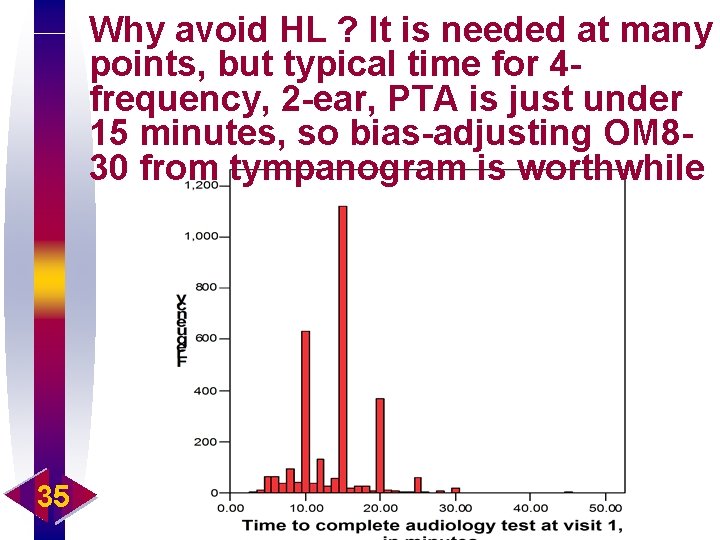
Why avoid HL ? It is needed at many points, but typical time for 4 frequency, 2 -ear, PTA is just under 15 minutes, so bias-adjusting OM 830 from tympanogram is worthwhile 35
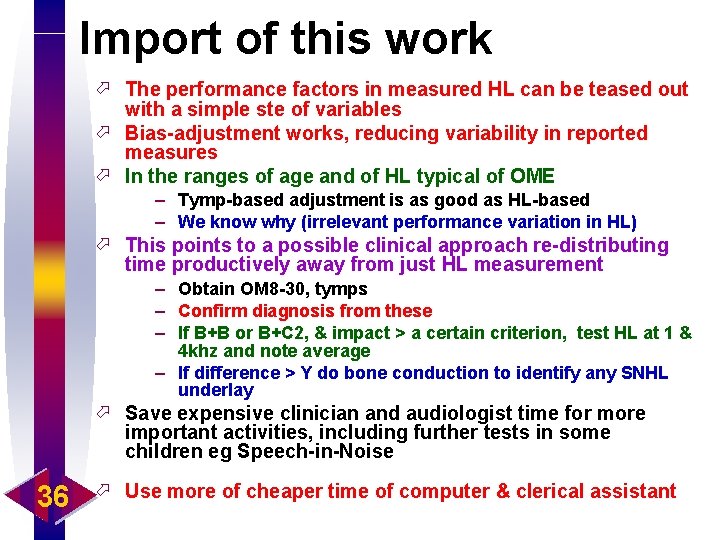
Import of this work ö The performance factors in measured HL can be teased out with a simple ste of variables ö Bias-adjustment works, reducing variability in reported measures ö In the ranges of age and of HL typical of OME – Tymp-based adjustment is as good as HL-based – We know why (irrelevant performance variation in HL) ö This points to a possible clinical approach re-distributing time productively away from just HL measurement – Obtain OM 8 -30, tymps – Confirm diagnosis from these – If B+B or B+C 2, & impact > a certain criterion, test HL at 1 & 4 khz and note average – If difference > Y do bone conduction to identify any SNHL underlay ö Save expensive clinician and audiologist time for more important activities, including further tests in some children eg Speech-in-Noise 36 ö Use more of cheaper time of computer & clerical assistant
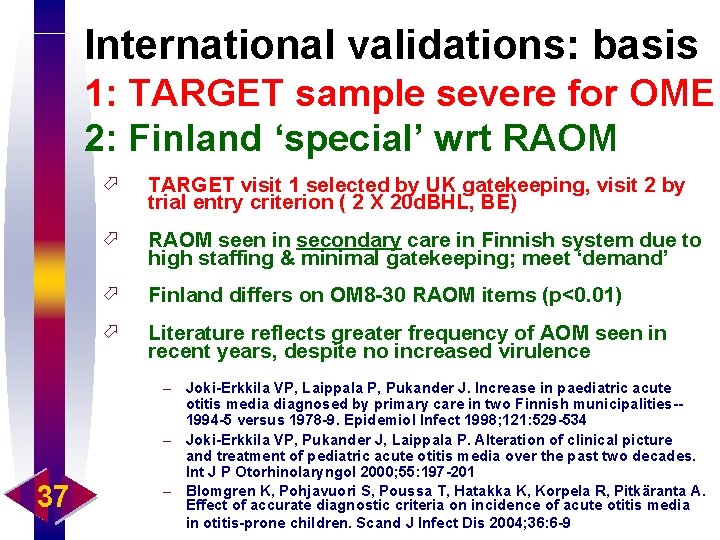
International validations: basis 1: TARGET sample severe for OME 2: Finland ‘special’ wrt RAOM 37 ö TARGET visit 1 selected by UK gatekeeping, visit 2 by trial entry criterion ( 2 X 20 d. BHL, BE) ö RAOM seen in secondary care in Finnish system due to high staffing & minimal gatekeeping; meet ‘demand’ ö Finland differs on OM 8 -30 RAOM items (p<0. 01) ö Literature reflects greater frequency of AOM seen in recent years, despite no increased virulence – Joki-Erkkila VP, Laippala P, Pukander J. Increase in paediatric acute otitis media diagnosed by primary care in two Finnish municipalities-1994 -5 versus 1978 -9. Epidemiol Infect 1998; 121: 529 -534 – Joki-Erkkila VP, Pukander J, Laippala P. Alteration of clinical picture and treatment of pediatric acute otitis media over the past two decades. Int J P Otorhinolaryngol 2000; 55: 197 -201 – Blomgren K, Pohjavuori S, Poussa T, Hatakka K, Korpela R, Pitkäranta A. Effect of accurate diagnostic criteria on incidence of acute otitis media in otitis-prone children. Scand J Infect Dis 2004; 36: 6 -9
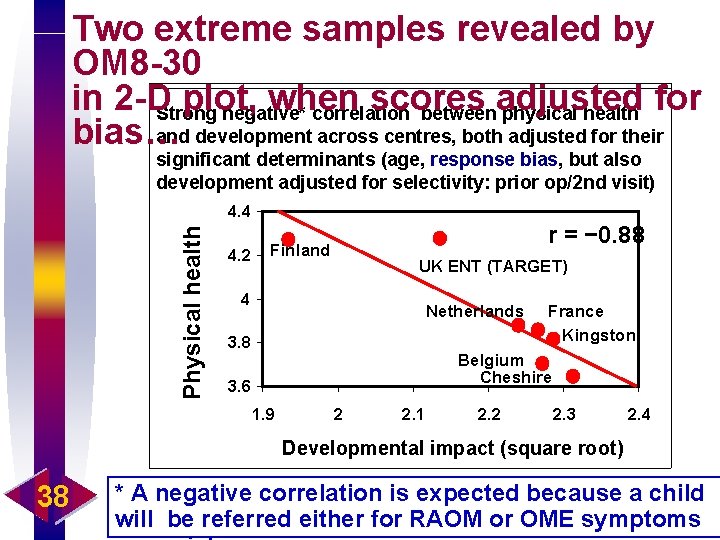
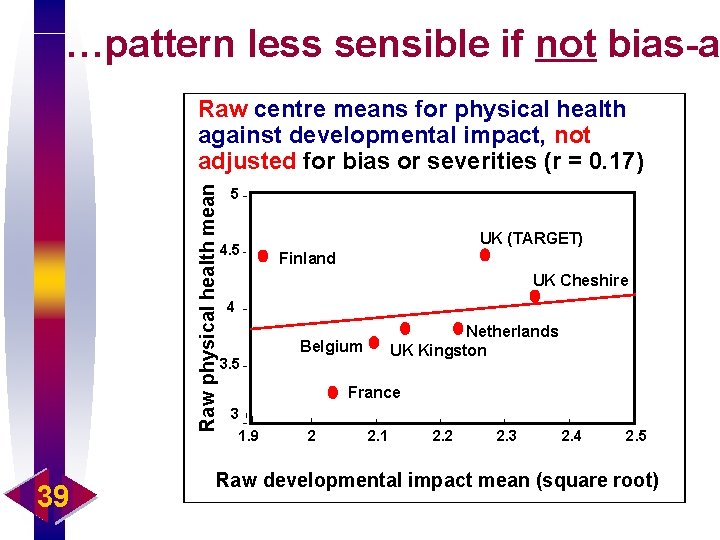
Two extreme samples revealed by OM 8 -30 in 2 -DStrong plot, when scores adjusted for negative* correlation between physical health and development across centres, both adjusted for their bias… significant determinants (age, response bias, but also development adjusted for selectivity: prior op/2 nd visit) Physical health 4. 4 4. 2 r = − 0. 88 Finland UK ENT (TARGET) 4 Netherlands 3. 8 France Kingston Belgium Cheshire 3. 6 1. 9 2 2. 1 2. 2 2. 3 2. 4 Developmental impact (square root) 38 * A negative correlation is expected because a child will be referred either for RAOM or OME symptoms
…pattern less sensible if not bias-ad Raw physical health mean Raw centre means for physical health against developmental impact, not adjusted for bias or severities (r = 0. 17) 39 5 4. 5 UK (TARGET) Finland UK Cheshire 4 Netherlands UK Kingston Belgium 3. 5 France 3 1. 9 2 2. 1 2. 2 2. 3 2. 4 2. 5 Raw developmental impact mean (square root)
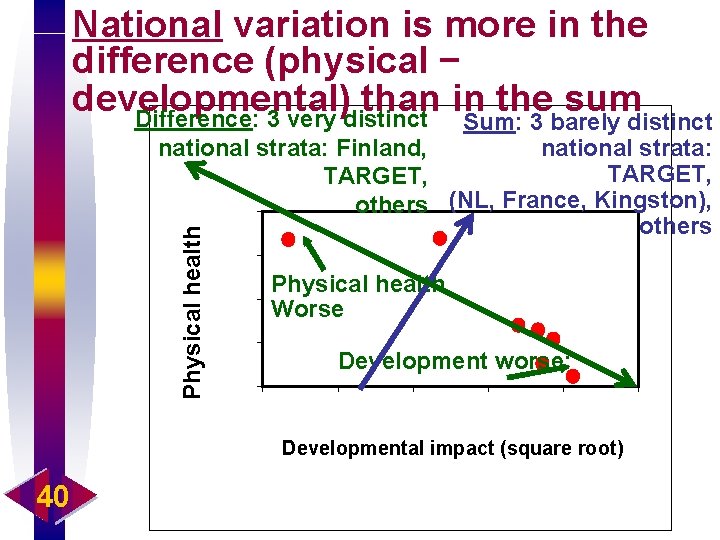
National variation is more in the difference (physical − developmental) than in the sum Difference: 3 very distinct Sum: 3 barely distinct Physical health national strata: Finland, national strata: TARGET, others (NL, France, Kingston), others Physical health Worse Development worse: Developmental impact (square root) 40
Value of Eurotitis 2 international standardisation study to OM 8 -30* ö ö ö ö 41 Factor structure hence basis of scoring highly similar across language translations and healthcare cultures 2 -D plot of (phys + dev) vs (phys – dev) ie total vs difference best way to think about impact Adjusting for simple clinical differences, and particularly for parental response bias – Reveals expected & known effects much better – Leaves little “purely national” variation This makes standardisation, including inter-nationally feasible without needing vast N or vast budget Model for impact (HL, RAOM, URTI developmental impact) strong in TARGET and Eurotitis 2 data Ease of application of bias-adjustment in OM 8 -30 considerably boosted by demonstration (in Eurotitis 2 data also) that tympbased formula pseudo-HL gives results similar to true HL for samples varying through normal, marginal, definite OME (not so applicable if many HLs go above 30 d. B) Principal component version of factor structure allows selection of best items for ultra-short-form OM 2 -13; Eurotitis 2 data support very similar selection hence next logical development*
OM 8 -30 does several useful things, as recently shown in several languages & health(care) cultures But has 32 items 8 -10 minutes Some clinicians and public health types will expect ultra- short Q-aires to do more than reliability permits So, can an ultra-short form be useful at all ? 42 YES !
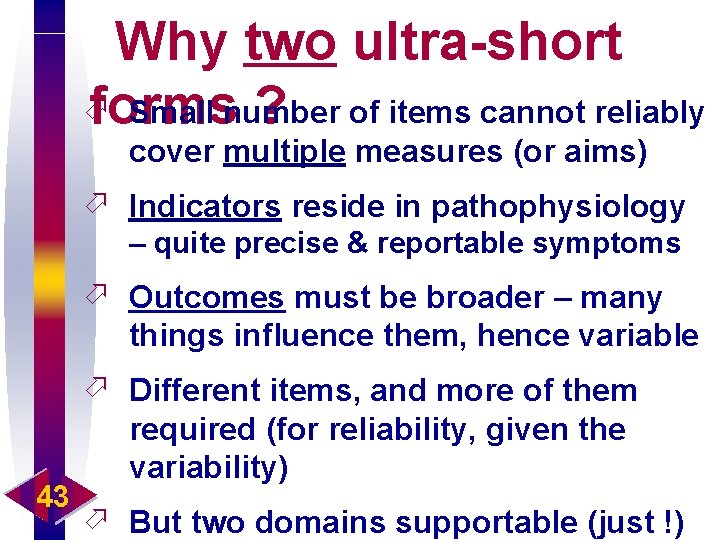
Why two ultra-short ö Small number forms ? of items cannot reliably cover multiple measures (or aims) ö Indicators reside in pathophysiology – quite precise & reportable symptoms ö Outcomes must be broader – many things influence them, hence variable 43 ö Different items, and more of them required (for reliability, given the variability) ö But two domains supportable (just !)
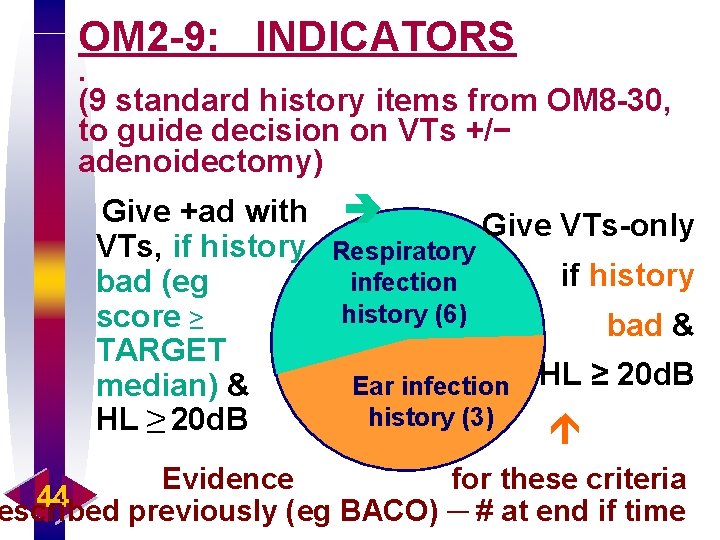
OM 2 -9: INDICATORS. (9 standard history items from OM 8 -30, to guide decision on VTs +/− adenoidectomy) Give +ad with Give VTs-only VTs, if history Respiratory if history infection bad (eg history (6) score ≥ bad & TARGET Ear infection HL ≥ 20 d. B median) & history (3) HL ≥ 20 d. B Evidence for these criteria 44 escribed previously (eg BACO) ─ # at end if time
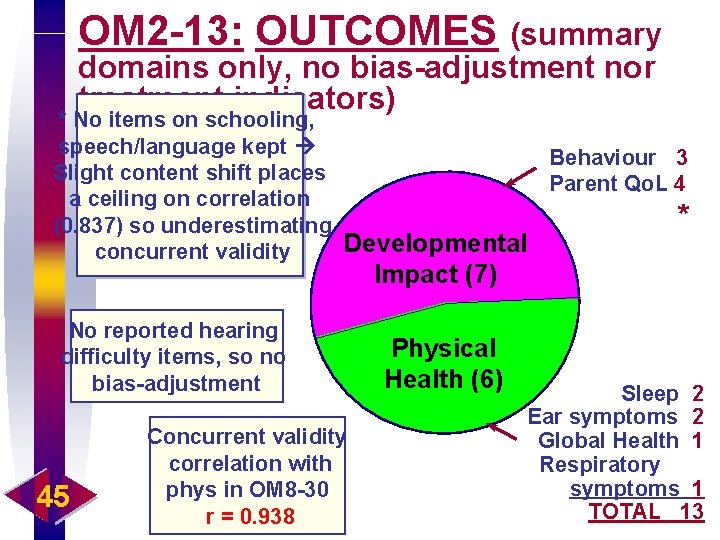
OM 2 -13: OUTCOMES (summary domains only, no bias-adjustment nor treatment indicators) * No items on schooling, speech/language kept Behaviour 3 Slight content shift places Parent Qo. L 4 a ceiling on correlation * (0. 837) so underestimating Developmental concurrent validity Impact (7) No reported hearing difficulty items, so no bias-adjustment 45 Concurrent validity correlation with phys in OM 8 -30 r = 0. 938 Physical Health (6) Sleep 2 Ear symptoms 2 Global Health 1 Respiratory symptoms 1 TOTAL 13
Use of short forms… ……to refine, revise or justify* clinical policies via audit studies 46 *ie not throw out baby with
Audits require such tools ö ‘Ownership’ by interested group of Drs, & PLUS: some incentive to a high participation rate ö Slight resources: – Remind, manage, enter data, convene review – Database tool (existing from OM 8 -30) – We will modify for OM 2 -9 & 2 -13 if demand justifies ö Usually, ethical approval not needed ö Sufficient numbers (ie power calculation needed) 47 ö 1 or more appropriate audit questions, eg: – Is a rule/guideline being followed ? (OM 2 -9 #)
Future prospects for ultra-short forms ö Audit via OM 2 -9 the application of the evidencebased case selection criteria (RAOM, URTI, developmental impact) for grommets, based on TARGET RCT treatment analyses ö Audit service quality via OM 2 -13, but for general quality of outcomes only, as these items were not selected for differential indication ö For both forms, develop further and make more robust the already automated scoring software and evaluate time and errors of manual scoring by professionals ö Develop automated data capture: 48 – Scoring routines (eg optical/magnetic reading) – For many parents in future, on-line administration
Parting shot: given current NHS changes, there may be increased need to ö Research show : base & appropriate tools OM 8 -30 ö The capacity to monitor outcomes – Do hospitals differ in outcomes ? OM 2 -13 – In TARGET, outcomes did differ, but only slightly # – This was due mostly to the rate of discretionary +adenoidectomy (longer-term benefits on HL etc) – Benchmarks for quality useful, implying reference data, even if “patient choice” agenda is not pursued 49 ö The capacity to accurately select patients for the ability to benefit # HL & OM 2 -9
Contact for further information MRC Multi-centre Otitis Media Study Group, Cambridge, UK mark. haggard@mrc-cbu. cam. ac. uk