Maritime Environmental Regulations and Issues Stephanie Jones Stebbins

Maritime Environmental Regulations and Issues Stephanie Jones Stebbins October 12, 2019 CENTER FOR GRADUATE AND CONTINUING EDUCATION 12180 Park Avenue South | Tacoma, WA 98447 | 253 -535 -7722 ce@plu. edu | www. plu. edu/ce

Introductions and overview Why study environmental Issues in the Maritime Industry?

Agenda • Air Quality: IMO, Clean Air Act and • • Community Water Quality: Clean Water Act Case Study: putting it together Trending Issues Looking to the Future

Air Quality IMO, Clean Air Act and Community Concerns

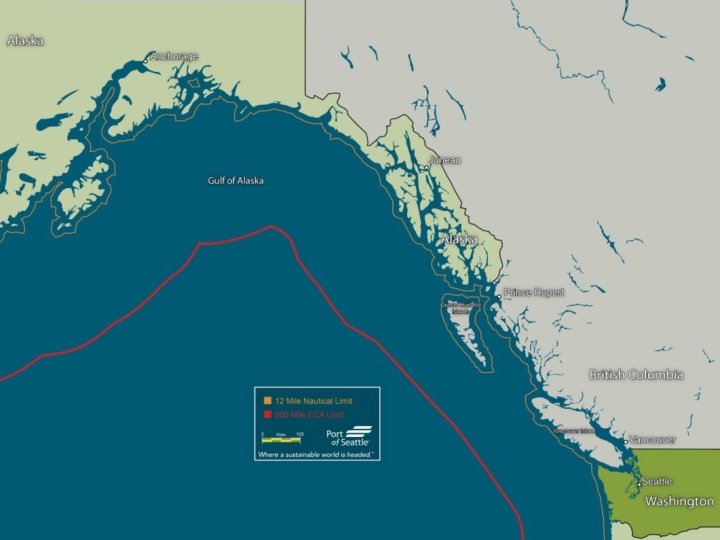
Air Quality a. b. c. d. e. f. Why Care about air quality? Air Emissions associated with industry sectors Reductions since 2005 Regulatory regimes i. International Maritime Organization, Emission Control Area Voluntary Collaboration: Northwest Ports Clean Air Strategy Approaches for different sectors i. iii. iv. v. Ocean Going Vessels Harbor Vessels Trucks Cargo Handling Equipment Rail

Why Care? Cancer Risk related to Air Quality: 78% Diesel 6 Source: Puget Sound Clean Air Agency

2016 Puget Sound Maritime Emission Inventory 9/25/2020 7

Importance of Emissions Inventories • Data collection is the starting place for air quality programs – Can’t manage what you don’t measure • Demonstrates our commitment to transparency • Tracks progress towards goals • Helps prioritize emission reduction programs and policies – Allows emission reductions, environmental benefits, and societal benefits to be weighed against cost – Identifies areas where emissions are greatest and where they are easiest to control 8

Puget Sound Maritime Air Forum The Air Forum is a partnership between Ports, government agencies, and industrial partners. • • • The Northwest Seaport Alliance Port of Anacortes Port of Everett Port of Olympia Port of Port Angeles Port of Tacoma Port of Seattle Northwest Clean Air Agency Puget Sound Regional Council • U. S. Environmental Protection Agency (EPA) • Washington State Department of Ecology • Washington State Department of Transportation • North West and Canada Cruise Association • Pacific Merchant Shipping Association • Western States Petroleum Association 9
 Cargo Handling Equipment (CHE) Locomotives")
Source Categories • • • Ocean Going Vessels (OGV) Cargo Handling Equipment (CHE) Locomotives Harbor Vessels Trucks Fleet Vehicles 10
 Emissions in tons per year 112")
Puget Sound wide Maritime Diesel Particulate Matter (DPM) Emissions in tons per year 112 49 2005 - 2011 - 2016 COMPARISON 1, 336 67 6 46 29 85 1076 5 274 61 17 178 32 5 230 2005 Total - 1, 842 tpy 2011 Total - 1, 515 tpy 2016 Total - 524 tpy LEGEND Ocean-Going Vessels Commercial Harbor Vessels Recreational Vessels Locomotives Cargo-Handling Equipment Trucks

What’s Made the Difference? • Regulations • Voluntary Actions

IIMO Sulphur limits by percent

Northwest Ports Clean Air Strategy • Port of Tacoma, Seattle, NWSA, and Vancouver created strategy jointly – Create level playing field between the ports • Sets goals for overall emission reductions: – 80% of Diesel particulate matter per ton of cargo by 2020 – 15% of GHG per ton of cargo by 2020 • Set sector specific goals for – – – 9/25/2020 Ocean Going Vessels Harbor vessels Cargo handling equipment Heavy duty on-road trucks Locomotives Administration 15

Northwest Ports Clean Air Strategy • In 2007, ports voluntarily and proactively decided to create a framework for quantifying and addressing air quality impacts • Puget Sound Maritime Air Emissions Inventory (PSEI) • First in 2007 for model year 2005 (baseline) • Northwest Ports Clean Air Strategy (NWPCAS) • First iteration published in 2008 2007: First PSEI (2005) 2008: First NWPCAS 2012: PSEI Update (2011) 2013: NWPCAS Update 2018: PSEI Update (2016) Present: NWPCAS Update 16

NWPCAS Commitment in 2013 REDUCE Diesel Particulate Matter Green House Gasses 75% by 2015 80% by 2020 10% by 2015 15% by 2020 In the Process of Updating following 2016 inventory

NWPCAS Targets 9/25/2020 18

30 120% 100% 28 80% 26 60% 24 40% 22 20% Cargo Throughput (M Tons) Emissions Intensity Relative to 2005 NWSA Progress Towards NWPCAS Goals 20 0% 2005 Cargo 2011 CO 2 2016 DPM • Goals: Reduce DPM by 80% and GHG by 15% per ton of cargo by 2020. • Results of 2016 Inventory show that goals have been met 19

GHG Emission Distributions 2005 21% 27% 762, 069 Tons 9% 2016 Down 16% 118, 393 tons 643, 676 Tons 55% 7% 11% 3% 10% 4% 52%

GHG Reduction Targets • Port of Seattle – Scope 1 and 2: 50% by 2030, Carbon Neutral by 2050 – Scope 3: 50% by 2030, 80% by 2050 • International Maritime Organization has goal of Carbon Neutral by 2050 • Consistent with Paris Accord

Ocean Going Vessels Regulatory: • IMO • California Voluntary Efforts • Fuel Switching • Shorepower • Slow Steaming

At Berth Clean Fuels TARGET: • Early adoption of IMO standards (reduced sulfur content in fuel) SUCCESSES: • Financial incentive for ships burning lower sulfur fuel while at berth (2009 - 2014) • Enrollment, reporting and • verification required • Avoided over 850 MT of SO 2 emissions

ABC Fuels Past Participants APL COSCO Evergreen Line Hamburg Süd Hapag-Lloyd Celebrity Cruises Maersk Line Norwegian Cruise Lines Matson Navigation Princess Cruises OOCL Royal Caribbean International

Leveraging Technology • Installed shore power at two cruise berths • Helped fund first sea water scrubbers 9/25/2020 www. portseattle. org 25

Recognition: Green Gateway Partners Awards TARGET: • Superior environmental performance of cruise & container ship operators SUCCESS: • 5 years of annual GGP Awards • criteria updated annually (must be in ABC Fuels or use shore power) • 3 rd party review/validation

Green Gateway Partners Past Winners APL COSCO Matson Navigation Maersk Lines Celebrity Cruise Holland America Lines Norwegian Cruise Lines Princess Cruises Royal Caribbean Tay Yoshitani (L), Port of Seattle CEO presents the platinum Green Gateway Award to Holland America Line’s Mike Inman, Vice President Safety, Environmental & Management Systems (2014)

What are the Clean Truck Program targets? Phase 1: Required container trucks to have model year 1994 engines by 1/1/2011 Phase 2: Requires container trucks to have model year 2007 engines

Sc. RAPS Program • Seaport Truck Scrappage and Replacements for Air in Puget Sound Sc. RAPS 1 Sc. RAPS 2 289 Trucks Scrapped 320 -370 Trucks Scrapped

Improving truck efficiencies • Expand RFID program to Tacoma terminals to assist in reducing truck turn times • Explore drayage trucking solutions to deliver shorter truck turn times • Pilot truck wait time measurement technologies • Implement Heavy Haul Corridor in Seattle • Implement Tacoma Tideflats Intelligent Transportation System Plan 9/25/2020 30

CLEANER TECHNOLOGIES Target: drayage trucks to have model year 2007 or newer engines • Continue truck scrapping/replacement program • Continue researching alternative fuels and retrofits that meet MY 2007 engine equivalent emissions 9/25/2020 31

Cargo Handling Equipment Ship to Shore Gantry Cranes Yard Equipment • New Equipment: “Tier 4” • After market solutions: DPFs • Cleaner Fuels • Electrification: Rail Mounted Gantry Cranes

Rail and Harbor Craft New Engines: Grant funding Cleaner Fuels

Water Quality: Clean Water Act Stormwater, Vessel General Permit, Wastewater

Water Quality: Why do we care? Health of Puget Sound: Orcas and Salmon Citizen suits Compliance with the law

Water Quality: • NPDES Permits: Industrial and Municipal • a survey of nationwide Ports
 ISGP Permits (65%) – 18 Tenant")
Permit Coverage Phase I Municipal Stormwater Permit (34%) ISGP Permits (65%) – 18 Tenant Permits – 2 Port Permits – Covering 700 Acres Other SEA/RE NPESP Permits – Individual, Boatyard, Construction 37

ISGP – Tenants T-46: Port installed Up-flo on 3 of 4 outfalls / ~80 acres • Appling structural and operational BMPS throughout the site. T-18: Due to high number of outfalls (20) / ~200 acres: • Modular Wetland System and roof down spout treatment at source locations • Appling structural and operational BMPS throughout the site T-5: Unknown treatments needed ~160 acres • 14 Outfalls T-115: Chitosan treatment system on 2 of 5 outfalls / ~70 acres • Appling structural and operational BMPs throughout the site. Also Treatment needed at: • T 104, T 106, T 108, T 25 & T 30 38

ISGP Cycle Time WA State Standards: most stringent in the country AND fastest to comply. – If baseline requirements are exceeded in Washington State, action must be taken within 1 Quarter. If baseline exceeded Level 1: Operational e. g. Sweeping $ Level 2: Structural e. g. Covering storage areas $$ Level 3: Treatment e. g. Chitosan or Up-flo $$$ 39

ISGP Thresholds WA State ISGPs contain the most stringent requirements in the country for Zinc & Copper. Corrective Action Threshold Limits Copper Zinc micrograms per liter 33. 2 260 120 20 on eg Or . r. . ifo Ca l as h i. . . 14 W on eg Or . r. . ifo Ca l W as h i. . . 117 40

Port Survey Participants Port of Everett Port of Seattle Port of Tacoma East Coast Ports Port of Portland Port Authority of NY/NJ Port of Baltimore West Coast Ports Port of Los Angeles Jaxport Port Canaveral Port of Houston Port Everglades Port of Corpus Christi Gulf Coast Ports 41

Coverage by municipal permit West Coast Ports 20% No East Coast Ports 20% Yes Gulf Coast Ports 80% Yes 80% No 100% Yes 42

Industrial Permit Coverage West Coast Ports 100% Yes East Coast Ports Gulf Coast Ports 20% No 80% Yes 100% Yes 43

Ports and/or tenants required to meet enforceable effluent limits. West Coast Ports 40% No East Coast Ports Gulf Coast Ports 60% Yes 40% No 60% Yes 100% Yes 44

Ports that receive copies/updates to tenants’ SWPPPs. West Coast Ports 40% Yes East Coast Ports 20% No Gulf Coast Ports 60% No 80% Yes 100% Yes 45

Ports that have tariffs and lease contract language that require tenants' compliance with port's SWPPP. West Coast Ports 40% Yes East Coast Ports 20% No Gulf Coast Ports 60% No 80% Yes 100% Yes 46

Is Port or tenant responsible for selection, design, installation and/or maintenance of treatment devices or other BMPs? East Coast Ports West Coast Ports Both 20% Tenant 40% Both 60% Gulf Coast Ports Port 80% Both 100% 47

Port has participated in verification and testing of new treatment technology. West Coast Ports 40% No East Coast Ports 20% Yes Gulf Coast Ports 60% Yes 80% No 100% No 48

Port is subject to Total Maximum Daily Loads, TMDLs. West Coast Ports 40% Yes East Coast Ports 20% Yes Gulf Coast Ports 60% No 80% No 50% Yes 49

Terminal 46 Stormwater Treatments 50

Terminal 91 Stormwater Treatments

Stormwater quality improvements • • • 1 acre Industrial parking lot with a stormwater permit and copper bench marks. Catch basins were filled with Oyster shells. Water flows to the bottom of the catch basin and up through the shells Meeting 14 ppb benchmark for copper Source of copper – roadway above facility Copper attaches to the oyster shells replacing the calcium molecules

Responsible Dock Maintenance Vacuum Scrubber

Salmon Safe Certification at Port Parks

Water Quality and Vessels Wastewater Memorandum of Agreement No Discharge Zone Ballast Water Invasive Species IMO and VIDA Exhaust Gas Cleaning Systems

Wastewater The Ruby Princess’ weekly provisions include 23, 000 eggs 9/25/2020 Bell Street Pier Cruise Ter Pier 66 1600 lbs. Seafood www. portseattle. org 147, 550 lbs. fresh produce Smith Cove Cruise Termi Pier 91 56
 was originally signed on April 20,")
Collaborative Partnerships • A Memorandum of Understanding (MOU) was originally signed on April 20, 2004, between – Washington State Department of Ecology – Cruise Lines International Association North West & Canada (CLIA-NWC) – Port of Seattle • Incudes stringent standards for wastewater discharge and unprecedented transparency Department of Ecology MOU 9/25/2020 www. portseattle. org 57

No Discharge Zone • • Went into effect in May 2018 Applies to treated and untreated discharges. Five-year grace Period for tugboats and commercial fishing vessels Port is unique amongst public agencies for our understanding of maritime operations. • Played a role in securing a five-year grace period to No Discharge Zone

Ballast Water: Aquatic Invasive Species • • Programs are focused ballast water Example of the Zebra mussel in the Great Lakes • estimated $5 billion cost to businesses and the community

Ballast Water: Regulatory Approach • • • Shifting focus from open ocean exchange to on-board treatment Regulatory scheme presently in flux • Struggle between USCG and EPA • Struggle between desire for uniform standards across the nation versus states rights Complicating matters even more is new science suggesting that biofouling poses an equal threat as ballast water

Case Study: Putting it all together Port Air and Water issues are complex with multiple stakeholders to satisfy: You will look for solutions to an Environmental issue, representing one of the following: • Port Representative • Port Neighbor/Environmental Activist • Ship Owner/Shipping Line representative

Trending Issues What are the key environmental issues on the horizon?

Trending Issues Derelict Vessels Environmental Justice Sustainability and Climate Change

Derelict Vessels • Environmental manages the custody process and disposal of derelict/abandoned vessels utilizing both RCW 53. 08 and RCW 79. 100. • Over 14 Derelict Vessels at FT since 2008 • Spent Over $250 k for custody, removal and/or disposal. • Cost recovery is variable but have requested reimbursement for $238, 457. 02 for FT Vessels. – To Date we have received approximately $108, 472. 46 on FT Vessels.

FT_Rustler Initial Spills Response to Rustler Sinking Rustler coming out of the water.

FT_Rustler-Cont. Rustler positioning landside Rustler on the West Wall

FT_Gary’s Illusion

FT_Gary’s Illusion – Cont.

Environmental Justice Nationwide issues with impacts of goods movement on local communities

Why Duwamish Valley? Indicator Georgetown/South Park Census tracts 109 and 112 Laurelhu Seattle rst Census tracts 4100 and 4200 King County Life expectancy at birth (years) 73. 3* 86. 4* 81. 5 Heart disease death rate per 100, 000 202. 9# 89. 6* 138. 4 137. 8 Source: Public Health Seattle & King County *p=0. 05 from both KC and Seattle average #p= 0. 05 for KC average only South Park and Georgetown are environmental justice communities experiencing significant disparities 70

71

EPA EJ Pilot Project The project aims to improve: • environmental health outcomes for communities affected by ports and associated goods movement facilities • environmental performance at ports • communication and engagement with near-port communities Robust dialog with the community with a focus on their unique issues from port operations “permission to grow” 72

Project elements • 1 year of technical assistance • Port contract with Just Health Action • Local hire of community specialists • “Listening sessions” • EPA Ports Initiative Toolkit • Exploration of innovative solutions – Good Neighbor Strategic Plan – Community Benefits Agreement Port partnerships are key to project success 73

Community-Port collaboration • Georgetown and South Park residents have provided a list of concerns • Port will assess what issues are feasible and within Port authority to influence Community concerns include environmental health, access to jobs, and more 74

What are the outcomes? • Improved relations with near-Port communities • Lessons learned for application Port-wide • Preparation for social equity policy • Stronger accountability and transparency • Model for the nation 75

Sustainability and Climate Change Already covered, but urgency increasing dramatically. Increasing focus both locally and globally World Ports Climate Action Program • Increasing the efficiency of supply chains using data technology; • Increasing the use of renewable energy to power ships when they are in port; • Powering cargo-handling equipment with renewable energy; • And decarbonizing ship fuels. World Ports Sustainability Program (WPSP) World Ports Climate Initiative broadened to include 17 indicators

Trending Issues: Class discussion • What other issues should we be concerned about? • Which emerging issues concern you most • What should the Maritime Industry be doing to prepare?

CENTER FOR GRADUATE AND CONTINUING EDUCATION 12180 Park Avenue South | Tacoma, WA 98447 | 253 -535 -7722 ce@plu. edu | www. plu. edu/ce
- Slides: 78