
Marine pollution Definition Introduction of man directly or

- Slides: 44
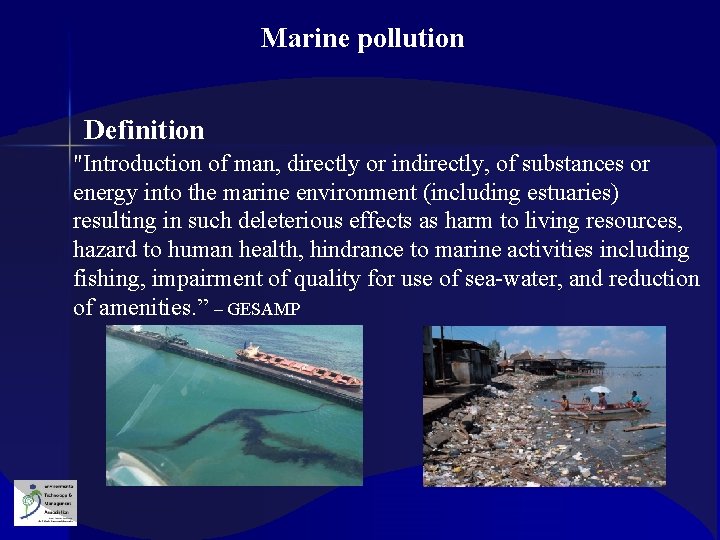
Marine pollution Definition "Introduction of man, directly or indirectly, of substances or energy into the marine environment (including estuaries) resulting in such deleterious effects as harm to living resources, hazard to human health, hindrance to marine activities including fishing, impairment of quality for use of sea-water, and reduction of amenities. ” – GESAMP
Marine pollution General impacts Ø Ø Ø Ø Impacts on living resources Hazards to human health Hindrance to marine activities Impairment of quality of seawater Reduction of amenities Loss of aesthetic beauty Impacts on the sensitive habitats Contd. .
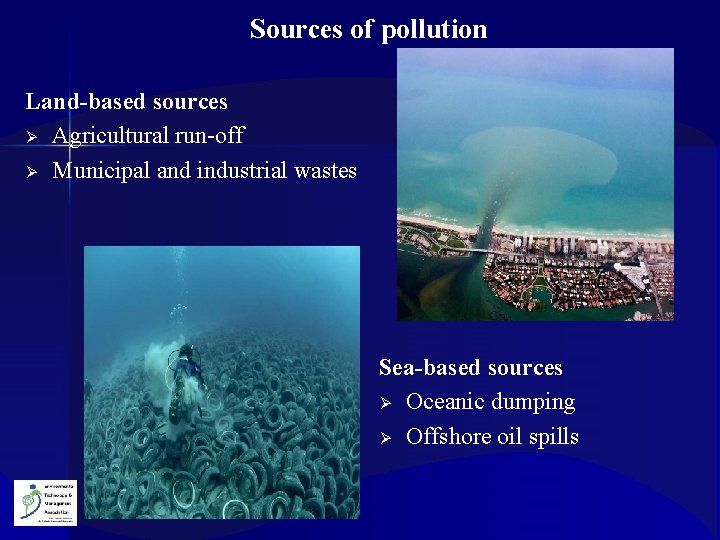
Sources of pollution Land-based sources Ø Agricultural run-off Ø Municipal and industrial wastes Sea-based sources Ø Oceanic dumping Ø Offshore oil spills
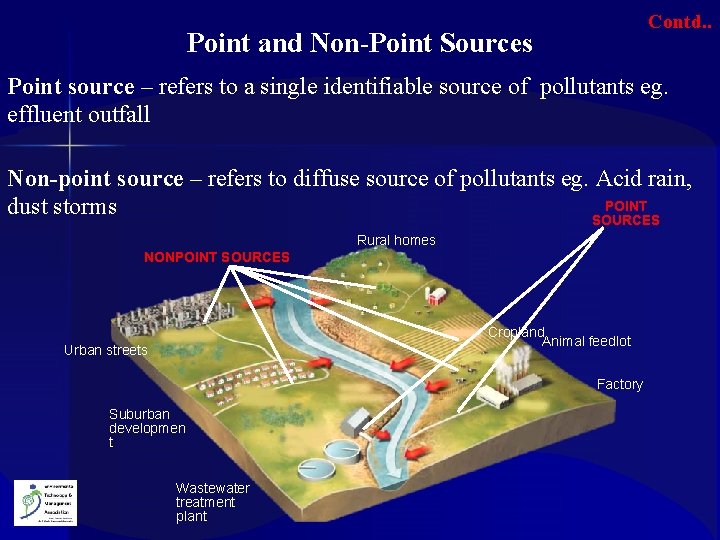
Contd. . Point and Non-Point Sources Point source – refers to a single identifiable source of pollutants eg. effluent outfall Non-point source – refers to diffuse source of pollutants eg. Acid rain, POINT dust storms SOURCES Rural homes NONPOINT SOURCES Cropland Animal feedlot Urban streets Factory Suburban developmen t Wastewater treatment plant
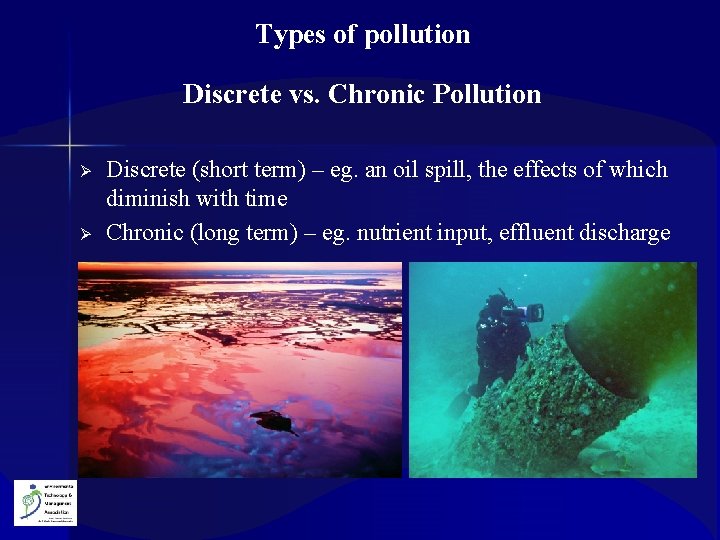
Types of pollution Discrete vs. Chronic Pollution Ø Ø Discrete (short term) – eg. an oil spill, the effects of which diminish with time Chronic (long term) – eg. nutrient input, effluent discharge
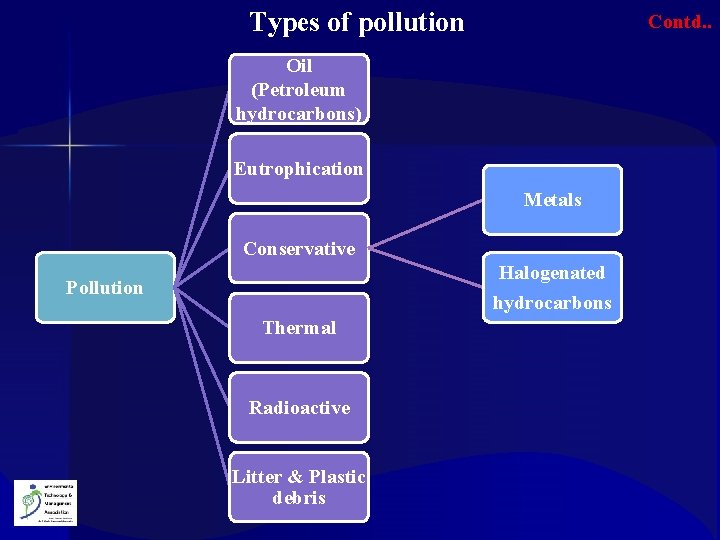
Types of pollution Contd. . Oil (Petroleum hydrocarbons) Eutrophication Metals Conservative Halogenated hydrocarbons Pollution Thermal Radioactive Litter & Plastic debris
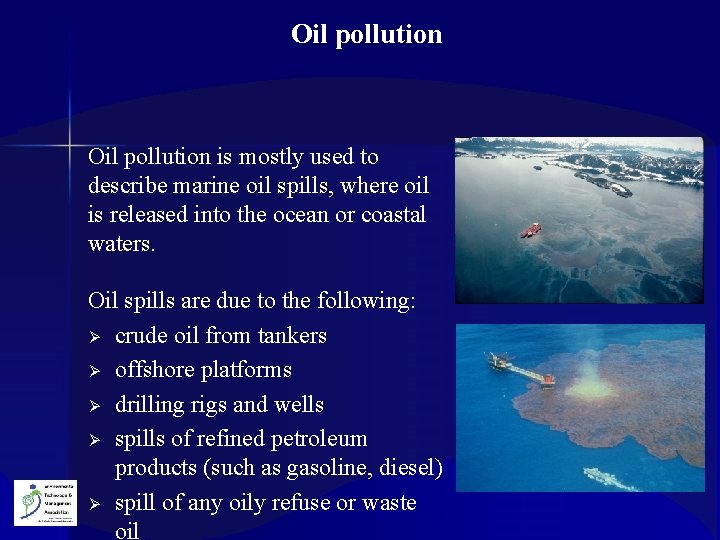
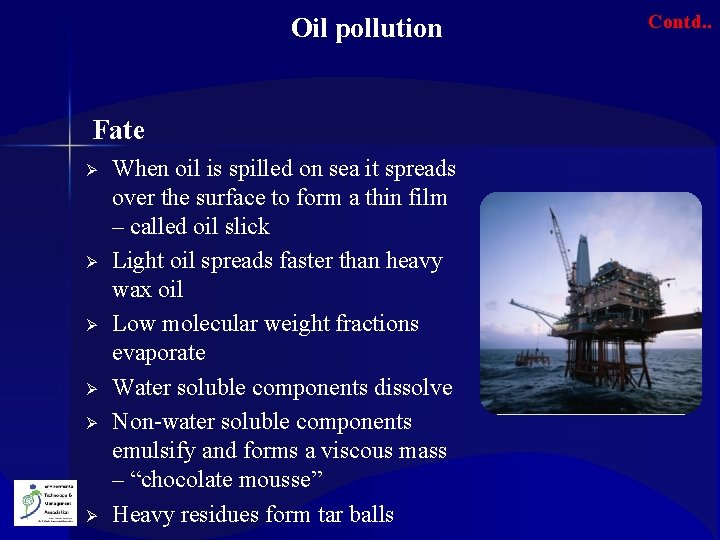
Oil pollution is mostly used to describe marine oil spills, where oil is released into the ocean or coastal waters. Oil spills are due to the following: Ø crude oil from tankers Ø offshore platforms Ø drilling rigs and wells Ø spills of refined petroleum products (such as gasoline, diesel) Ø spill of any oily refuse or waste oil
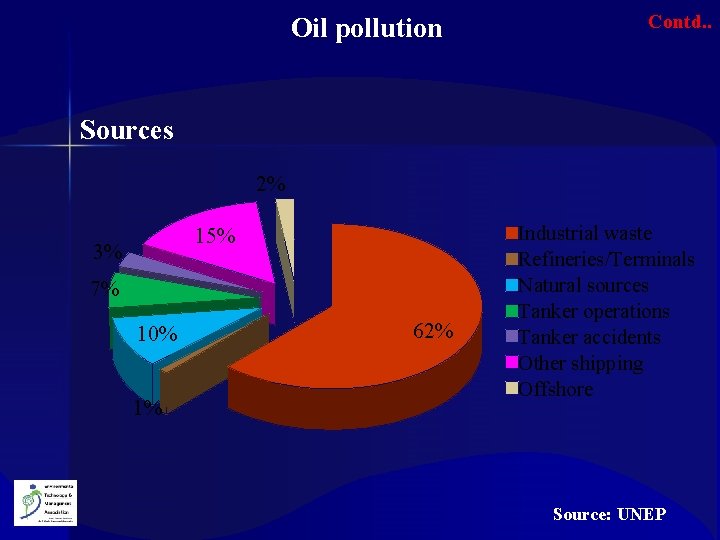
Oil pollution Contd. . Sources 2% 15% 3% 7% 10% 1% 62% Industrial waste Refineries/Terminals Natural sources Tanker operations Tanker accidents Other shipping Offshore Source: UNEP
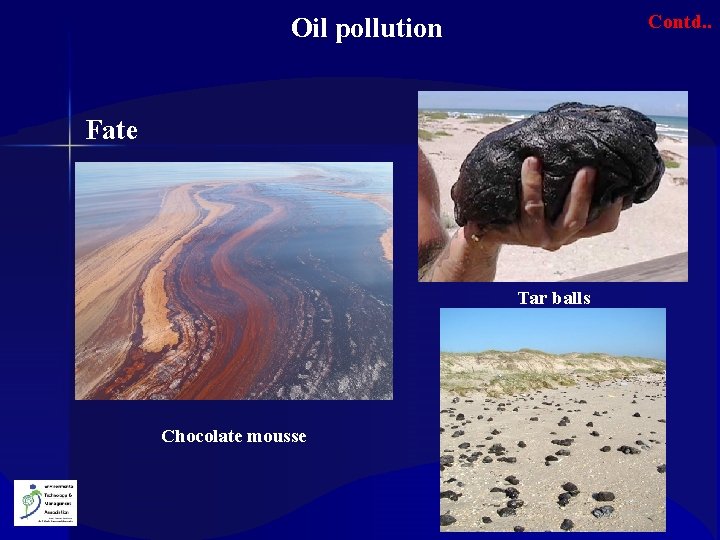
Oil pollution Fate Ø Ø Ø When oil is spilled on sea it spreads over the surface to form a thin film – called oil slick Light oil spreads faster than heavy wax oil Low molecular weight fractions evaporate Water soluble components dissolve Non-water soluble components emulsify and forms a viscous mass – “chocolate mousse” Heavy residues form tar balls Contd. .
Contd. . Oil pollution Fate Tar balls Chocolate mousse
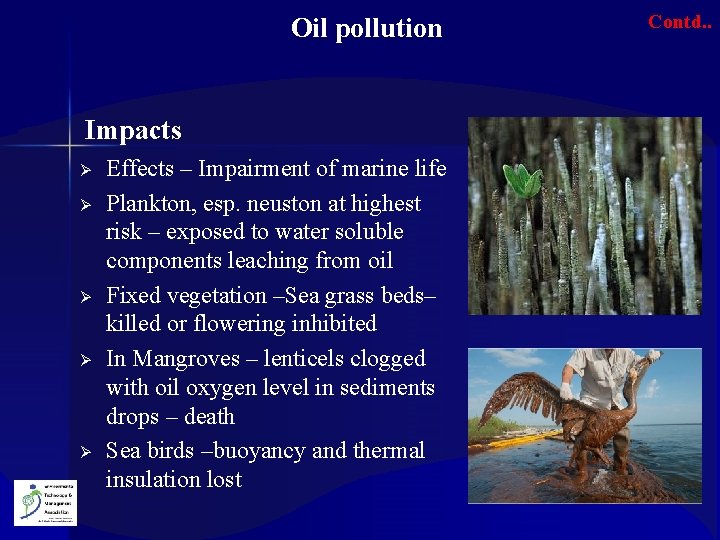
Oil pollution Impacts Ø Ø Ø Effects – Impairment of marine life Plankton, esp. neuston at highest risk – exposed to water soluble components leaching from oil Fixed vegetation –Sea grass beds– killed or flowering inhibited In Mangroves – lenticels clogged with oil oxygen level in sediments drops – death Sea birds –buoyancy and thermal insulation lost Contd. .
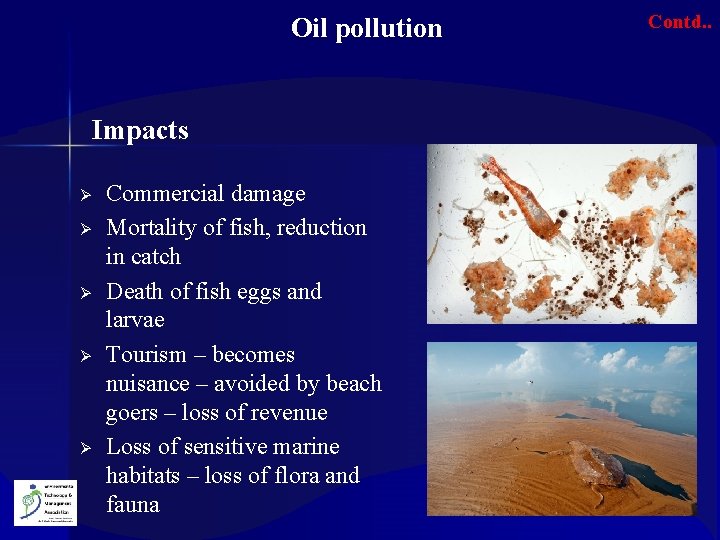
Oil pollution Impacts Ø Ø Ø Commercial damage Mortality of fish, reduction in catch Death of fish eggs and larvae Tourism – becomes nuisance – avoided by beach goers – loss of revenue Loss of sensitive marine habitats – loss of flora and fauna Contd. .
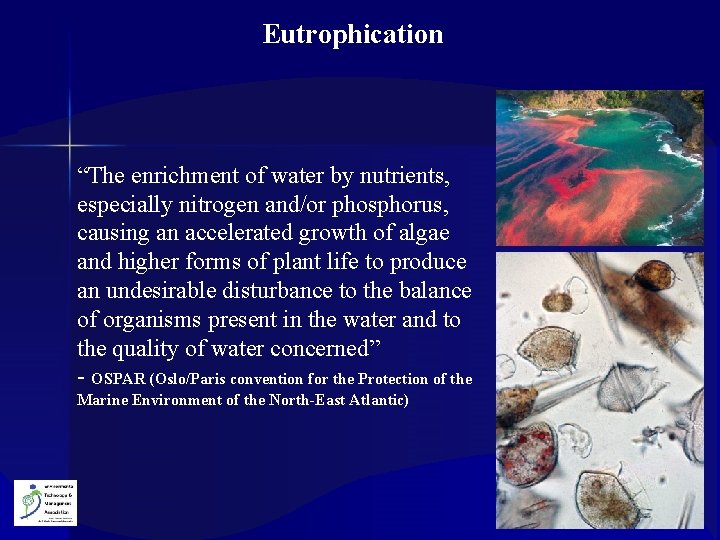
Eutrophication “The enrichment of water by nutrients, especially nitrogen and/or phosphorus, causing an accelerated growth of algae and higher forms of plant life to produce an undesirable disturbance to the balance of organisms present in the water and to the quality of water concerned” - OSPAR (Oslo/Paris convention for the Protection of the Marine Environment of the North-East Atlantic)
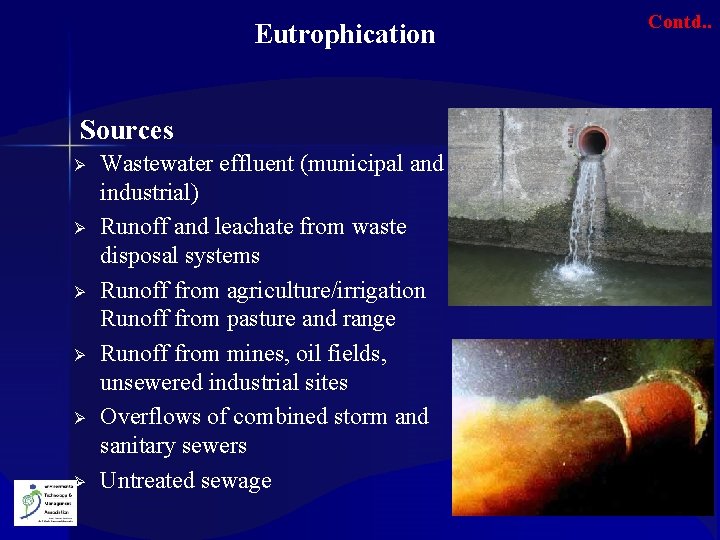
Eutrophication Sources Ø Ø Ø Wastewater effluent (municipal and industrial) Runoff and leachate from waste disposal systems Runoff from agriculture/irrigation Runoff from pasture and range Runoff from mines, oil fields, unsewered industrial sites Overflows of combined storm and sanitary sewers Untreated sewage Contd. .
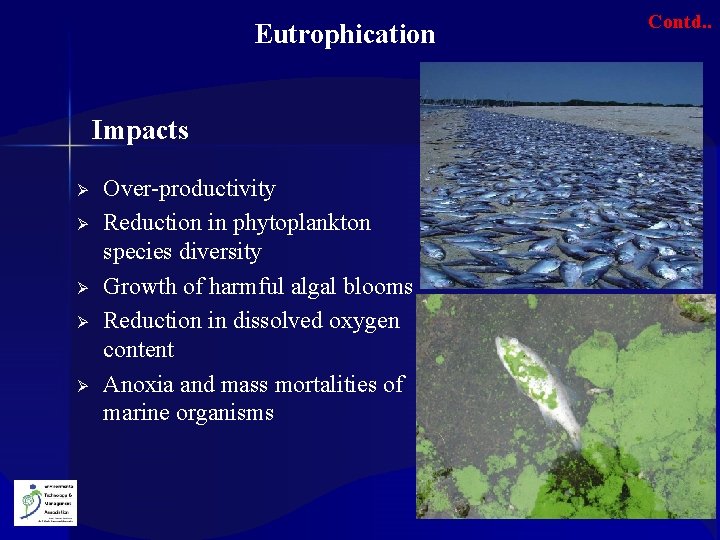
Eutrophication Impacts Ø Ø Ø Over-productivity Reduction in phytoplankton species diversity Growth of harmful algal blooms Reduction in dissolved oxygen content Anoxia and mass mortalities of marine organisms Contd. .
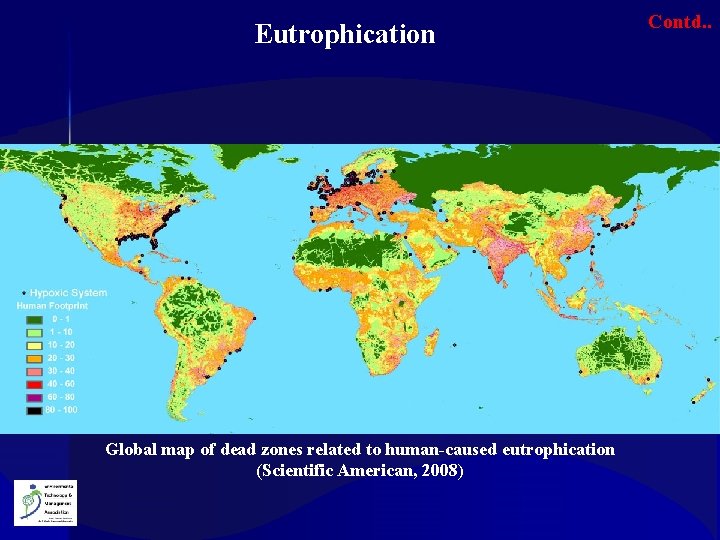
Eutrophication Global map of dead zones related to human-caused eutrophication (Scientific American, 2008) Contd. .
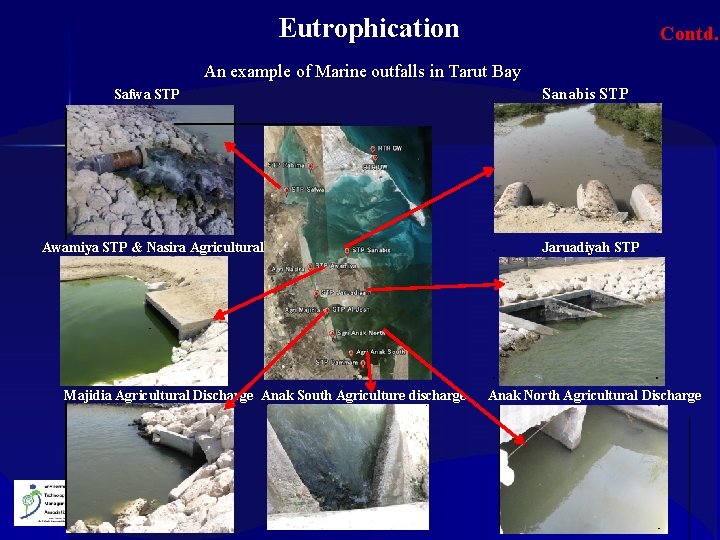
Eutrophication Contd. . An example of Marine outfalls in Tarut Bay Sanabis STP Safwa STP Awamiya STP & Nasira Agricultural Jaruadiyah STP Majidia Agricultural Discharge Anak South Agriculture discharge Anak North Agricultural Discharge
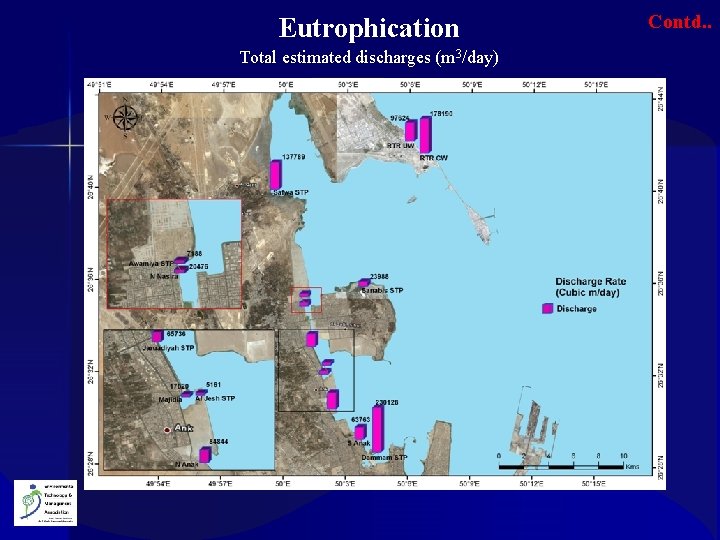
Eutrophication Total estimated discharges (m 3/day) Contd. .
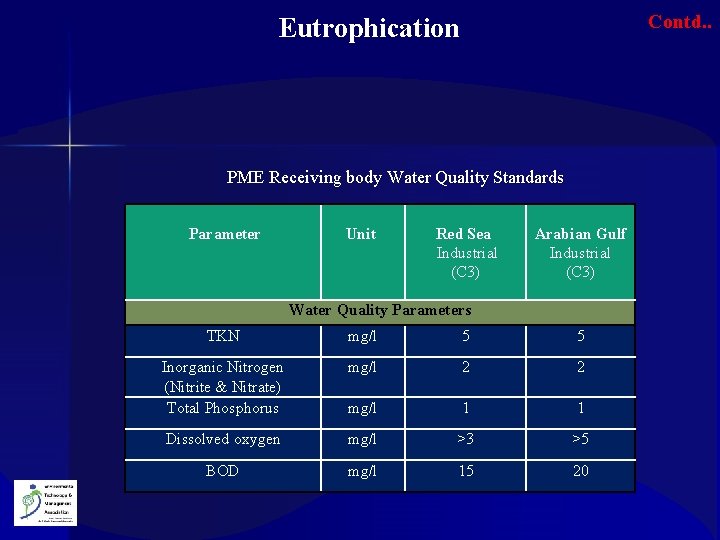
Contd. . Eutrophication PME Receiving body Water Quality Standards Parameter Unit Red Sea Industrial (C 3) Arabian Gulf Industrial (C 3) Water Quality Parameters TKN mg/l 5 5 Inorganic Nitrogen (Nitrite & Nitrate) Total Phosphorus mg/l 2 2 mg/l 1 1 Dissolved oxygen mg/l >3 >5 BOD mg/l 15 20
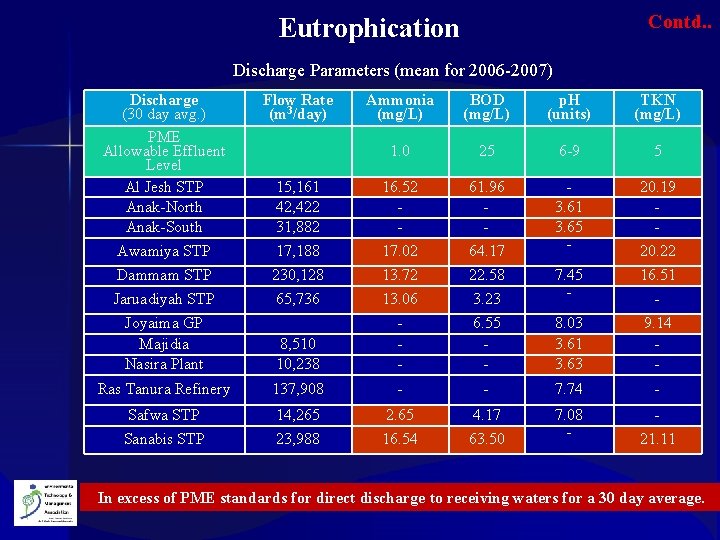
Contd. . Eutrophication Discharge Parameters (mean for 2006 -2007) Discharge (30 day avg. ) PME Allowable Effluent Level Al Jesh STP Anak-North Anak-South Flow Rate (m 3/day) Ammonia (mg/L) BOD (mg/L) p. H (units) TKN (mg/L) 1. 0 25 6 -9 5 15, 161 42, 422 31, 882 16. 52 - 61. 96 - 20. 19 - Awamiya STP 17, 188 17. 02 64. 17 3. 61 3. 65 - Dammam STP 230, 128 13. 72 22. 58 16. 51 Jaruadiyah STP 65, 736 13. 06 3. 23 7. 45 - Joyaima GP Majidia Nasira Plant 8, 510 10, 238 - 6. 55 - 8. 03 3. 61 3. 63 9. 14 - Ras Tanura Refinery 137, 908 - - 7. 74 - Safwa STP 14, 265 2. 65 4. 17 - Sanabis STP 23, 988 16. 54 63. 50 7. 08 - 20. 22 - 21. 11 In excess of PME standards for direct discharge to receiving waters for a 30 day average.
Conservative pollutants - Metals Ø A heavy metal is a member of a loosely-defined subset of elements that exhibit metallic properties. Ø It mainly includes the transition metals, some metalloids, lanthanides, and actinides. Ø There is an alternative term for heavy metal and is called as toxic metal The major sources of metals are: Ø Natural sources Ø Manmade sources Ø
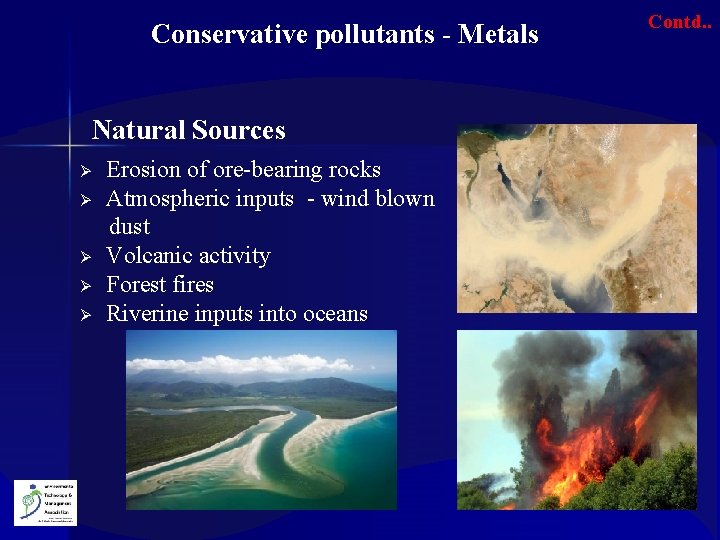
Conservative pollutants - Metals Natural Sources Ø Ø Ø Erosion of ore-bearing rocks Atmospheric inputs - wind blown dust Volcanic activity Forest fires Riverine inputs into oceans Contd. .
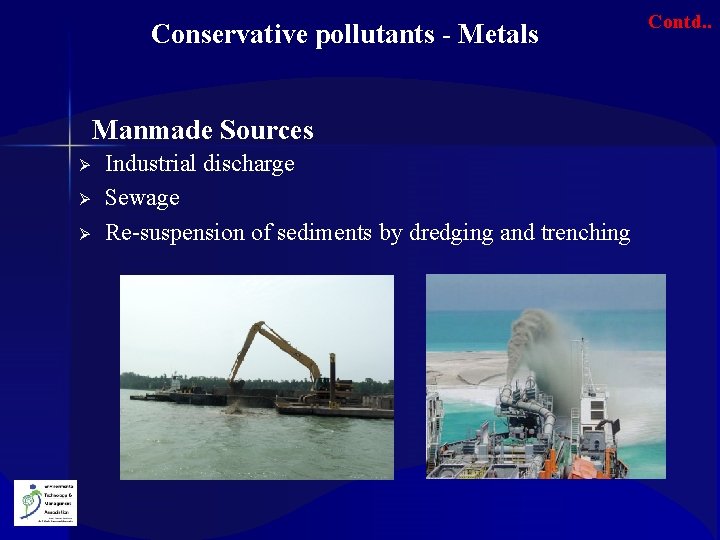
Conservative pollutants - Metals Manmade Sources Ø Ø Ø Industrial discharge Sewage Re-suspension of sediments by dredging and trenching Contd. .
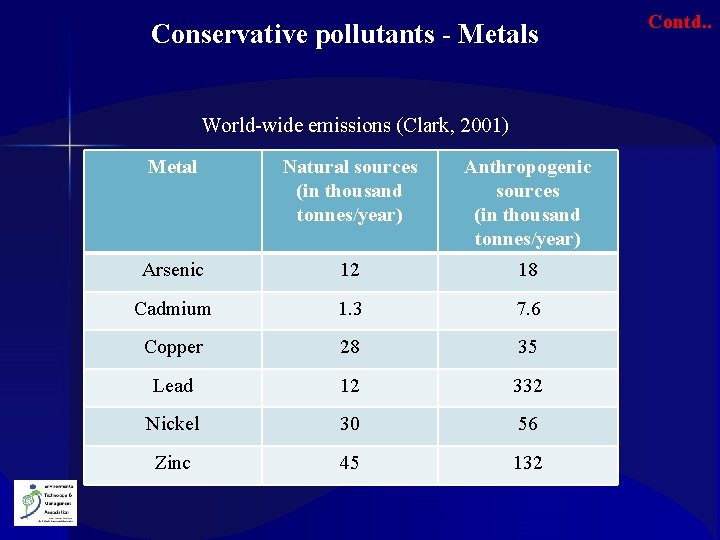
Conservative pollutants - Metals World-wide emissions (Clark, 2001) Metal Natural sources (in thousand tonnes/year) Anthropogenic sources (in thousand tonnes/year) Arsenic 12 18 Cadmium 1. 3 7. 6 Copper 28 35 Lead 12 332 Nickel 30 56 Zinc 45 132 Contd. .
Conservative pollutants - Metals Impacts Arsenic (As) Ø Phytoplankton most sensitive & accumulate from water column Ø Higher trophic levels accumulate via food. Cadmium (Cd) Ø Divalent cadmium is more toxic Ø Tends to bioaccumulate Lead (Pb) Ø Forms strong complex with clay and suspended material Ø Bioaccumulates in most marine organisms – no significant problems. Contd. .
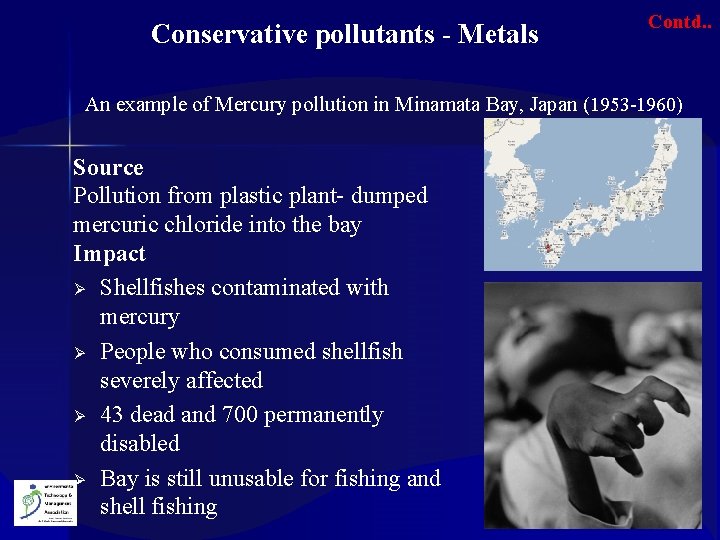
Conservative pollutants - Metals Contd. . An example of Mercury pollution in Minamata Bay, Japan (1953 -1960) Source Pollution from plastic plant- dumped mercuric chloride into the bay Impact Ø Shellfishes contaminated with mercury Ø People who consumed shellfish severely affected Ø 43 dead and 700 permanently disabled Ø Bay is still unusable for fishing and shell fishing
Impacts of metal pollution by Bioaccumulation and Biomagnification
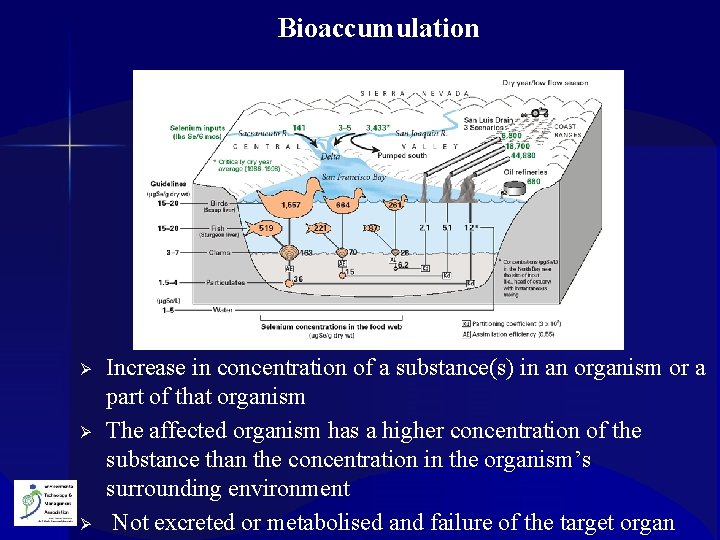
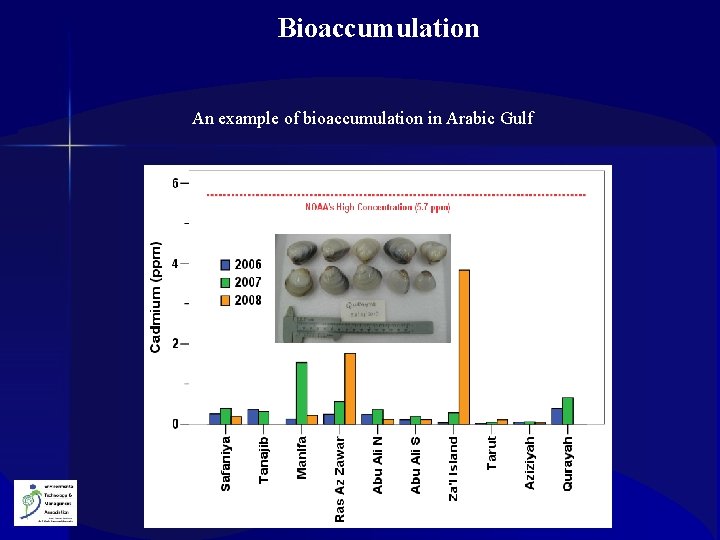
Bioaccumulation Ø Ø Ø Increase in concentration of a substance(s) in an organism or a part of that organism The affected organism has a higher concentration of the substance than the concentration in the organism’s surrounding environment Not excreted or metabolised and failure of the target organ
Bioaccumulation An example of bioaccumulation in Arabic Gulf
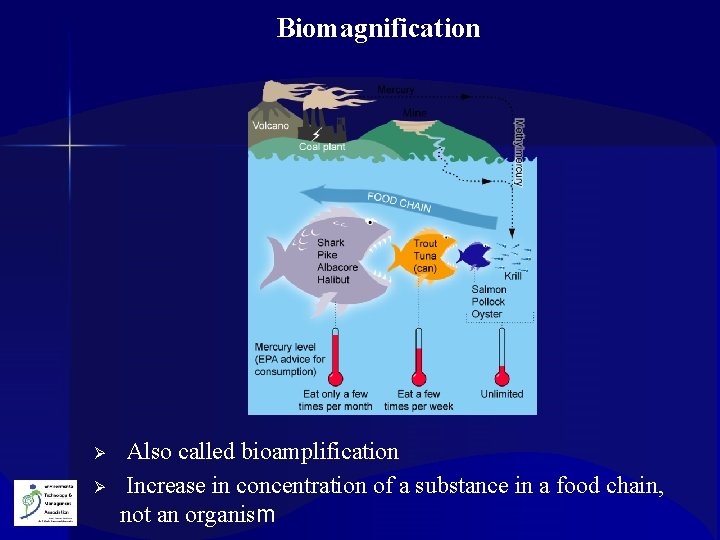
Biomagnification Ø Ø Also called bioamplification Increase in concentration of a substance in a food chain, not an organism
Conservative pollutants – Halogenated hydrocarbons Ø Hydrocarbons containing chlorine, fluorine, bromine or iodine Ø Differs from petroleum hydrocarbons – not degraded by chemical oxidation or by bacteria Ø Low molecular weight compounds – eg. , Dichloroethane, Freons etc. High molecular weight compounds – eg. , DDT, Drins, PCBs Ø
Contd. . Conservative pollutants – Halogenated hydrocarbons Sources Aerial transport Ø Aerial spraying of pesticides as aerosols – travel great distances Freshwater inputs Ø Rain washing of pesticides carried into sea by rivers Ø Silt from flood Direct inputs Ø By industrial outfalls – especially by Pesticide manufacturing companies.
Contd. . Conservative pollutants – Halogenated hydrocarbons Impacts Ø Low solubility in water persist for long durations Ø Fat-soluble , so incorporated into the tissue of marine organisms and sediments Ø Lethal to the animal Ø Possibility of transmission through food webs – established in a number of animals
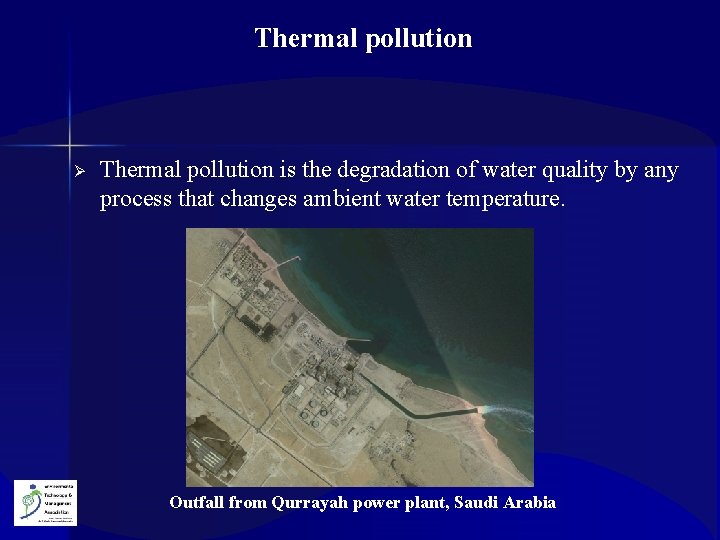
Thermal pollution Ø Thermal pollution is the degradation of water quality by any process that changes ambient water temperature. Outfall from Qurrayah power plant, Saudi Arabia
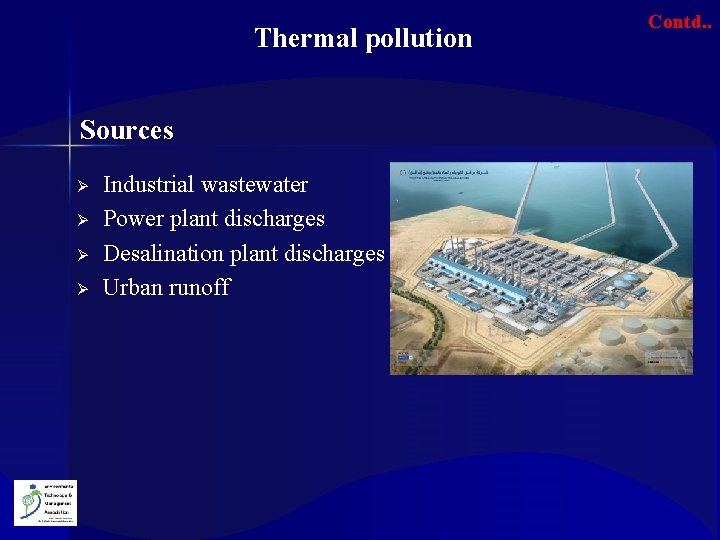
Thermal pollution Sources Ø Ø Industrial wastewater Power plant discharges Desalination plant discharges Urban runoff Contd. .
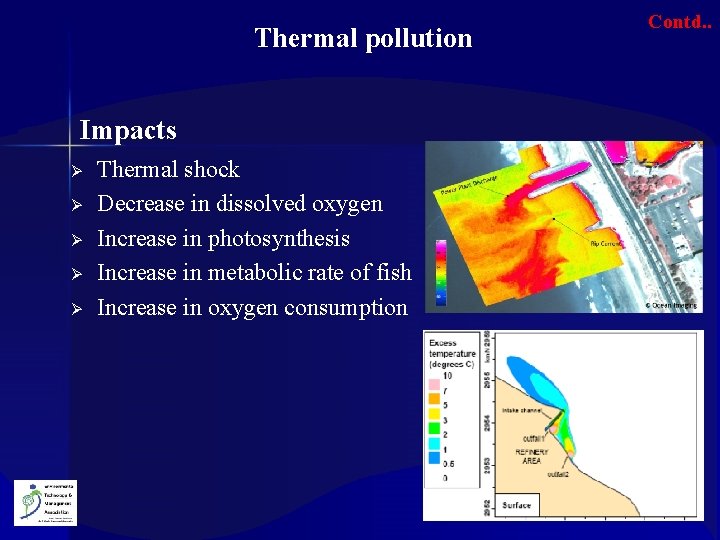
Thermal pollution Impacts Ø Ø Ø Thermal shock Decrease in dissolved oxygen Increase in photosynthesis Increase in metabolic rate of fish Increase in oxygen consumption Contd. .
Radioactive pollution Ø Radioactive wastes are usually by-products of nuclear power generation and other applications of research and medicine. Ø Radioactive waste is hazardous to human health Ø Pollution due to radioactive wastes – Radioactive pollution
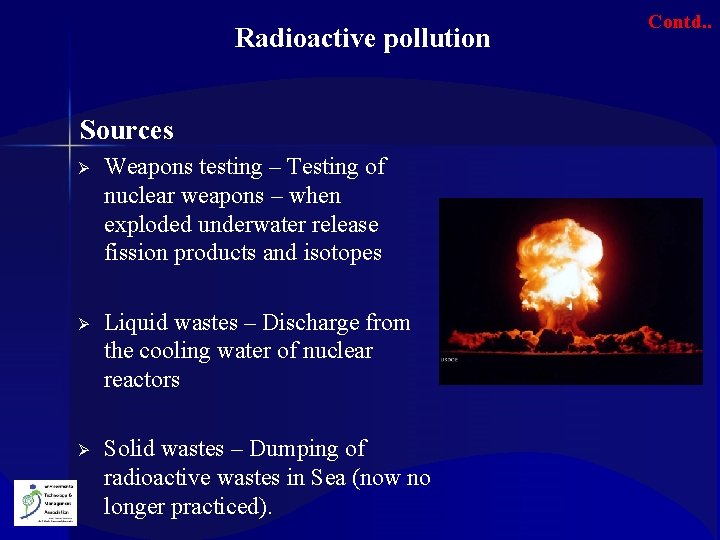
Radioactive pollution Sources Ø Weapons testing – Testing of nuclear weapons – when exploded underwater release fission products and isotopes Ø Liquid wastes – Discharge from the cooling water of nuclear reactors Ø Solid wastes – Dumping of radioactive wastes in Sea (now no longer practiced). Contd. .
Radioactive pollution Impacts Ø Highly lethal - Even low doses causes fatal damage Ø Possibility of bioaccumulation – especially in algae and bivalves eg. Porphyra near a nuclear power plant location had 10 times more caesium-137 than in the surrounding waters Contd. .
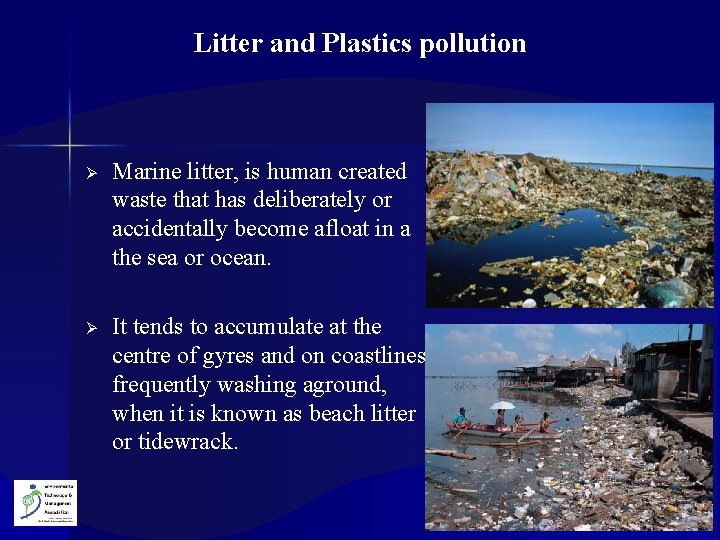
Litter and Plastics pollution Ø Marine litter, is human created waste that has deliberately or accidentally become afloat in a the sea or ocean. Ø It tends to accumulate at the centre of gyres and on coastlines, frequently washing aground, when it is known as beach litter or tidewrack.
Litter and Plastics pollution Sources Ø Ø Ø Up to 80% of the pollution is land-based. A wide variety of anthropogenic artifacts can become marine debris Plastic Bags, Balloons, Buoys etc. Contd. .
Litter and Plastics pollution Contd. . Impacts Ø Ø Many animals that live on or in the sea consume flotsam by mistake, as it often looks similar to their natural prey Blocks the passage of food and causing death through starvation or infection. Tiny floating particles also resemble zooplankton, which can lead filter feeders to consume them and cause them to enter the ocean food chain. In samples taken from the North Pacific Gyre in 1999 by the Algalita Marine Research Foundation, the mass of plastic exceeded that of zooplankton by a factor of six.
Solution to pollution Ø Ø Ø Reduce input of toxic pollutants Treat sewage primary, secondary and tertiary treatment Ban dumping of wastes and raw sewage in nthe sea Ban ocean dumping of sludge and hazardous dredged material Protect sensitive areas from development, oil drilling, and oil shipping Regulate coastal development