Marine microbiology from space Rafel Sim Sergio Vallina

Marine microbiology from space Rafel Simó, Sergio Vallina, Jordi Dachs & Carles Pedrós-Alió Institut de Ciències del Mar CMIMA, CSIC Barcelona

Marine microbes through the microscope: small but many

Ocean color Many Very few microbes Sea. Wiffs web page

The many troubles of a well meaning satellite

Raw Data From sensor to image Electronic signal in each pixel Level 0 Sensor calibration Each pixel with position and time Level 1 Atmospheric correction with masks and flags Radiance at the stellite per pixel Level 2 Radiance at Earth’s surface Algorithms Level 2 Biogeophysical data Level 3 Http: //daac. gsfc. nasa. gov/CAMPAIGN_DOCS/OCDST/classic_scenes Data in bins

Phototrophic microbes visible thanks to Chlorophyll a A ship would take 10 years of continuous sampling to get the same amount of data points CZCS 27/11/81

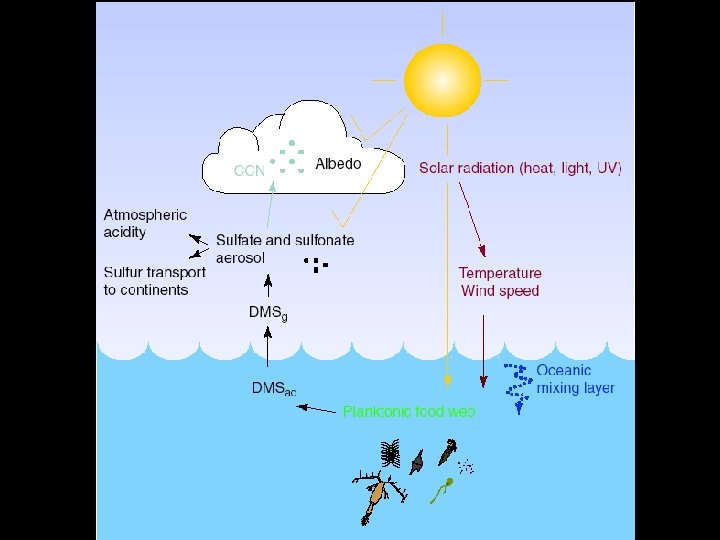
DMSP Marine phytoplankton produce DMSP for its role in: -osmoregulation -cryoprotection -anti-oxidant -methyl donor -overflow of excess S and reducing power -chemosensory and chemotactic behaviour ubiquitous in the oceans!
2 S+-CH 2 -COOis transformed into DMS : dimethyl sulphide (CH")
DMSP: dimethylsulphoniopropionate (CH 3)2 S+-CH 2 -COOis transformed into DMS : dimethyl sulphide (CH 3)2 S main biological source of S to atmosphere

Microbes contribute to climate regulation through DMS production Albedo Solar Radiation Particles Temperature Atmosphere Ocean DMS Microbial community (plankton) Charlson, Lovelock, Andreae & Warren (1987) Nature 326: 655

Earth without clouds

Earth with clouds: albedo is VERY important

The % of DMSP converted to DMS depends on Mixed Layer Depth 100 DMS yield (%) 80 60 40 20 0 0 10 20 30 40 Mixed Layer Depth (m) Simó & Pedrós-Alió, Nature 402: 396 -399 (1999) 50 60 70
 monthly MLD :")
CHL : Sea. Wi. FS 1997 -2000 W. Gregg (GSFC, NASA) monthly MLD : Samuels & Cox (Levitus) t = 0. 125 kg m-3 monthly

Validation of the algorythm: average values from world’s oceans R 2 = 0. 8 2 5 5 10 North Atlantic Predicted DMS (n. M) Gulf of Mexico East China Sea 8 East Mediterranean West Mediterranean 6 Sargasso Sea Southern ocean (SOIREE) 4 Equatorial Pacific (IRONEX II) Equatorial Pacific 2 0 0 2 4 6 8 10 Observed DMS (n. M) Simó & Dachs, Global Biogeochem. Cycles, 2002
 january")
DMS conc. (n. M) january
 december")
DMS conc. (n. M) december

SST : ATSR-2 monthly WIND SPEED : NOAA SSM/I monthly, Weibull correction Sea-to-air flux: F = k · [DMS]

January February April May March 90 N 60 N 30 N 0 30 S 60 S 90 S June July August September October November December 90 N 60 N 30 N 0 30 S 60 S 90 S 180 W 90 W 0 90 E 180 EW 90 W 0 5 0 10 90 E 15 180 EW 20 DMS Flux ( M m-2 d-1) 25 90 W 30 0 90 E 180 E

ANNUAL OCEAN-TO-ATMOSPHERE EMISSION OF DMS 23 - 32 Tg S y-1 anthropogenic ~ 67 volcanic ~ 7

 POTENTIAL CLOUD CONDENSATION NUCLEI (CCN)")
MODIS AEROSOL OPTICAL DEPTH (AOD) POTENTIAL CLOUD CONDENSATION NUCLEI (CCN)

COEFF. CORRELATION CCN vs DMS conc annual series, 7 x 7º
 + Cape Grim + Amsterdam Island DMS predicted CCN")
ATMOSPHERIC SAMPLING STATIONS (Univ. Miami) + Cape Grim + Amsterdam Island DMS predicted CCN MODIS MSA measured

J F M A M J J A S O N D AMSTERDAM IS. blue: DMS black: CCN green: MSA J F M A M J J A S O N D DMS – CCN – MSA (standardized) blue: DMS black: CCN green: MSA DMS – CCN – MSA (standardized) DMS – CCN – MSA (standardized) MACE HEAD DMS vs CCN SPEARMAN'S CORREL. COEFF. : KOREA -0, 5385 blue: DMS black: CCN green: MSA J F M A M J J A S O N D HAWAII blue: DMS CCN black: MSA green: J F M A
- Slides: 25