Marine Microbial communities Microbial Genomics Workshop Elizabeth Dinsdale

Marine Microbial communities Microbial Genomics Workshop Elizabeth Dinsdale Rio October - 2012

Oceans • • 71 % of planet is covered by ocean Mean depth 3800 m – deepest 10, 800 m Mean height of Earth 840 m, highest 8936 Temperature, pressure Circulation – old and young water High and low nutrient areas Upwellings 1% area – most productivity

Biogeochemistry - carbon

What factors affect carbon uptake? • • • Human activity – more CO 2 in atmosphere More dissolving into ocean Movement of current Sinking of heavy CO 2 cold water at poles Abiotic processes a small fraction of the removal/use of carbon dioxide • Biological pump removes most CO 2

Sequester of carbon – microbially driven Chisholm Nature 407, 685 -687

Recognition of the abundance of microbes in the oceans • 1970 - 1980 DNA staining methods that identified the numbers of microbes in ocean • Local, regional, bulk estimates of numbers and consumption • Large effect of microbes on biogeochemical production • Problem could not identify individual species, like eukaryotes

DNA sequencing • • Culturing - description of 1 % of all microbes 16 S r. DNA analysis 1980 - Pace Defined taxonomy of microbes Reduced bias Identified new organisms More diversity Targeted culturing – ID new species and ecotypes

Prochlorococcus - ecotypes • Highly related, but physiologically and genetically distinct • Investigated distribution in ocean • Different physiological conditions – high light – gene that repairs photo-damage - use reduced forms of nitrogen - Low light – no repair gene - use nitrite and ammonium

Prochlorococcus Cruise Southern hemisphere Nitrite depth profile Mixed layer Bouman et al Science 312: 918 2006

Prochlorococcus abundance • Divinyl Chla • Cell #

Regional variation in Prochlrococcus strains • Low numbers – competition Synecococcus • Low nitrates – shallow mixed layer HL adapted

Metagenomes: genetic analysis of all the microbes from an environment www. evolutionpages. com www. cebitec. uni-bielefeld. de

Metagenomics Sample the environment Filter Capture organisms Extract DNA Sequence Microbial genomes Comparison to database Taxonomic Functional Description

Metagenomics – BAC libraries • Photorhodopsin genes – Beja et al 2000 – light driven proton pump, chloride ion pump or photosensory receptor – First found in a Halophilic Archaea – y- proteobacterium from the ocean, first time seen in a Bacterium non-extreme environment – SAR 86 – common in the ocean – Seen deep water suggesting new functionality

Metagenomes- new genes • Archaeal ammonia oxidation – ammonia mooxygenasae gene – Crenarchaeota – Ammonium as sole energy source – Archaea important in nitrogen cycle, not just Bacteria as thought Beja et al 2002

Sargasso Sea • Sargasso Sea – Venter 2004 – Random sample of the entire microbial community – 6 sites of surface water – Suggested could assemble microbial genomes • Estimated 1800 species • New genes • 748 new photorhodopsin genes

Global Ocean survey • 6. 12 million predicted proteins from 7. 7 million reads • All known microbial proteins PLUS • 1, 700 new ones – each with 20 representatives • Rate of new proteins identified, with more than 2 representatives, was linear with each sequence

Metagenomic momentum • Black Bac libraries, Pink – Fosmid libraries, Green - 454 Hughenholt and Tyson 2008

Functional profile of microbial community • Sequences from a large range of microbes in a community • Microbes from the same environment have similar functions • Functional or metabolic potential

Metagenomic sample location

Microbial metagenomes group by environment

Identify the metabolism that drive differences between environments Cell wall Membrane transport Virulence Protein Stress Sulfur Signaling Motility Respiration Dinsdale et al 2008 Nature 452: 629 -632

Targeted metagenomic Dinsdale and Rohwer 2008 review on Kalyuzhnaya et al 2008
 flow sorted metagenomes • Flow sorting • PCR to confirm")
Nitrogen fixing cyanobacteria (UCYN-A) flow sorted metagenomes • Flow sorting • PCR to confirm Sorting • 15% of community • 5000 cells • Amplified • Sequenced • Zehr et al 2008 Science 322: 1110 -1112

UCYN-A metagenome components from 16 S

NIF genes all present • Analysis of NIF gene • Grey areas of matches, white noncoding

Photosystem genes identified in flow sorted metagenomes • No carbon fixing • What is PS 1 doing? • Not producing oxygen • Is it symbiotic? • No poisoning of nitrogen fixing by oxygen

Microbial Evolution Two major organisms in biofilm air-liquid interface • Leptospirillum group II – iron oxidation, does not fix nitrogen • Ferroplasma type II – pyrite dilution and H+ production • Denef and Banfield, Science 2012

Metagenomics Sample the environment Filter Capture organisms Extract DNA Sequence Microbial genomes Comparison to database Kmer, sequencing depth, GC content Taxonomic Functional Description Bin sequences – compiled genomes

Location and samples over nine year period Leptospirillum group II type 1 - 6
 and VI (blue)")
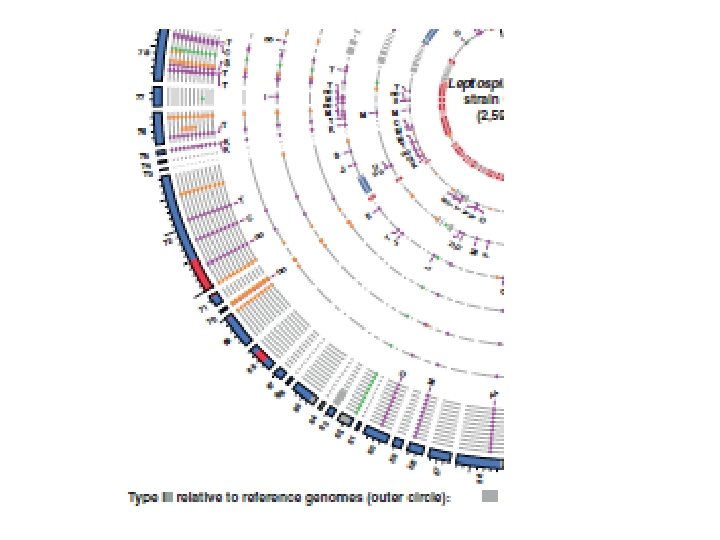
Genome type III, combination of type 1 (red) and VI (blue)
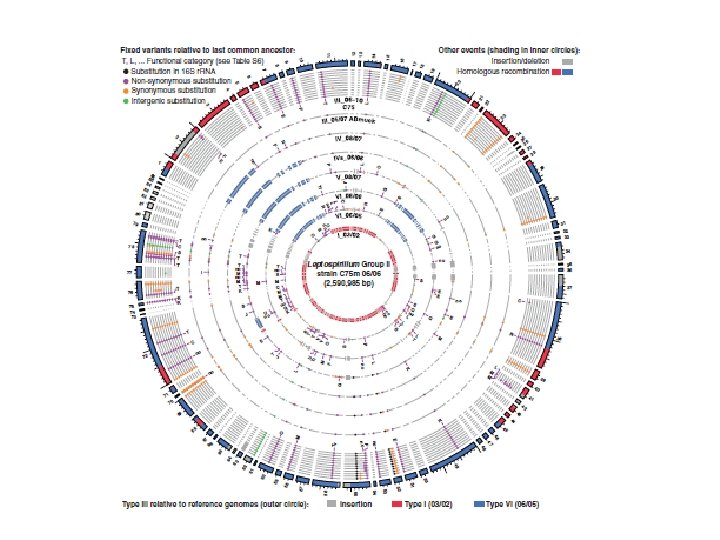

Genome evolution

RNA analysis
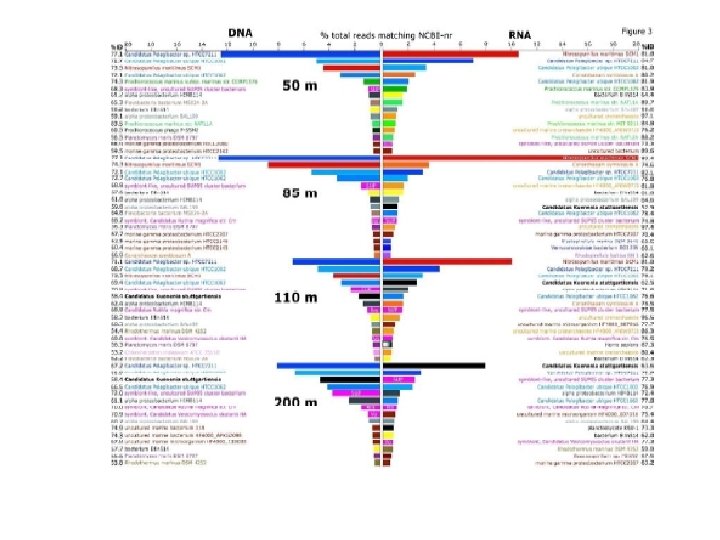

Transcriptome vs metagenome • Metagenome provide a functional potential • Transcriptome provides an analysis of the RNA’s that are being produced • Transcriptome difficult to obtain, small quantities, mostly r. RNA not m. RNA • Proteomics – proteins that are being produced

Marine microbiology • • Extensive progress over last 40 year High diversity Novel genes Novel activity Clarified some biogeochemical pathways Evolution of microbial communities Do we know how much carbon sequestering will occur in the oceans?

Metagenomic data adding to the description of the food web Delong 2006 Nature 459

Samba • • Thursday 10: 30 pm Lapa 40 O – Diogo Nogueira Rua Riachuelo, 97 – Lapa Print the flyer you get a discount ~ R 5 – logon to website • $R 40 for Men! • $R 25 for Women!! • BUT YOU have to be here on Friday morning
- Slides: 40