
Marian Bubak 1 2 Wodzimierz Funika 1 Dominik
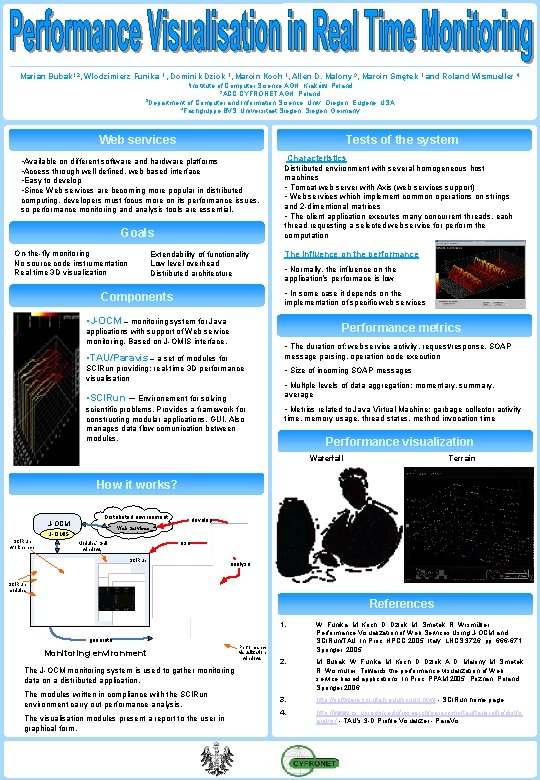
Marian Bubak 1, 2, Włodzimierz Funika 1 , Dominik Dziok 1, Marcin Koch 1, Allen D. Malony 3, Marcin Smętek 1 and Roland Wismueller 4 1 Institute of Computer Science AGH, Kraków, Poland 2 ACC CYFRONET AGH, Poland 3 Department of Computer and Information Science, Univ. Oregon, Eugene, USA 4 Fachgruppe BVS, Universitaet Siegen, Germany Web services Tests of the system • Available on different software and hardware platforms • Access through well defined, web based interface • Easy to develop • Since Web services are becoming more popular in distributed computing, developers must focus more on its performance issues, so performance monitoring and analysis tools are essential. Goals On-the-fly monitoring No source code instrumentation Real time 3 D visualization Extendability of functionality Low level overhead Distributed architecture Characteristics Distributed environment with several homogeneous host machines • Tomcat web server with Axis (web services support) • Web services which implement common operations on strings and 2 -dimentional matrices • The client application executes many concurrent threads, each thread requesting a selected web service for perform the computation The influence on the performance • Normally, the influence on the application’s performace is low • In some case it depends on the Components implementation of specific web services • J-OCM – monitoring system for Java Performance metrics applications with support of Web service monitoring. Based on J-OMIS interface. • The duration of: web service activity, request/response, SOAP • TAU/Paravis – a set of modules for message parsing, operation code execution SCIRun providing: real-time 3 D performance visualisation • Size of incoming SOAP messages • SCIRun – Environement for solving average scientific problems. Provides a framework for constructing modular applications, GUI. Also manages data flow comunication between modules. • Metrics related to Java Virtual Machine: garbage collector activity • Multple levels of data aggregation: momentary, summary, time, memory usage, thread states, method invocation time Performance visualization Waterfall Terrain How it works? J-OCM Distributed environment develop Web Services J-OMIS SCIRun workbench use Modules’ GUI windows SCIRun analyse SCIRun modules References 1. W. Funika, M. Koch, D. Dziok, M. Smetek, R. Wismüller: Performance Visualization of Web Services Using J-OCM and SCIRun/TAU. In Proc. HPCC 2005, Italy, LNCS 3726, pp. 666 -671, Springer, 2005 2. M. Bubak, W. Funika, M. Koch, D. Dziok, A. D. Malony, M. Smetek, R. Wismuller: Towards the performance visualization of Web service based applications. In Proc. PPAM 2005, Poznan, Poland, Springer 2006 3. http: //software. sci. utah. edu/scirun. html - SCIRun home page 4. http: //www. cs. uoregon. edu/research/paracomp/tauprofile/dist/p aravis/ - TAU's 3 -D Profile Visualizer - Para. Vis generate Monitoring environment The J-OCM monitoring system is used to gather monitoring data on a distributed application. The modules written in compliance with the SCIRun environment carry out performance analysis. The visualisation modules present a report to the user in graphical form. Performance visualization windows
- Slides: 1