
Marginal product of labor MPL def The extra
Marginal product of labor (MPL) def: The extra output the firm can produce using an additional unit of labor (holding other inputs fixed): MPL = F (K, L +1) – F (K, L) slide 0
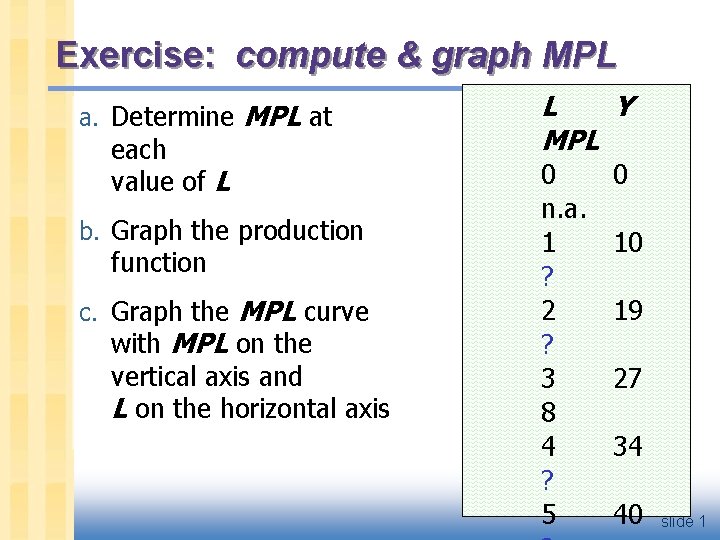
Exercise: compute & graph MPL a. Determine MPL at each value of L b. Graph the production function c. Graph the MPL curve with MPL on the vertical axis and L on the horizontal axis L Y MPL 0 n. a. 1 ? 2 ? 3 8 4 ? 5 0 10 19 27 34 40 slide 1
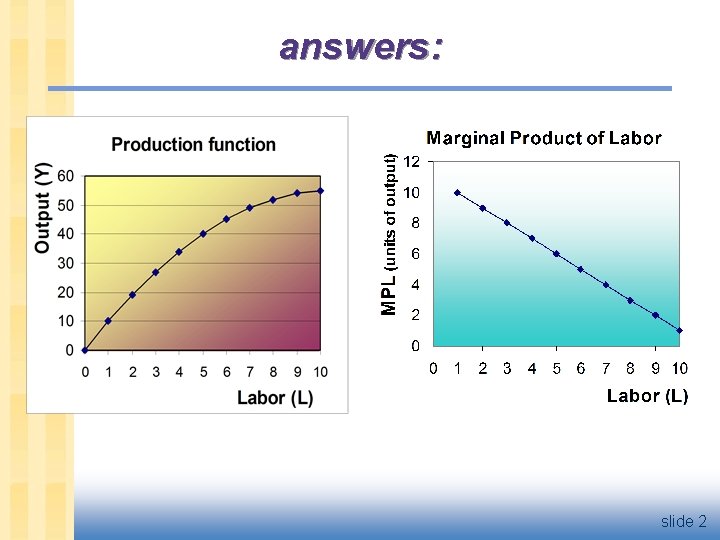
answers: slide 2
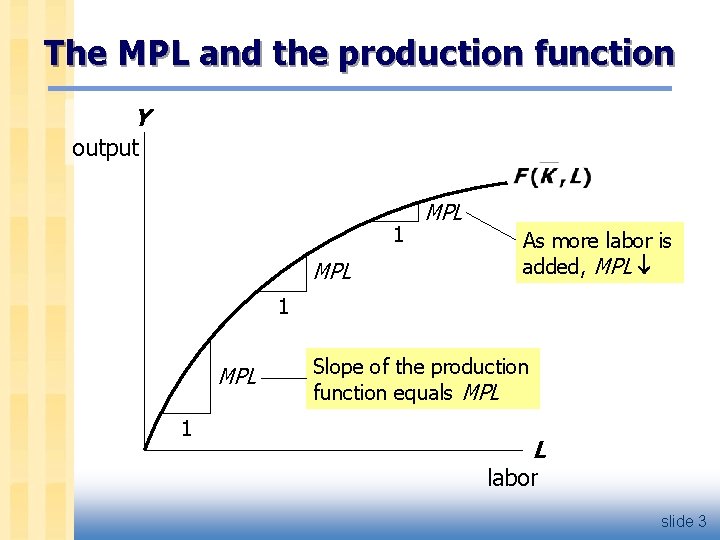
The MPL and the production function Y output 1 MPL As more labor is added, MPL 1 MPL 1 Slope of the production function equals MPL L labor slide 3
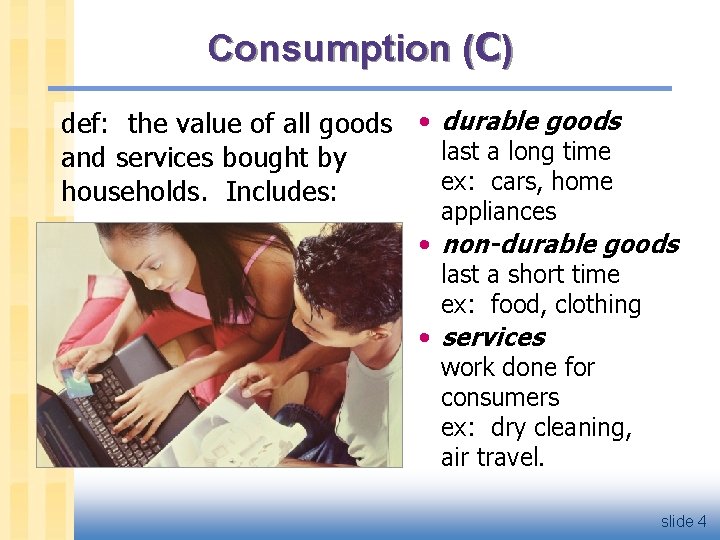
Consumption (C) def: the value of all goods • durable goods last a long time and services bought by ex: cars, home households. Includes: appliances • non-durable goods last a short time ex: food, clothing • services work done for consumers ex: dry cleaning, air travel. slide 4
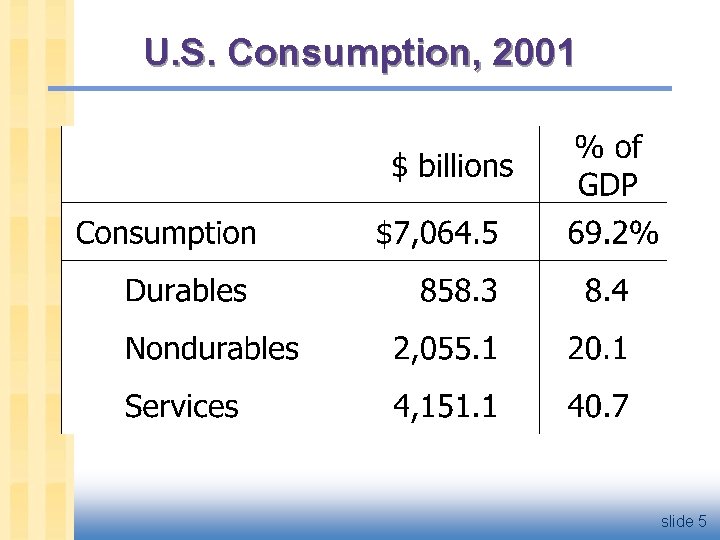
U. S. Consumption, 2001 slide 5
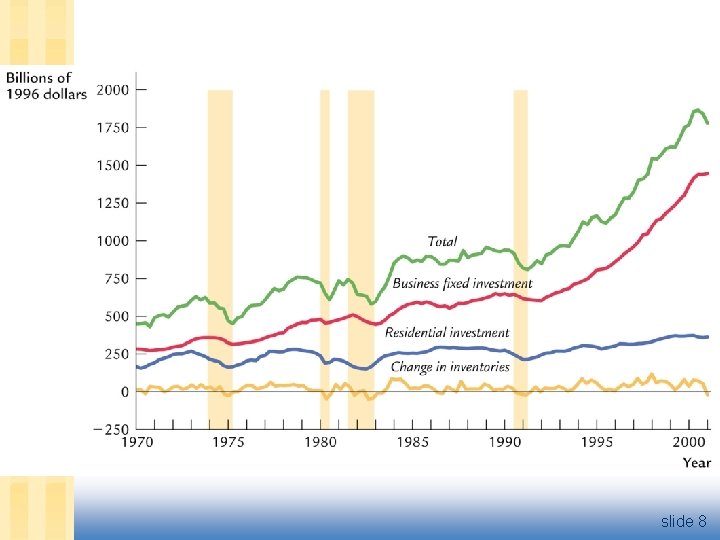
Investment (I) def 1: spending on [the factor of production] capital. def 2: spending on goods bought for future use. Includes: § business fixed investment spending on plant and equipment that firms will use to produce other goods & services § residential fixed investment spending on housing units by consumers and landlords § inventory investment the change in the value of all firms’ inventories slide 6
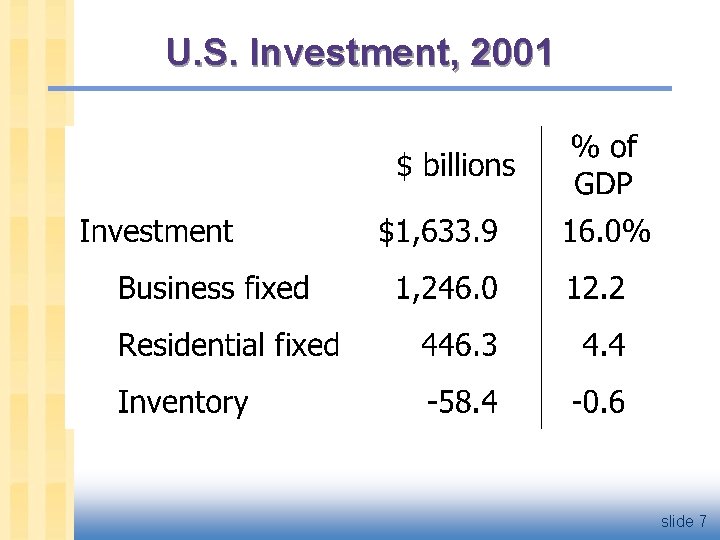
U. S. Investment, 2001 slide 7
slide 8

Government spending (G) § G includes all government spending on goods and services. § G excludes transfer payments (e. g. unemployment insurance payments), because they do not represent spending on goods and services. slide 9
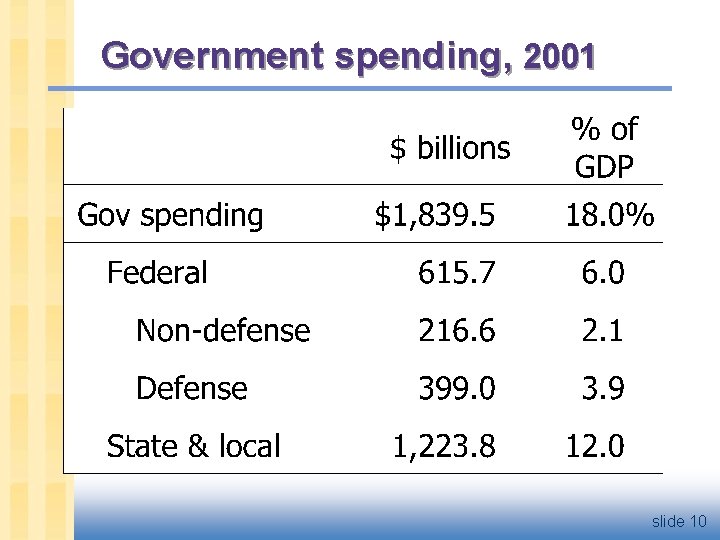
Government spending, 2001 slide 10
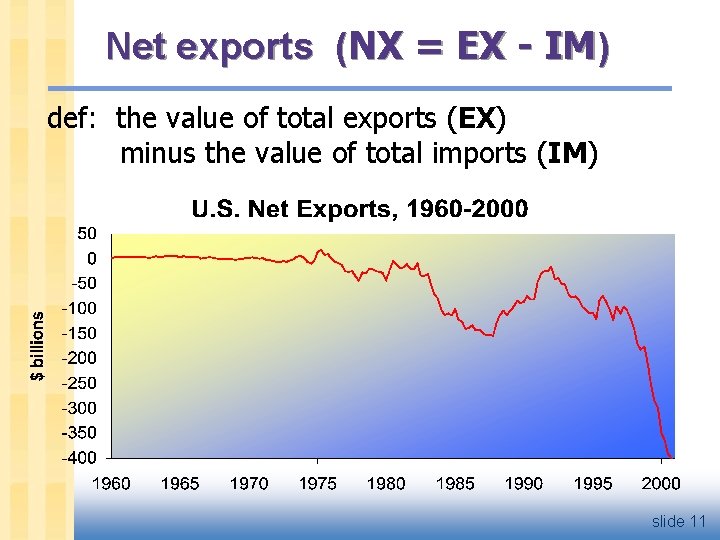
Net exports (NX = EX - IM) def: the value of total exports (EX) minus the value of total imports (IM) slide 11
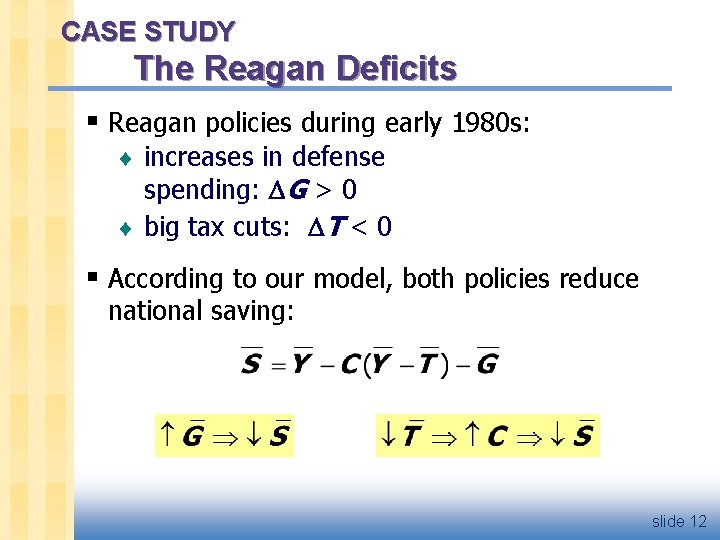
CASE STUDY The Reagan Deficits § Reagan policies during early 1980 s: ¨ increases in defense spending: G > 0 ¨ big tax cuts: T < 0 § According to our model, both policies reduce national saving: slide 12
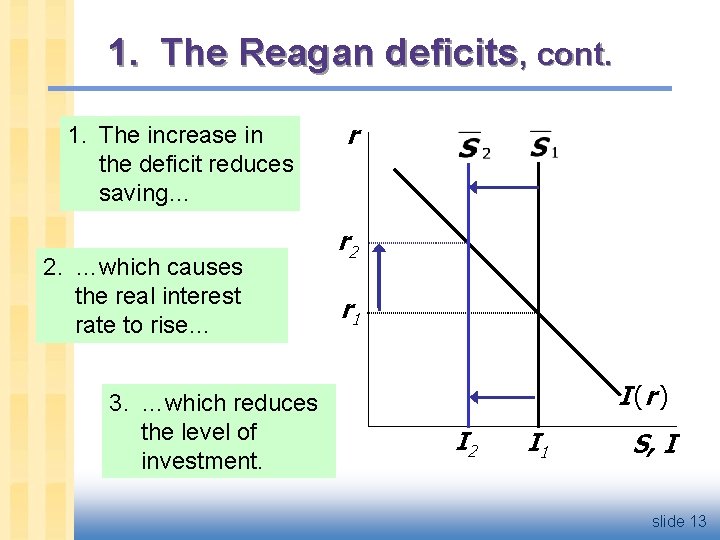
1. The Reagan deficits, cont. 1. The increase in the deficit reduces saving… 2. …which causes the real interest rate to rise… 3. …which reduces the level of investment. r r 2 r 1 I (r ) I 2 I 1 S, I slide 13
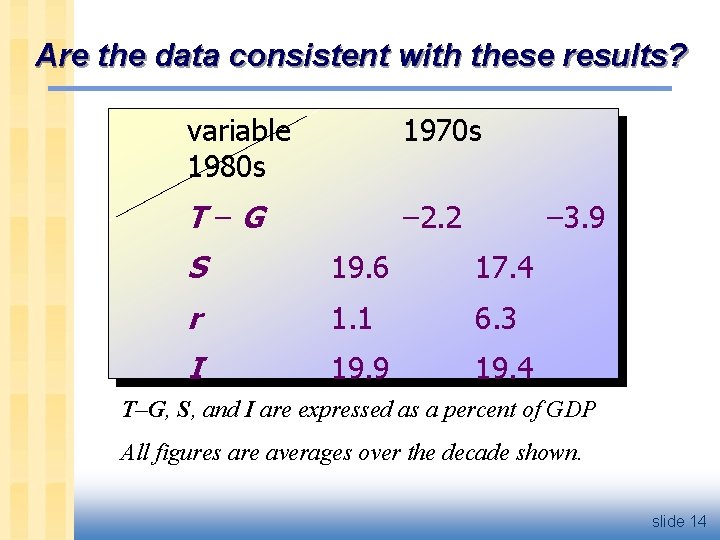
Are the data consistent with these results? variable 1980 s 1970 s T–G – 2. 2 – 3. 9 S 19. 6 17. 4 r 1. 1 6. 3 I 19. 9 19. 4 T–G, S, and I are expressed as a percent of GDP All figures are averages over the decade shown. slide 14
- Slides: 15