
Margaret Kelly CEO REMAX January 27 2012 Market
























- Slides: 54
Margaret Kelly CEO, RE/MAX January 27, 2012
Market Outlook The Economy
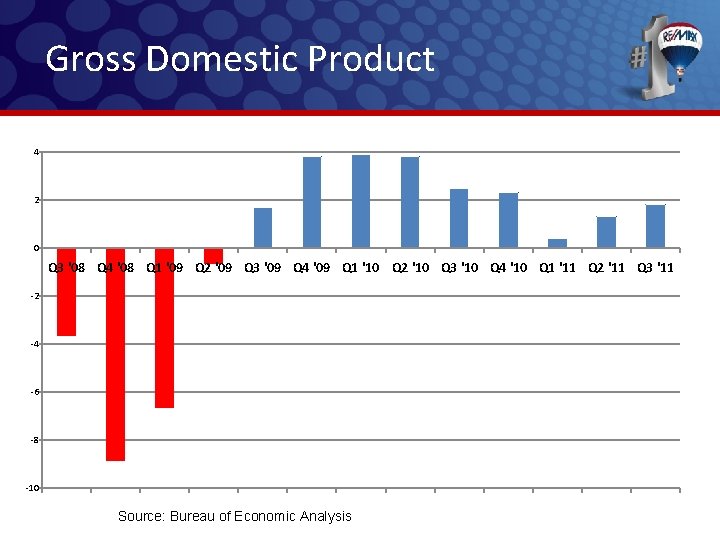
Gross Domestic Product 4 2 0 Q 3 '08 Q 4 '08 Q 1 '09 Q 2 '09 Q 3 '09 Q 4 '09 Q 1 '10 Q 2 '10 Q 3 '10 Q 4 '10 Q 1 '11 Q 2 '11 Q 3 '11 -2 -4 -6 -8 -10 Source: Bureau of Economic Analysis
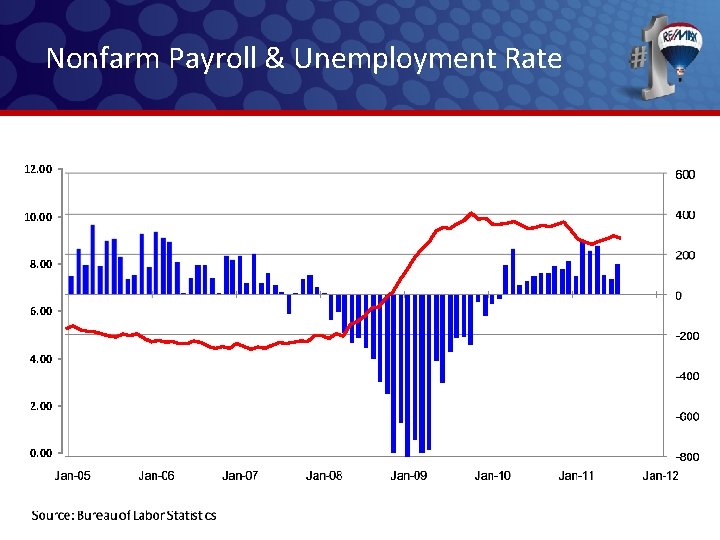
Nonfarm Payroll & Unemployment Rate 12. 00 10. 00 8. 00 6. 00 4. 00 2. 00 0. 00
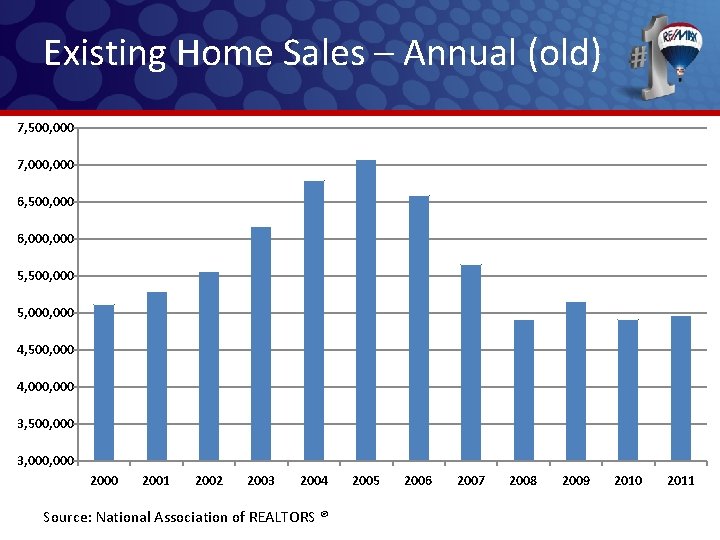
Existing Home Sales – Annual (old) 7, 500, 000 7, 000 6, 500, 000 6, 000 5, 500, 000 5, 000 4, 500, 000 4, 000 3, 500, 000 3, 000 2000 2001 2002 2003 2004 Source: National Association of REALTORS ® 2005 2006 2007 2008 2009 2010 2011
Existing Home Sales - Annual 7, 500, 000 7, 000 6, 500, 000 6, 000 5, 500, 000 5, 000 4, 500, 000 4, 000 3, 500, 000 3, 000 Source: National Association of REALTORS® 2000 2001 2002 2003 2004 Source: National Association of REALTORS ® 2005 2006 2007 2008 2009 2010 2011
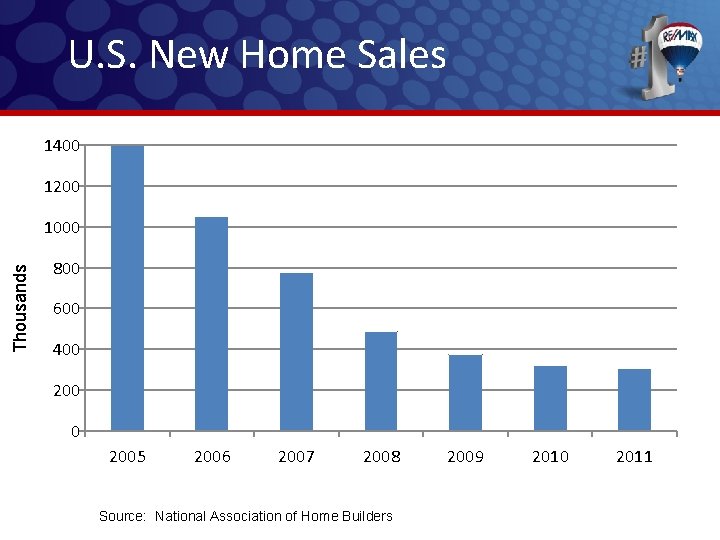
U. S. New Home Sales 1400 1200 Thousands 1000 800 600 400 2005 2006 2007 2008 Source: National Association of Home Builders 2009 2010 2011
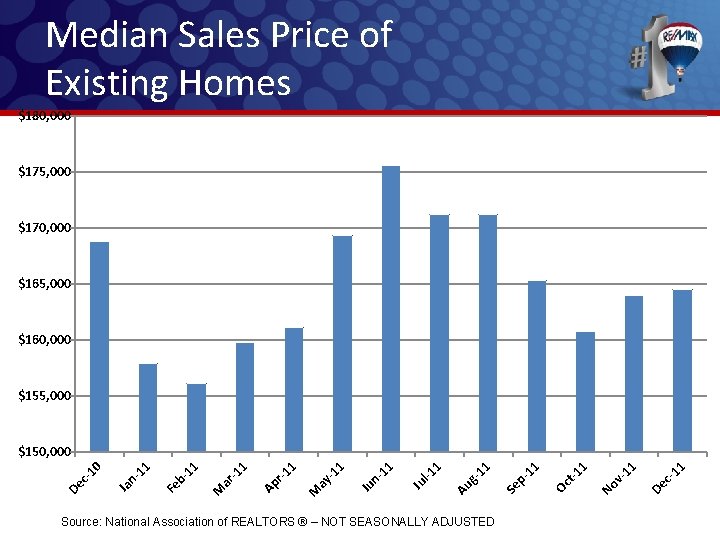
Median Sales Price of Existing Homes $180, 000 $175, 000 $170, 000 $165, 000 $160, 000 $155, 000 Source: National Association of REALTORS ® – NOT SEASONALLY ADJUSTED 11 c. De 11 v. No 1 t-1 Oc 11 p. Se 11 g. Au 1 l-1 Ju 11 n. Ju 1 M ay -1 1 r-1 Ap 1 -1 ar M 11 b. Fe 11 n. Ja De c- 10 $150, 000
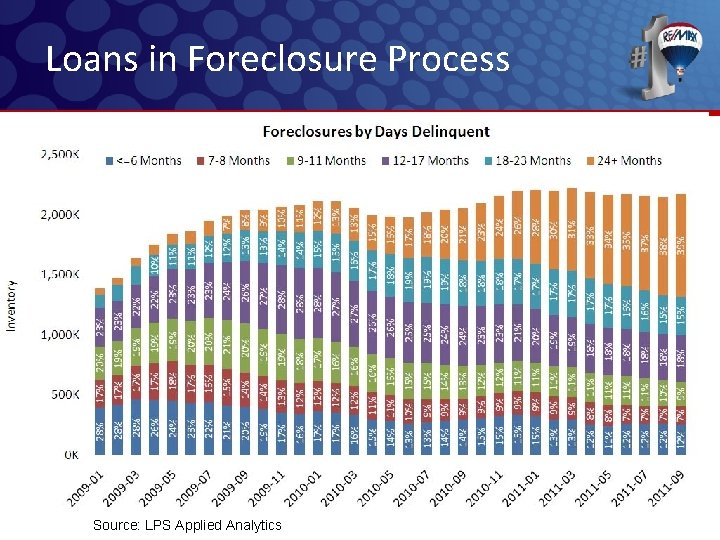
Loans in Foreclosure Process Source: LPS Applied Analytics
Homebuyer Participation ► 43% Current homeowners ► 34% First time buyers ► 23% Investors ► 76% Investors – Cash buyers Source: The Housing Pulse Tracking Survey Campbell Communications 10
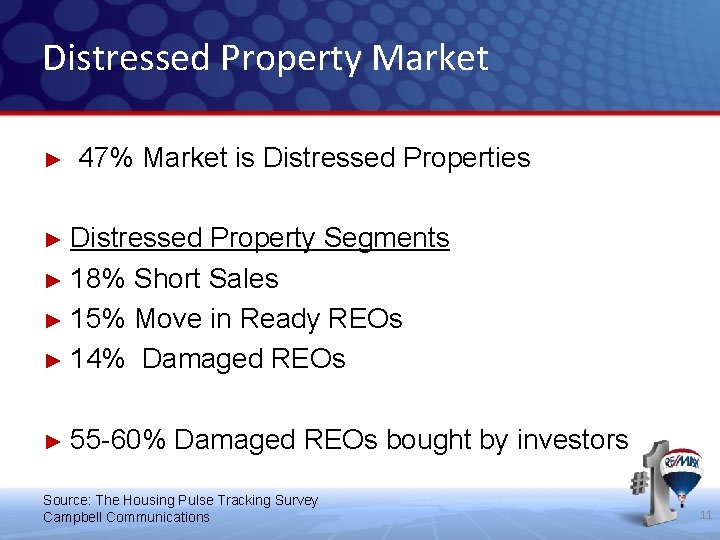
Distressed Property Market ► 47% Market is Distressed Properties ► Distressed Property Segments ► 18% Short Sales ► 15% Move in Ready REOs ► 14% Damaged REOs ► 55 -60% Damaged REOs bought by investors Source: The Housing Pulse Tracking Survey Campbell Communications 11
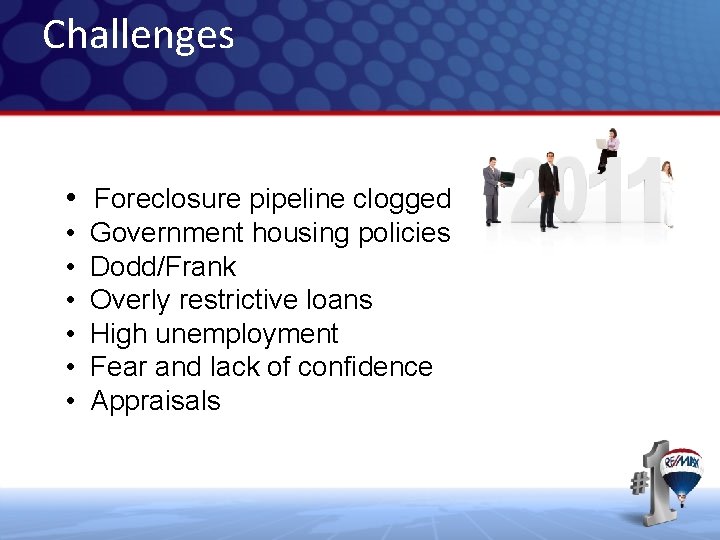
Challenges • Foreclosure pipeline clogged • Government housing policies • Dodd/Frank • Overly restrictive loans • High unemployment • Fear and lack of confidence • Appraisals
What does the future hold? 13
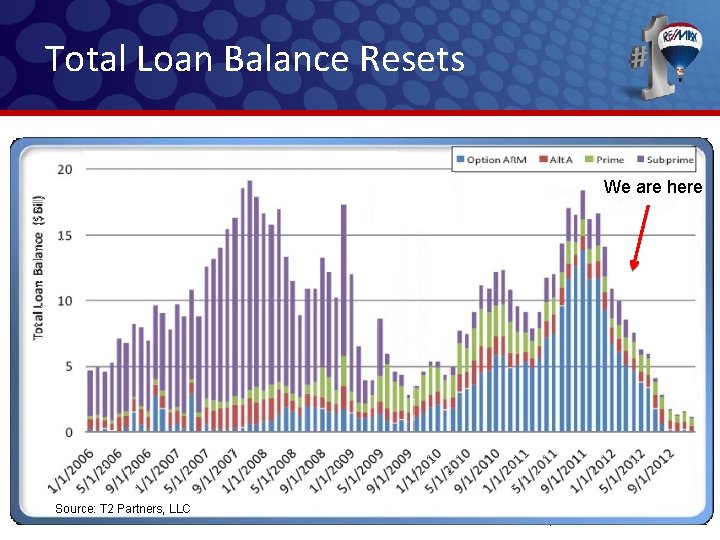
Total Loan Balance Resets We are here Source: T 2 Partners, LLC
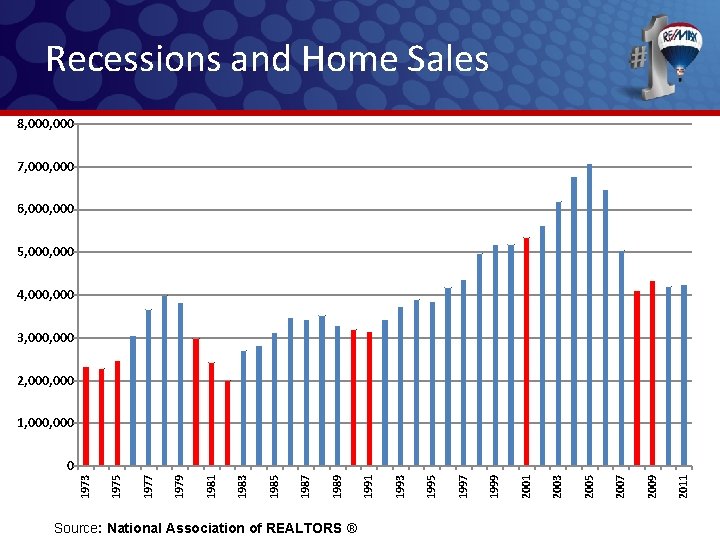
Recessions and Home Sales 8, 000 7, 000 6, 000 5, 000 4, 000 3, 000 2, 000 1, 000 Source: National Association of REALTORS ® 2011 2009 2007 2005 2003 2001 1999 1997 1995 1993 1991 1989 1987 1985 1983 1981 1979 1977 1975 1973 Source: National Association of REALTORS ® 0
Who Are Your Customers? Matures Baby Boomers 1909 -1945 Age 65 + 35 Million People 1946 -1964 Age 47 -65 80 Million People Gen X Gen Y (Millennials) 1965 -1979 Age 32 -46 48 Million People 1980 -1995 Age 16 -31 74 Million People Source: Cam Marston, Generational Insight, 2009
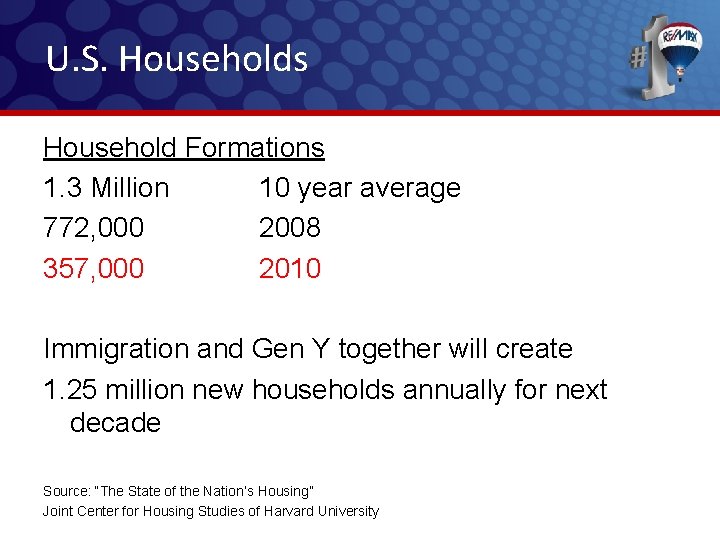
U. S. Households Household Formations 1. 3 Million 10 year average 772, 000 2008 357, 000 2010 Immigration and Gen Y together will create 1. 25 million new households annually for next decade Source: “The State of the Nation’s Housing” Joint Center for Housing Studies of Harvard University
Opportunities • • High inventory Low interest rates Low prices Population growth Immigration Renter demand Property management
Top Honors
J. D. Power and Associates RE/MAX Ranks Highest Among Both Home Buyers and Sellers! 2011 Home Buyer / Home Seller Study. SM “Highest Overall Satisfaction For Home Sellers and Home Buyers Among National Full Service Real Estate Firms” RE/MAX received the highest numerical score among full service real estate firms for home sellers and home buyers in the proprietary J. D. Power and Associates 2011 Home Buyer/Seller Study SM. Study based on 3, 861 total evaluations measuring 8 firms and measures opinions of individuals who bought a home between March 2010 and April 2011. Proprietary study results are based on experiences and perceptions of consumers surveyed March -May 2011. Your experiences may vary. Visit jdpower. com
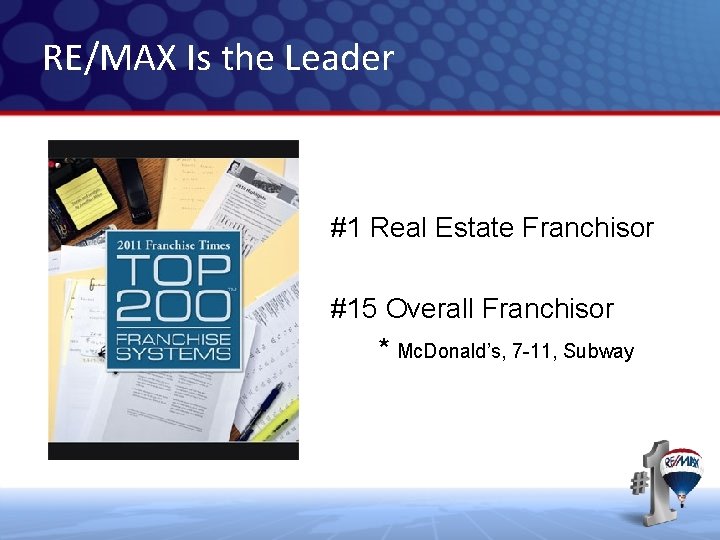
RE/MAX Is the Leader #1 Real Estate Franchisor #15 Overall Franchisor * Mc. Donald’s, 7 -11, Subway
Awards – RE/MAX University ► Brandon Hall Excellence in Learning ► Training Magazine Top 125
Inman News Award Dave Liniger “Most Influential Real Estate Leader”
Media Mix ►Most Exposure of Brand ►Maximum Traffic to remax. com ►Leads to our Agents
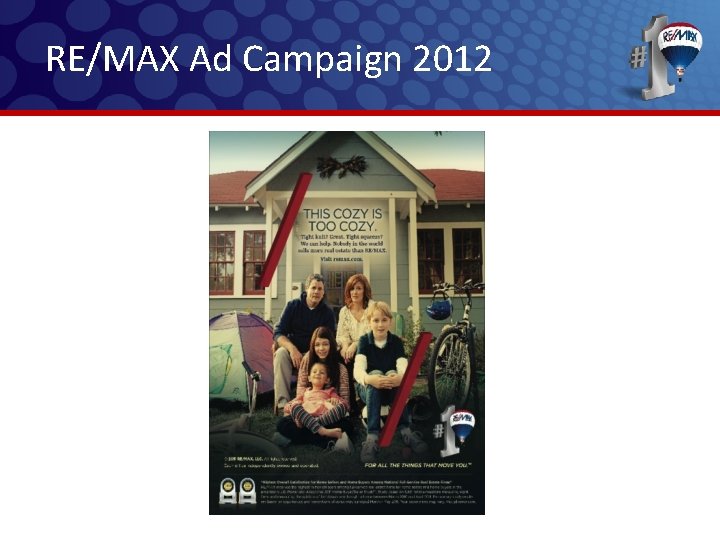
RE/MAX 2012 Ad Campaign
RE/MAX Ad Campaign 2012
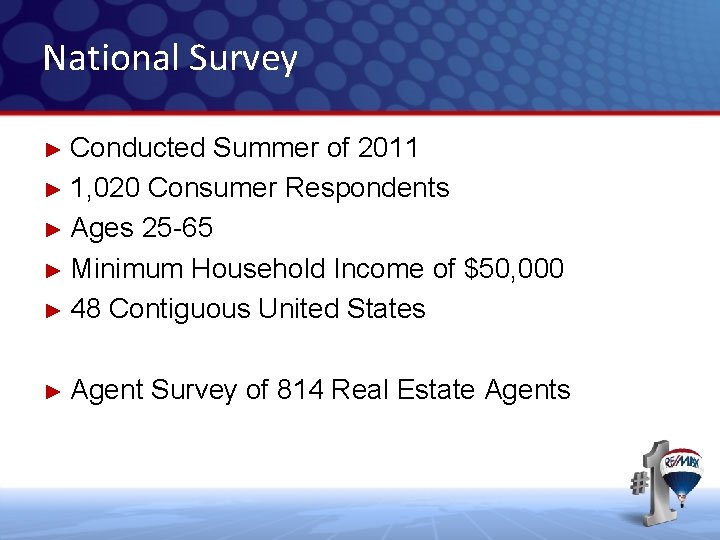
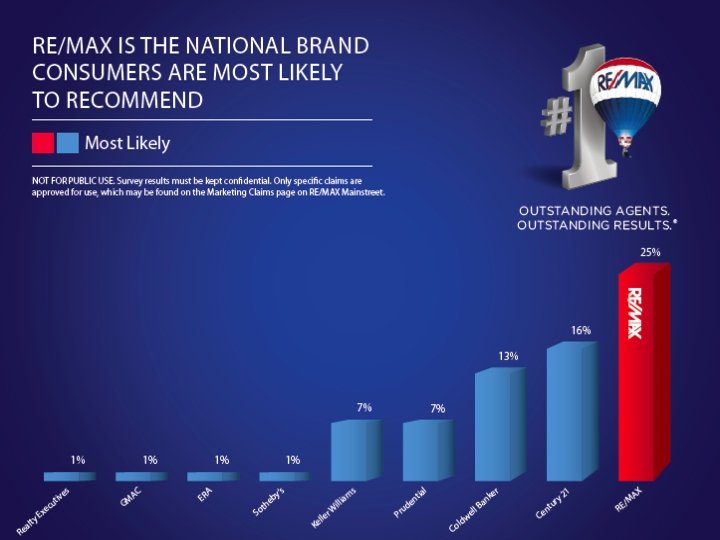
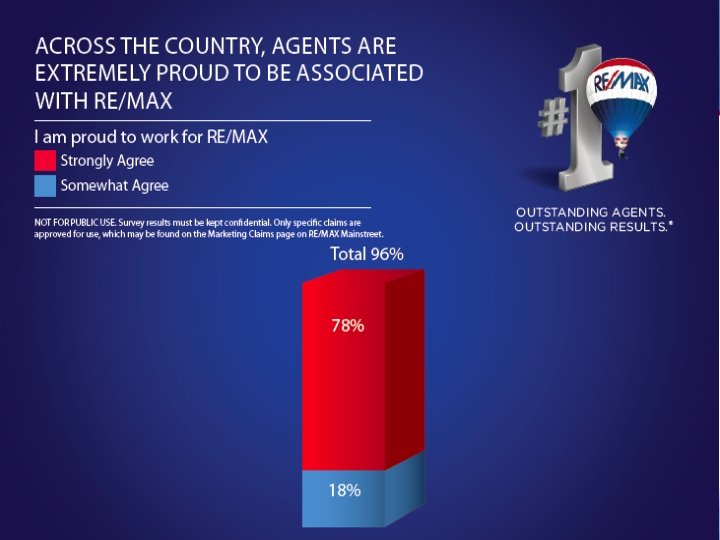
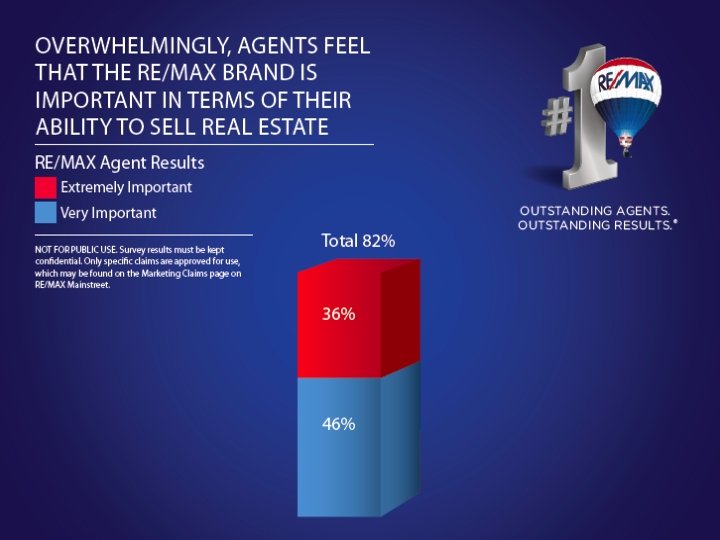
National Survey ► Conducted Summer of 2011 ► 1, 020 Consumer Respondents ► Ages 25 -65 ► Minimum Household Income of $50, 000 ► 48 Contiguous United States ► Agent Survey of 814 Real Estate Agents
New from RE/MAX
global. remax. com
Timely, Interactive, and Actionable
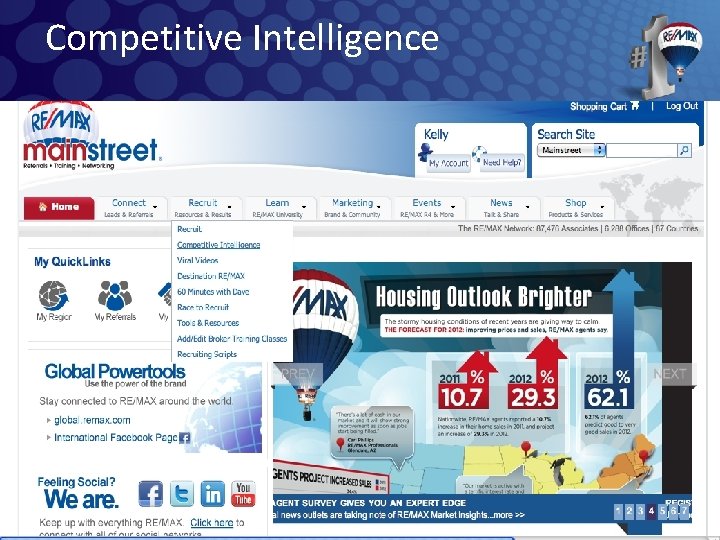
Competitive Intelligence
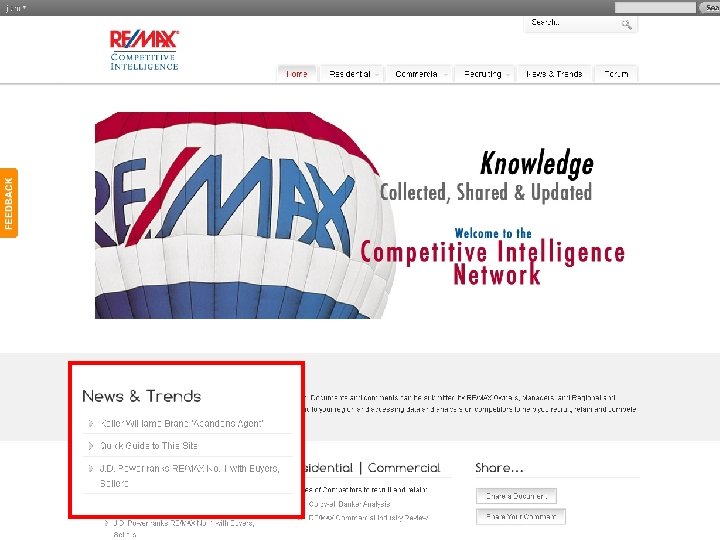
Competitive Intelligence Network
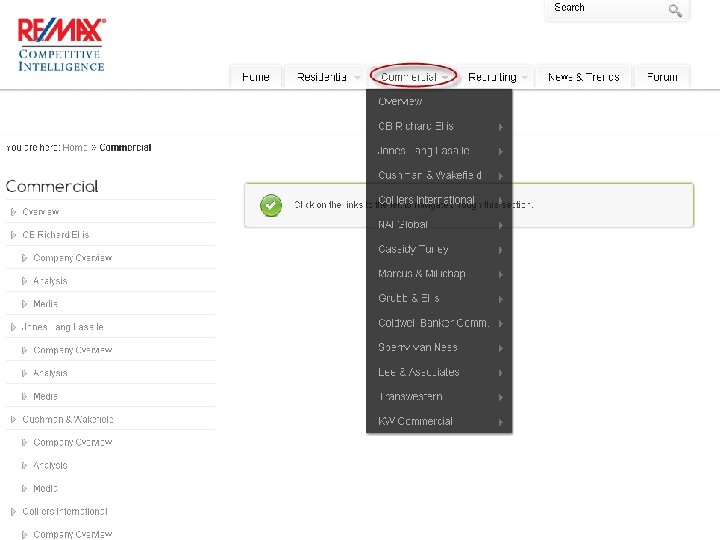
Competitive Intelligence Network
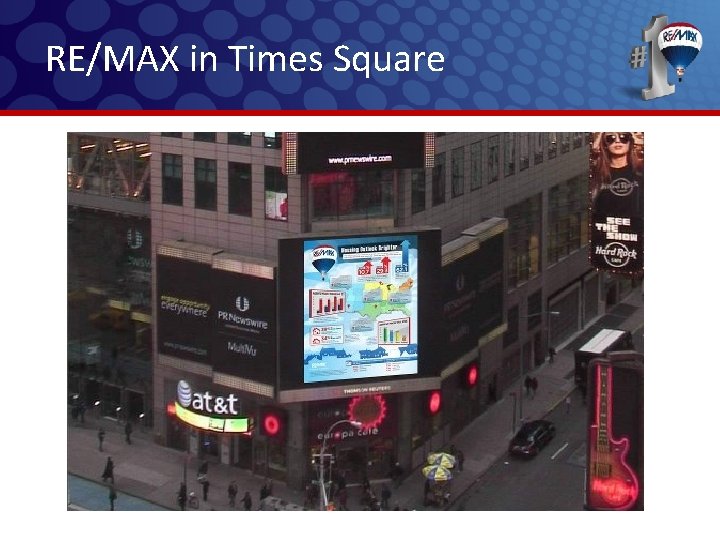
RE/MAX in Times Square
RE/MAX Presenter i. Pad App
The Time Is Now!
Questions?