Maps Maps Cartography The art and science of


- Slides: 14

Maps, Maps

Cartography The art and science of map making http: //commons. wikimedia. org/wiki/File: Antwerpen_1740_Seutter. JPG

Geographic Information Systems or Sciences (GIS)

GPS Global Positioning System • 24 satellites orbiting the earth • Collects signals • Provides instant locational data http: //commons. wikimedia. org/wiki/File: GPS_satellite_constellation. jpg

Map Scale How much of the earth should be depicted on a map? ? ? Scale = The ratio of dist. on a map to the dist. on the ground, where both are measured in the same units. 3 types of scale: – Representative Fraction – Verbal Scale – Graphic Scale

Representative Fraction • The map distance to ground distance ratio is written as a simple fraction (e. g. , 1: 3, 800, 000 or 1/3, 800, 000) ex. 84 in atlas 1 unit (in. , cm. , etc. ) on the map = 3, 800, 000 of the same unit on earth

Verbal Scale • Words instead of numbers express the scale. For example the representative fraction of 1: 63, 360 can also be expressed as “one inch to one mile” or 1 in = 1 mile 1 in = 63, 360 in 63, 360/12=5, 280 1 in = 5280 ft = 1 mile Thus 1 in = 1 mile

Graphic Scale http: //www. mansfieldct. org/Schools/MMS/staff/szych/Home%20 Page%20 Folder/Introduction%20 to%20 Maps_files/image 001. gif

http: //go. owu. edu/~jbkrygie/krygier_html/geog_222_lo/geog_222_lo 04_gr/scale. jpg

Map Projections Projection - The scientific method of transferring locations on earth’s surface to a flat map

Types of Projections • Conic (Albers Equal Area, Lambert Conformal Conic) - good for East-West land areas • Cylindrical (Transverse Mercator) - good for North-South land areas • Azimuthal (Lambert Azimuthal Equal Area) good for global views

Conic Projections (Albers, Lambert)

Cylindrical Projections (Mercator) Transverse Oblique

Challenges When maps are projected, areas near the poles often are distorted the most. Distortion always occurs, Use 184 in your atlas to see what the 4 types are: 1. Shape - ex: Mercator is correct for Greenland while Eckert IV is distorted 2. Distance – ex: latitude lines near the poles compared to equator 3. Size – ex: Mercator is distorted for Greenland while Eckert is correct 4. Direction – Examine the differences in compasses for different maps
 Nature of cartography
 Digital cartography definition
 Cartography basics
 1492 world map
 Cartography
 Map reproduction in cartography
 Cartography brushes
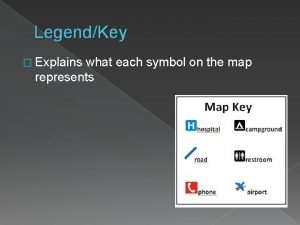
 Legend (key)
 Applied cartography
 Mountain cartography
 What is your favorite subject answer?
 Google map reittihaku
 Architecture is art and science
 Hình ảnh bộ gõ cơ thể búng tay
 Ng-html
