Maps Map Projections and Reading Maps l Richard


 and Longitude (meridians).")


 is probably the best known projection system for displaying")


 - not a projection but truth to earth surface - data")


- Slides: 38
Maps, Map Projections and Reading Maps l Richard Knight Available at http: //planet. uwc. ac. za/nisl/gis
Maps can be prepared on many forms q q Earliest portable form would have been drawn on parchment Linen Paper Plastic/Mylar
What data do maps provide us? q Date / Publisher / Printer q Scale / direction / Distance / ratios Geographical Position Coordinates/ projection Features / places / legends Other information?
You can classify maps into the following types q Topographical: Represents objects such as roads, rivers, coastline q Thematic: Represents themes such as soil types q Chloropleths: Represents interpreted boundaries e. g. census q Isopleth: Represents imaginary lines with “equal value” e. g. contours
All maps will provide you with a Arrow indicating both truth North (the precise top axis of the earth’s spheroid) and a magnetic north which indicates where our compasses will point to as north North Pole Magnetic South Pole
For global represented of position we use degrees of Latitudes (parallels) and Longitude (meridians). The largest in length degree of latitude is the equator and forms the base line for measurements of degrees of latitude which increase until you reach the north or south pole at which point a right angle has been formed (hence the poles are 900 latitude). At 23. 5 north and south latitude the tropics of Cancer and Capricorn occur respectively.
In contrast to these degrees of latitude which become smaller the degrees of longitude inscribe the same-sized circumferences but do not lie parallel to each other
Cylindrical projections are derived from projecting a spherical surface onto a cylinder. For example if you took you’re orange and wrapped an A 4 sheet of paper around it. The paper can be arranged around the orange in a variety of arrangements A Tangent Projection would result if you wrapped your paper vertically so that the cylinder was parallel to the meridians (lines of longitude).
In the secant case, the cylinder touches the sphere along two lines, both small circles (a circle formed on the surface of the Earth by a plane not passing through the center of the Earth).
Cylindrical projections When the cylinder upon which the sphere is projected is at right angles to the poles, the cylinder and resulting projection are transverse.
When the cylinder upon which the sphere is projected is at right angles to the poles, the cylinder and resulting projection are transverse.
When the cylinder is at some other, nonorthogonal, angle with respect to the poles, the cylinder and resulting projection is oblique.
The Mercator projection is one of the best known and has straight meridians and parallels that intersect at right angles. Scale is true at the equator or at two standard parallels equidistant from the equator. This projection seriously distorts distances and areas.
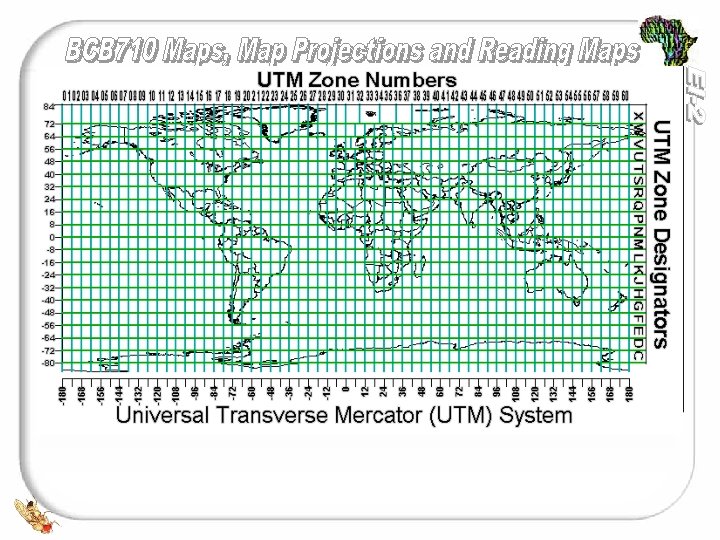
The Universal Transverse Mercator (UTM) is probably the best known projection system for displaying large surfaces of the earth since it provides high levels of precision. To minimize the distortion the cylinder is wrapped around the earth transversely and is place at 60 of rotation East and West of 1800 meridian for each hemisphere. Consequently 60 zones north and 60 zones south are generated and are numbered eastward from the 1800 meridian. Cape Town lies in the 34 th Zone and is referred to as UTM 34 S. The UTM system is only applied from 840 North to 800 South Latitude.
Conic projections which result from projecting a spherical surface onto a cone. When the cone is tangent to the sphere contact is along a small circle such as a latitude. You can view this by twisting your A 4 sheet into a cone and placing over the orange.
Albers Equal Area Conic projection allows areas to be proportional and directions true in limited areas but distorts scale and distance except along standard parallels. This is one of the most common projection used to map large countries where the east-west distances are greater than the north-south extent (e. g. USA and Russia). It is often used to represent South Africa.
Azimuthal or Planar projections are where a flat sheet is placed in contact with a sphere, and points are projected from the sphere to the sheet. You can do this by taking your A 4 sheet and pressing it against the orange.
NON-PROJECTIONS Plane: (Cartesian) - not a projection but truth to earth surface - data may be stored in this form, but it is not good for accurate measurements of distance e. g. metres.
Datums While we often refer to the earth as a sphere, it is more correctly referred to as a geoid (defined as a hypothetical surface of the earth that corresponds to mean sea level). The earth is not a sphere since it is flattened at both poles and bulges at the equator. In addition there are significant bulges and depressions on the surface. The are hundreds of different datums which have been used to estimate the size (areas and distances) of features on the earth. Datums have evolved from those describing a spherical earth to ellipsoidal models derived from years of satellite measurements.
To best describe this geoid mathematically, we use reference ellipsoids to approximate the size and shape of the earth.
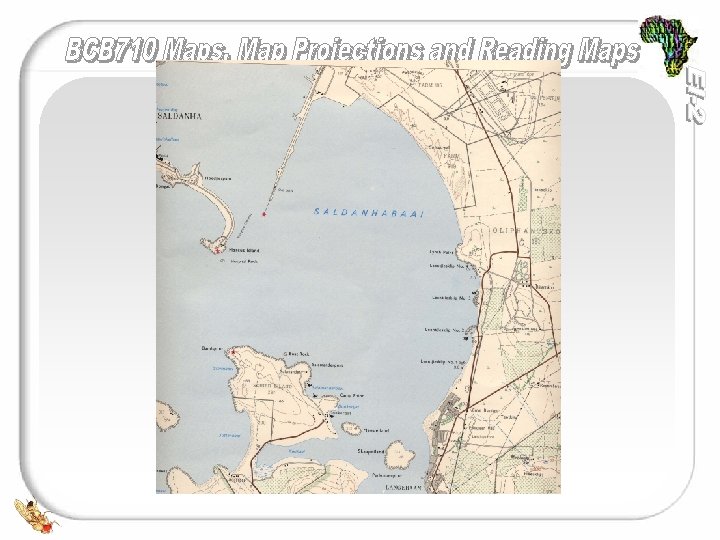
Lets look at a Map - Saldanha Bay
Colour is 153 0 0 Font is 24~36 point Arial Shadow q Dark green font Arial at least 18 point this colour is 70 70 0 q Use animation and the effects of BLINDS for TEXT and DISSOLVE for IMAGES– they are quick and effective and bring in by paragraph and then dim after mouse click to a mid grey colour 150 150 q Give your presentation a header … there is space in the top and it also uses the colour 150, 150 this uses Word Art and can be stretched. Use VIEW / MASTER/ SLIDE MASTER to access q If you need to hyperlink such as this is the URL for NISL if you use this as a template the colour is already set and is 96 132 113. For a visited Hyperlink use this colour which is 204 102 0 q Keep within the frame … this ensures it will not get clipped when projecting. q Use Bullet Points as indicated (Square colour is 128 0 )
Title: My Template Starting Point q This shadow text q This is Hyperlink q This is a visited Hyperlink (not activated) q Secondary Colour 100 0 q Tertiary Colour is 128 0 q Emphasis Colour is 204 153 0 q Use the Grey shaded Back drop with text q
Annotation: Text and Graphics q q q Do each line’s annotation separately Use Blinds and set it to fast (not very fast) Use the Effects Option to dim to grey For Graphics use dissolve annotation Ensure that indenting is not hung to do this first set the bullets to numbers and then back to bullets. Use Box bullet and this green which is 128, 0 Use Rounded Boxes where possible – use Dissolve annotation Graphics should use dissolve annotation
Slide Header and Links q Make sure that you use the Header to complete headings for each slide and check that every slides have a proper heading – not just “slide 1” and “slide 2” but a full heading. q Links should automatically have the correct colour e. g. Google (new link, not visited) – if not working properly thecolour is turquoise and is a reserved colour for links and is 96, 132, 113 q Google (visited link) 204, 102, 0.
Copy and Pasting q To get the features to work require simply copy and pasting of features q Click on the text box and right click on the mouse and a menu should appear and you select the Copy q The move to the slide you wish to past to and right click on the mouse and a menu should appear and you select the Paste q CTRL C and CTRL V are keystrokes that do the same functions
Copy and Pasting – More q In Power Point you can copy the entire slide and paste it complete with the correct formatting q When you copy – you also copy the formatting and the annotation style q To Insert text that has the same format you can copy from your Word document and using Edit and Paste Special and then use unformatted text and this will insert text with no formatting so it will take on the formatting set in the text box.
q q q Use a foot-note approach. Example ~The nautilus is similar in general form to other cephalopods, with a prominent head and tentacles 1 When using superscripts make sure than they are chronologically ordered e. g. 1, 2 and 3. http: //en. wikipedia. org/wiki/Image: Nautilus_pompilius. jpg Referencing For one images, if it is a short URL use grey (150, 150) using Arial Narrow 12 font and turn sideways – otherwise put in notes.
Colour Palette Regular Colours Emphasis Colours – use sparingly Pastel Colours – useful for transparencies