Mapping the Earth Topography Equator Equator Imaginary line


. – NEVER")

: Indicates the difference in elevation between adjacent lines.")


- Slides: 20
Mapping the Earth: Topography
Equator • Equator: Imaginary line that circles the Earth halfway between the North & South Poles. • 0°latitude
Latitude • Latitude: Distance measured in degrees north or south of the equator. • We are at 38°North.
Prime Meridian • Prime Meridian: Imaginary line that runs from the North Pole to the South Pole directly through Greenwich, England. • 0° longitude
Longitude • Longitude: Distances measured in degrees east or west of the prime meridian. • We are at 77°West.
International Date Line • International Date Line: Imaginary line that runs along the 180°longitude. – Transition for calendar days. – Located in the middle of the Pacific Ocean. – Establish by the International Meridian Conference in 1884. 1/1/2013 12/31/2014 – Hawaii is one of the last to bring in the New Year – New Zealand is first to bring in the New Year
Types of Maps 1. Mercator Map 2. Robinson Projection 3. Conic Projection 4. Gnomic Projection 5. Topographic Maps 6. Satellite Mapping (remote sensing)
Map Overview Map Description Advantages Disadvantages Mercator Parallel lines of latitude and longitude Shows direction Distorts size Robinson Parallel lines of Very accurate near latitude, curved lines the equator of longitude Distorted around the edges and near the poles Conic Unfolded cone Accurate lines of latitude Distorted lines of longitude Gnomonic (or Gnomic) Lines of latitude are circles Shows shortest distance between two points Distance and direction distorted
Mercator Projection 1. Mercator Projection – Parallel lines of latitude and longitude – Distorts size – Shows direction accurately – Popular map
Robinson Projection 2. Robinson Projection – Most commonly used map – Distorted around the edges – Accurate everywhere else – Curved lines of longitude
Conic Projection 3. Conic Projection – Very accurate in areas of latitude. – Much distortion of longitude – Most popular for road maps and weather maps.
Gnomonic Projections 4. Gnomonic Projections – The distances and directions are distorted. – Accurately shows the shortest distance between two points – Used by sailors for navigation.
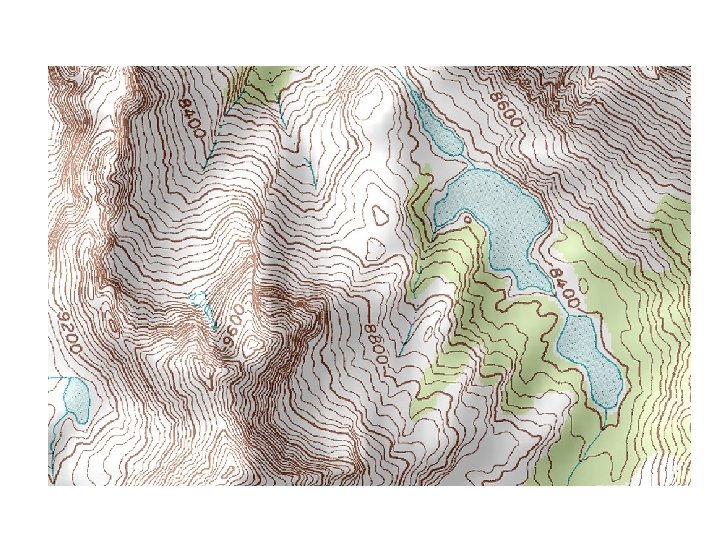
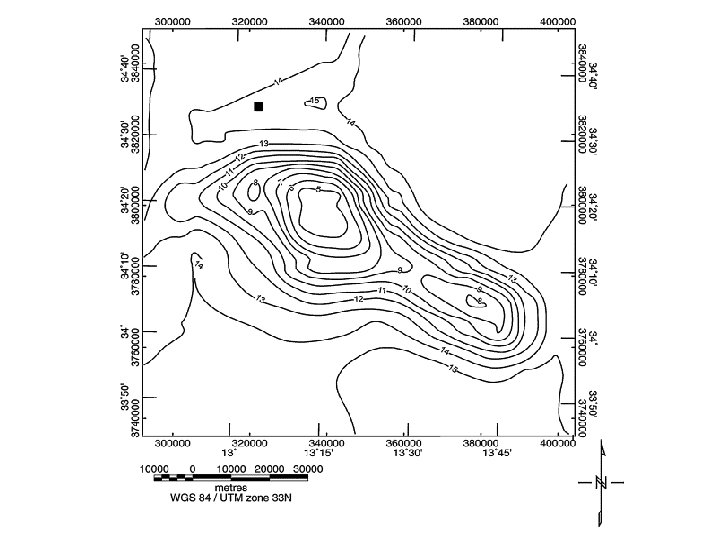
Topographic Maps 5. Topographic Maps • Show Earth’s 3 -D surface on a flat map. – Shows elevation using contour lines. – Very important for geologists, hikers, and campers.
Topographic Maps • Contour Lines – Show elevation (height above sea level). – NEVER cross each other. – All points on the line have the same elevation. – Adjacent lines show a change in elevation. – Every FIFTH line is BOLD and is labeled with elevation.
Indicating all contour lines make it look cluttered
Topographic Maps • Contour Interval (CI): Indicates the difference in elevation between adjacent lines. – The CLOSER the lines are show the steeper the slope – The FURTHER the lines are show the gentler the slope – Circle contour lines show a hill v – Hachure marks show a depression
Contour interval • Distance between contour lines 500’ 12/23/2021 19
Satellite Mapping 6. Satellite Mapping • Remote Sensing – Making maps much more accurate! – Uses orbiting satellites to collect information. • GPS (Global Positioning Systems) - GPS uses an instrument that receives signals to compute the latitude and longitude of location. - Also collects data on speed and direction.