Mapping science using Bibexcel and Pajek By Olle

Mapping science using Bibexcel and Pajek By Olle Persson

Relations • Units of analysis - document level - aggregated level: authors, universities, countries, journals … • Citation based relationes - direct citations - shared references - co-citations • Co-occurrences - co-authorships - co-word

Citatbased relations between dokuments C D A B A cites C = direct citation A and C both cites B = bibliografic coupling A and C are both cited by D = co-citation
 - n of direct of citations - n")
Similarity measures • Frequencies (raw counts) - n of direct of citations - n of co-occurences - n of shared references • Normalized measures - Salton’s index - Jaccard’s index - Pearsons correlation

Mapping science 1. Preparing data 2. Calculating measures 3. Making maps Good if you have some experience with Pajek. You will learn the basics of Bibexcel in this tutorial!

You will need this material 1. A set of data http: //www 8. umu. se/inforsk/esss/cocit 569. tx 2 2. Bibexcel sofware http: //www 8. umu. se/inforsk/Bibexcel/bibexcel. exe 3. Pajek http: //vlado. fmf. uni-lj. si/pub/networks/pajek/ 4. Reading material 1 st chapter in: http: //www 8. umu. se/inforsk/Bibexcel/ollepersson 60. pdf

Preparing data
 Databases=SCI-EXPANDED, SSCI, A&HCI Timespan=All Years. Update 2011 -03 -04 1. Convert")
Topic=(co-citation* OR cocitation*) Databases=SCI-EXPANDED, SSCI, A&HCI Timespan=All Years. Update 2011 -03 -04 1. Convert to Dialog format 1. We have already searched and downloaded 569 records from Web of Science on co-citation analysis and 2. We have already replaced line feeds with carriage return in the downloaded file using Bibexcel: Edit doc-file/Replace line feed with carriage return 3. The file to be used is cocit 569. tx 2 4. Put Bibexcel. exe in c: Bibexcel and coccit 569. tx 2 in c: BibexcelData 5. Start bibexcel. exe, and next we will have to convert to Dialog format that Bibexcel is designed for

You can open Bibexcel and make all steps in this presentation! Select the cocit 569. tx 2 file and run Misc/Convert to Dialog format/Convert from Web of Science

Select cocit 569. doc and press View file Two letter field tag ; = Separates units | = End of field | |= End of record
 Put tag here Units are separated")
2. Extracting data from CD- field (cited documents) Put tag here Units are separated by semicolon Let’s start!

cocit 569. out has the cited documents This is the reference list of doc nr 1

3. Refining the out-file To improve data quality the Edit out-files menu has several options. For example, you may wish to reduce variation by only allowing the 1 st initial in author names. Select cocit 569. out and run Edit out-files/Keep only author’s first initial

Look at cocit 569. 1 st and you can see that EOM SB is changed to EOM S

Let’s improve a little bit more: Select cocit 569. 1 st and run Edit outfiles/Convert Upper lower Case/Good for Cited reference strings

Look at cocit 569. low. I think this looks much nicer compared to the out-file!

Calculating data

1. Looking at frequencies Select cocit 569. low. Tick here Choose Whole string Press Start!

Look at cocit 569. cit which has the cited references in decreasing frequency! For anyone familiar with co-citation research, the top 3 papers shouldn’t come as a surprise.

2. Making co-citations Select the cocit 569. cit-file, press View file. In The list, mark cited references down to frequency=30 and then press Copy, then Clear and then Paste. These are the references for which you want co-citations

Select the cocit 569. low-file, and run Analyze/Co-occurrence/Make pairs via listbox, and answer No to the next question, and OK for the question after that!

The cocit 569. coc had the co-citation frequencies. We will use that file for mapping!

Select cocit 569. coc and run Mapping/Create net-file for Pajek … be sure to answer No to the question if directed arcs, since we do not have any directions here.

The cocit 569. net file can be opened from within Pajek, Netdraw, Mapquation etc for drawing maps.

Mapping with Pajek

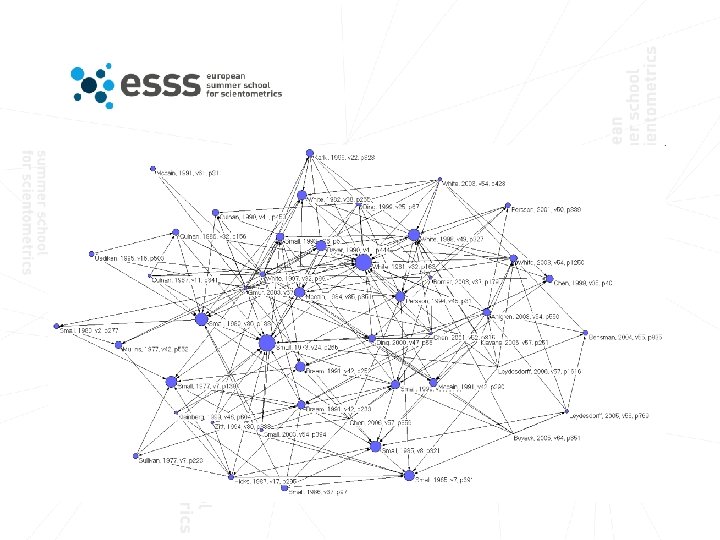
Open cocit 569. net file in Pajek, and then Draw/Draw

This is the first layout with randomly ordered nodes. To the upper left, choose Layout/Energy/Kamada-Kawai/Separate components or just press Ctrl-K

The Kamada-Kawai layout is better but still there is perhps too many lines in the graph, since almost everyone is connected to all others

To reduce complexity minimize the draw window and then run Net/Transform/Remove/Lines with Value/lower than/ and put 10 in the box and answer yes to Make new network. After that run Draw/Draw again!

This map ha more structure. We find that papers to the left and newer ones to the right. You can press Ctrl-K several times to see what happens

Making vectors Making circles on nodes based on citation frequencies. Go to Bibexcel and select cocit 569. cit and the run Mapping/Create vec-file. Below you can see that cocit 569. vec is created

Go back to Pajek. Open the Vector file cocit 569. vec and then run Draw/Draw-Vector

Now you can see that circles correspond to n of citations

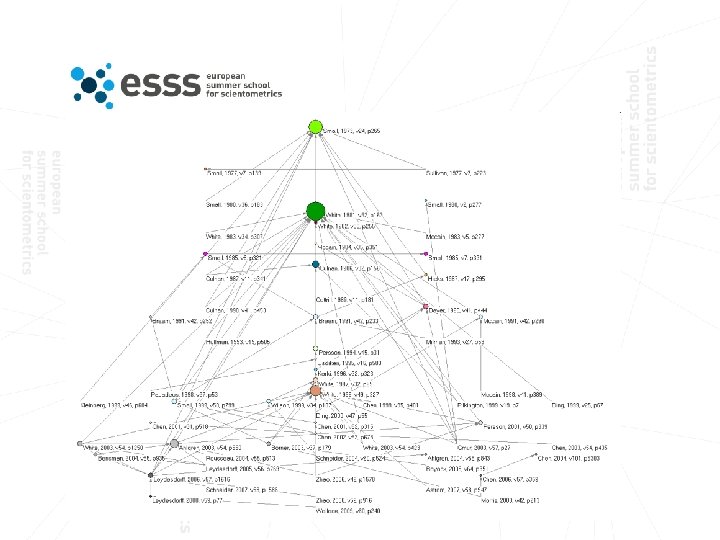
Making partitions If you wish you can create a clu-file using Bibexcel that indicates the publication year, or decade of the cited documents. 1. Select cocit 569. cit and run Edit out-file/Extract publication year from references 2. and you will get a file named cocit 569. dpy. 3. Select cocit 569. dpy and run Mapping/Create clu-file 4. and you will get a file named cocit 569. clu 5. Go to Pajek and open cocit 569. clu as partiotion 6. Run Draw/Draw-Partition-Vector and then in the draw window Layers/In y direction

Makes sense?

Using Options/Lines/Different Widths and Grey. Scale and Options/Size/Of lines = 0. 25 This could be a chronological reading list for reviewers and students

Bibexcel makes so many files…. 1. 2. 3. 4. 5. 6. 7. 8. 9. 10. 11. cocit 569. tx 2: text-file where LF was replaced by CR cocit 569. doc: converted to Dialog-format cocit 569. out : out-file based on CD-field cocit 569. 1 st : keep only author’s first initial cocit 569. low: convert to upper and lower case cocit 569. cit: frequencies cocit 569. coc: co-occurrences cocit 569. net: net-file to be open in Pajek cocit 569. vec: vec-file to be open as Vectors in Pajek cocit 569. clu: clu-file to be open as Partitions in Pajek cocit 569. vel: vertices for net-file for use by Bibexcel …. but better to have them than not!

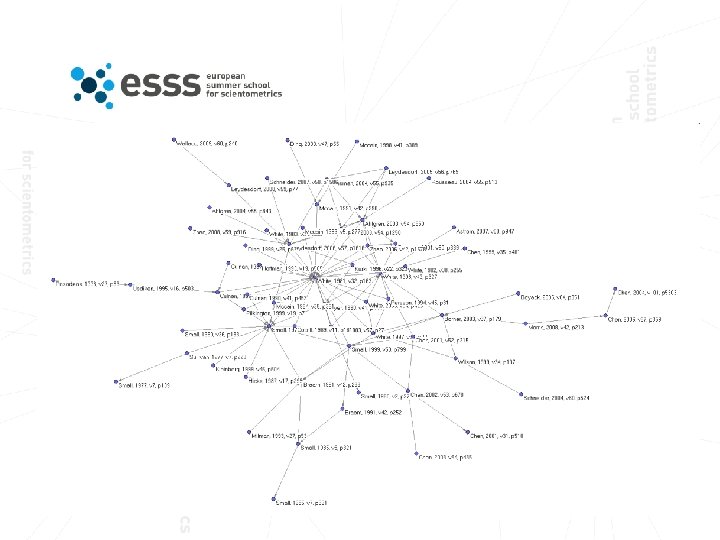
All author co-citation analysis using Scopus records “Its always better not to limit to 1 st cited author as in Wo. S” 1. 2. 3. 4. 5. 6. 7. 8. 9. 10. 11. 12. 13. 14. Get scopuscocit. ris from http: //www 8. umu. se/inforsk/esss/scopuscocit. ris Select scopuscocit. ris and run Edit doc-file/Replace line feed with carriage return Select scopuscocit. tx 2 and run Misc/Convert to Dialog format/Convert from Scopus RIS format Select scopuscocit. doc, put CD in Old tag, choose “Any ; separated field” and press Prep Select scopuscocit. out and run Edit out-file/Scopus tools/Extract all authors from Scopus references Select scopuscocit. sco and run Edit out-file/Decompress outfile Select scopuscocit. nnu, choose Whole string, mark Remove duplicates and Make new outfile, and then press Start Select scopuscocit. oux, mark Sort decending and press Start Select scopuscocit. cit and press View file and select units down to frequencies=30, and be sure only these are in The List Select scopuscocit. oux and run Analyze/Co-occurrences/Make pairs via list box Select the scopuscocit. coc file and then run Mapping/Create net-file for Pajek… Select scopuscocit. cit and run Mapping/Create vec-file Go to Pajek and open scopuscocit. net as Network and scopuscocit. vec as Vectors Run Draw/Draw-Vector…

Draw-vector

To reduce complexity minimize the draw window and then run Net/Transform/Remove/Lines with Value/lower than/ and put 10 in the box and answer yes to Make new network. After that run Draw/Draw-vectorand then ctrl-K Griffith BC would probably not show up in 1 st author analysis Webo metrics Go back and fix this variant!

For vector graphic quality. At the Draw window run Export/2 D/SVG/General and save as allauthormap. htm Get Inkscape free from http: //inkscape. org/download/ and open allauthormap. htm, edit and export to png-format

Analyzing direct citations on Web of Science records 1. 2. 3. 4. 5. 6. 7. Select cocit 569. low and run Analyze/Citations among docs/Make citation links. This will make cocit 569. lin that has citing docnr in first column and cited docnr in second column. Of course you need to label the doc numbers. Select the cocit 569. ddc and double click in the box at “Type new file name here” and the path to cocit 569. ddc should appear. Select cocit 569. lin and run Add data classify/Add labels to docnr-docnr pairs. Answer No to questions about swapping, self-related pairs, overlapping sets, and about writing doc numbers in addition to labels Select cocit 569. add and then run Mapping/Create net-file for Pajek and answer Yes for directed graphs! Open cocit 569. net in Pajek and Draw/Draw You will need to reduce complexity: Run Net/Transform/Reduction/Degree/Input and set value=15. Then Draw! If you would like to have different circle sizes: Minimize Draw window and then run Net/Vector/Summing up values of lines/Input a Vector is created that has the number of inlinks to each node. Then Draw/Draw-vector…
 We can add number of shared outlinks and")
Analyzing using Weighted Direct Citations (WDC) We can add number of shared outlinks and inlinks to each direct citation, to give each direct citation different strength 1. 2. 3. 4. 5. 6. 7. 8. Select cocit 569. lin and run Analyze/Citations among docs/ Weighted Direct Citations (WDC). The cocit 569. wdc has the WDC values for each docnr-docnr pair Again you need to label the doc numbers. Select the cocit 569. ddc and double click in the box at “Type new file name here” and the path to cocit 569. ddc should appear. Select cocit 569. wdc and run Add data classify/Add labels to freq-docnr/making freq-label. Answer No to questions about swapping, selfrelated pairs, and overlapping sets. Select the cocit 569. cdd file and run Edit out-file/Sort numeric/Descending by first column and you will see which are the strongest links by the WDC measure Select cocit 569. cdd and run Mapping/Create net-file for Pajek, and answer Yes for directed arcs! In Pajek use Net/Transform/Remove/Lines with Values/Lower than=10! Then Draw/Draw and you will see one big network component and several smaller ones and quite many isolates. You can zoom in to the bigger one by pressing right mourse button and draw. If you go back to Pajek main window and run Net/Components/Weak and type size=20 you will get 1 component and then with Operations/Extract from network/Partition=1 you will get a new network with the big component. Then Draw that network!

…further improvement by saving major component and adding new partitions and vectors 1. Be sure to mark the main component (with 63 nodes) 2. Then File/Network/Save and then overwrite cocit 569. net 3. In Bibexcel select the cocit 569. net and run Mapping/Create vel-file from net-file 4. Select the cocit 569. ddc file and run Edit out-file/Extract publication year from references 5. Select cocit 569. dpy and run Mapping/Create clu-file 6. Open cocit 569. clu as Partition in Pajek and then Draw/Draw-partition and then Layers/In y direction 7. If you would like to have different circle sizes: Minimize Draw window and then run Net/Vector/Summing up values of lines/Input a Vector is created that has the sum of WDC values of inlinks to each node. Then Draw/Draw-Partition-Vector…

…reduce direct citations by citation year lag 1. 2. 3. 4. 5. 6. 7. 8. 9. Select cocit 569. cdd and run Analyze/Calculate year lags in pairs and answer Yes to add year lag values, which will come in column 1. Column 2 has a normalization (col. 3 divided by col. 3, ) and col. 3 has the WDC value, col. 4 citing doc and col. 5 cited doc. Select cocit 569. lag and to get year lags 0 -2 years put 2 in Max number Box and then run Edit out-files/Delete values high frequencies Select cocit 569. max, put 3/4/5 in The Box and run Edit out-file/Select columns Now cocit 569. col has WDC values only for links no older than 2 years! Select cocit 569. col and run Mapping/Create net-file for Pajek Go to Pajek and open the net-file and the vec-file! Removed lines with values less than 5, then Net/Componenets/Weak (min 20), then extract and save the major component to file cocit 569. net In Bibexcel, select cocit 569. cdd, put 1/3 in The Box and run Edit out-files/Select columns, and then select cosit 569. col and make frequencies with whole string, then cocit 569. cit will have number of times a paper is cited. In Bibexcel select cocit 569. net and run Mapping/Create vel-file from net-file and then select the cocit 569. cit and run Mapping/Create vec-file Back to Pajek and open the vec-file, and then Draw/Draw-vector

n io T e im di m s en is r he e!

…also, you can reduce co-citations by citation year lag 1. Select cocit 569. coc and run Analyze/Calculate year lags in pairs and answer Yes to add year lag values 2. Select cocit 569. lag and to get year lags 0 -5 years put 5 in Max number Box and then run Edit out-files/Delete values high frequencies 3. Select cocit 569. max, put 1/4/5 in The Box and run Edit out-file/Select columns 4. Now cocit 569. col has co-citations values only for pairs no older than 5 years! 5. Select cocit 569. col and run Mapping/Create net-file for Pajek 6. Also select cocit 569. cit and run Mapping/Create vec-file 7. Go to Pajek and open the net-file and the vec-file!
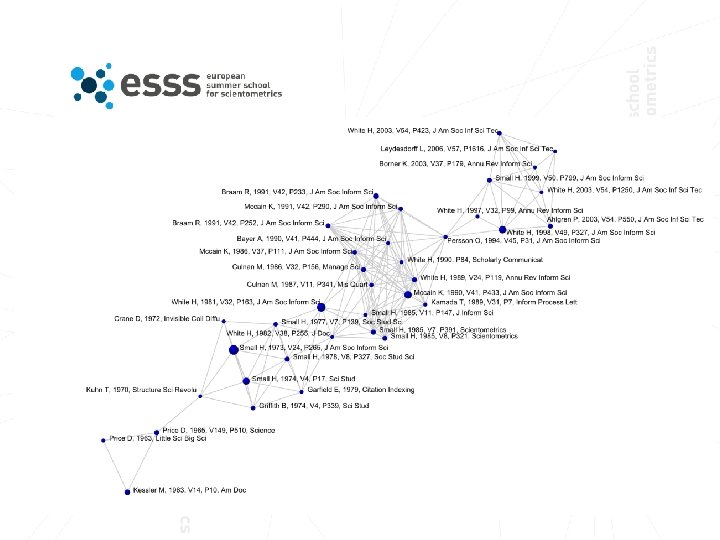

The same graph as previous, but now ordered in year layers and edited using Inkscape

The End
- Slides: 53