Mapping Quantities as Continuous Surfaces isarithmic and raster


")


- Slides: 34
Mapping Quantities as Continuous Surfaces: isarithmic and raster maps GEOG 416 A-516 A Gary Christopherson
Review – Preview Review n Foundational issues Preview n Cartographic processes, geodesy, data models, etc. n n Symbolization & Classification Mapping Quantities q q Choropleth maps Graduated Symbols Dot Density Maps Flow maps 10/22/2021 Mapping Quantities q q n n Isarithm and Raster Maps Cartograms Map Layout and Design Issues Web Mapping
Overview n n n Definitions Isarithm Rasters q q q Review Backgrounds Natural Surfaces Analytical Models Pseudo 3 D
Definitions n Isarithm: q q An isoline drawn according to values that can occur at points; an isometric line. A line connecting points of equal value on a map; an isoline. Source: Mc. Graw Hill
Isolines n n Isolines are vector representations of continuous data Conceptually, it is helpful to understand them in three dimensions Source: Mc. Graw Hill
Isoline Creation n Traditionally, isolines are constructed from a finite number of points Line is drawn based on interpolated values between points Once drawn, the line is smoothed Source: Mc. Graw Hill
Isoline Creation 2 n When points are few n Interpolate additional point values, or Interpolate raster, then Interpolate isolines n n Source: Mc. Graw Hill
Types of Isolines n n There as many types of isolines as there are quantitative data types collected as points. Many of these have specific names
Creating Isolines in Arc. GIS
Creating Isolines in Arc. GIS
Low Pass Filter and Raster based Iso. Lines Raw DEM Contours RNR 420 -520 Filtered DEM Contours DEM Derived Products 12
Overview n n n Definitions Iso lines Rasters q q q Review Backgrounds Natural Surfaces Analytical Models Pseudo 3 D
Review: Models of Spatial Information 10/22/2021
Logical Models: Raster Structures In a raster structure, data are stored in a grid of columns and rows. The intersection of each row and column is known as a cell. Each cell corresponds to x and y coordinates in the real world and contains a z value that can represent anything from elevation, to census data, to whatever.
Rasters as Backround Image (provides context)
Natural Surfaces n n The natural world is made up of continuous surfaces Raster is the ideal spatial model to illustrate these surfaces
Rasters and Natural Surfaces n n n Elevation is probably the most common natural surface modeled for maps Contours are one way to do this Rasters are another way
Rasters and Natural Surfaces n n Surfaces can be symbolized from low to high using a color ramp Or in the case of elevation, traditional ramp colors can be used to give the idea of rising or lowering elevation
Continuous Surfaces and Color Ramps n n n Color ramps are applied to stretched data Stretched data organizes the values, no matter how many there are, into 256 classes Colors are assigned based on these classes
Rasters and Natural Surfaces n n Because it is about numbers, raster surfaces can be used to create new surfaces like relief, or a hillshade
Rasters and Natural Surfaces n n Hillshades can be used to create a classic cartographic product – a shaded relief map Most often used as a reference layer – to help people orient themselves within the map
Rasters and Analytical Models n n n Rasters are about numbers and they are really, really good at analytical modeling Any type of math or statistic based model is relatively easy to create using rasters They are good story tellers
Rasters and Analytical Models n n n Rasters are about numbers and they are really, really good at analytical modeling Any type of math or statistics based model is relatively easy to create using rasters They are good story tellers
Continuous Surfaces and Legends
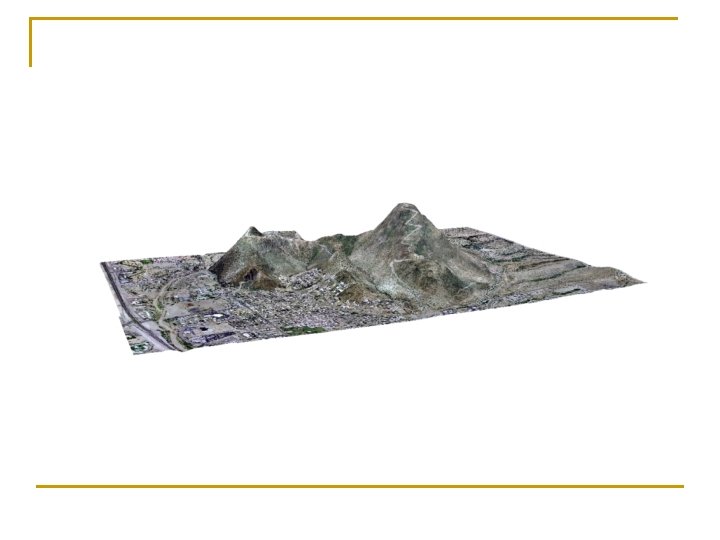
Pseudo 3 D Surfaces n n Pseudo because they are on a flat surface, but they appear to be 3 D Most often used for elevation, although any continuous surface can be viewed this way Source: Mc. Graw Hill
Elevation Draped on Elevation
Analytical Model Draped on Elevation
Analytical Model Draped on Analytical Surface
Draping an image in Arc. Scene requires an image and a surface on which to drape it.
In the properties dialogue for the image, browse to the surface and set the z unit conversion
Pseudo 3 D and Maps n n n Seldom presented in traditional map formats Usually digital only Often animated to show different perspectives or flythroughs
3 D Animation https: //www. youtube. com/watch? v=oq 3 -Kq 9 lye. U
Isoline Drawing Practice 49 50 76 60 51 69 60 79 86 71 58 70 80 90 93 65 74 82 91 87