
MAPPING OF AIR POLLUTANTS AND THEIR EMISSIONS FROM


- Slides: 32
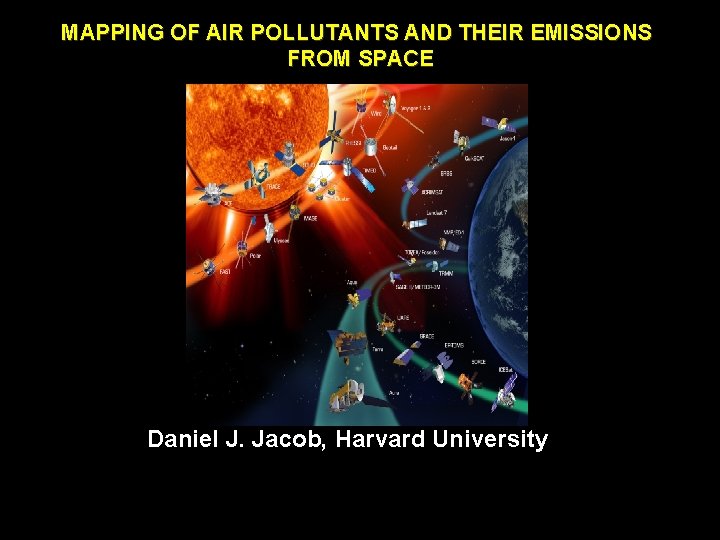
MAPPING OF AIR POLLUTANTS AND THEIR EMISSIONS FROM SPACE Daniel J. Jacob, Harvard University
NASA Earth & Sun Spacecraft
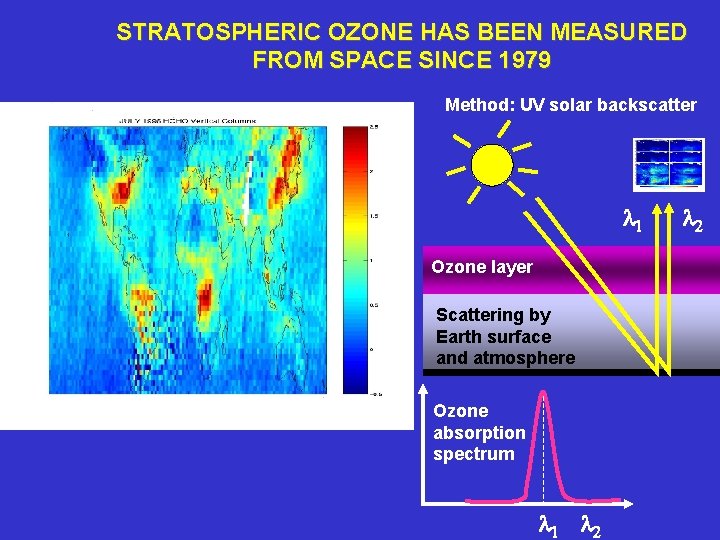
STRATOSPHERIC OZONE HAS BEEN MEASURED FROM SPACE SINCE 1979 Method: UV solar backscatter l 1 Ozone layer Scattering by Earth surface and atmosphere Ozone absorption spectrum l 1 l 2
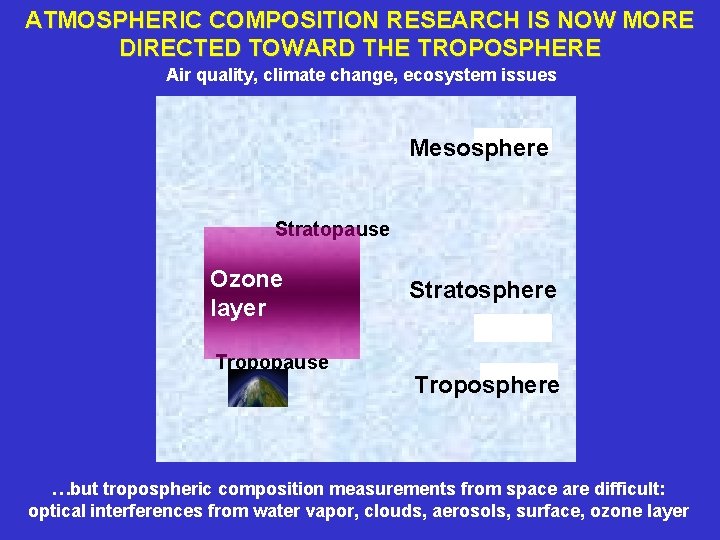
ATMOSPHERIC COMPOSITION RESEARCH IS NOW MORE DIRECTED TOWARD THE TROPOSPHERE Air quality, climate change, ecosystem issues Mesosphere Stratopause Ozone layer Tropopause Stratosphere Troposphere …but tropospheric composition measurements from space are difficult: optical interferences from water vapor, clouds, aerosols, surface, ozone layer
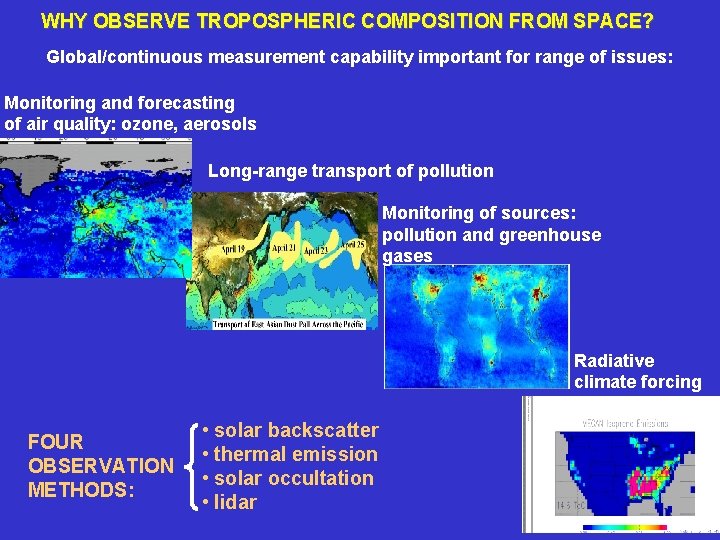
WHY OBSERVE TROPOSPHERIC COMPOSITION FROM SPACE? Global/continuous measurement capability important for range of issues: Monitoring and forecasting of air quality: ozone, aerosols Long-range transport of pollution Monitoring of sources: pollution and greenhouse gases Radiative climate forcing FOUR OBSERVATION METHODS: • solar backscatter • thermal emission • solar occultation • lidar
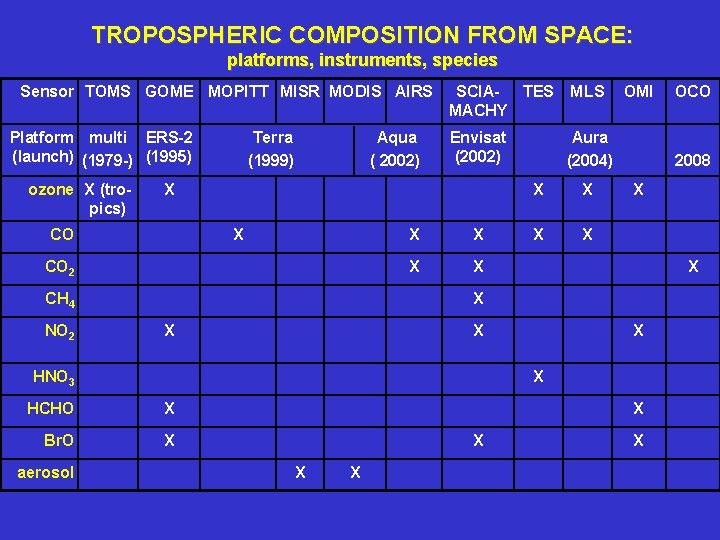
TROPOSPHERIC COMPOSITION FROM SPACE: platforms, instruments, species Sensor TOMS GOME MOPITT MISR MODIS AIRS Platform multi ERS-2 (launch) (1979 -) (1995) ozone X (tropics) Terra (1999) Aqua ( 2002) MLS Envisat (2002) Aura (2004) X CO 2 CH 4 NO 2 SCIA- TES MACHY X X X X HCHO X Br. O X X X OCO 2008 X HNO 3 aerosol X OMI X
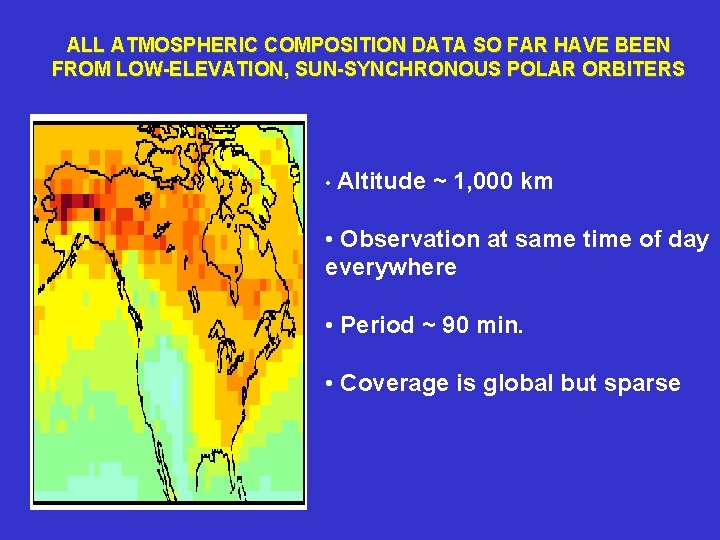
ALL ATMOSPHERIC COMPOSITION DATA SO FAR HAVE BEEN FROM LOW-ELEVATION, SUN-SYNCHRONOUS POLAR ORBITERS • Altitude ~ 1, 000 km • Observation at same time of day everywhere • Period ~ 90 min. • Coverage is global but sparse
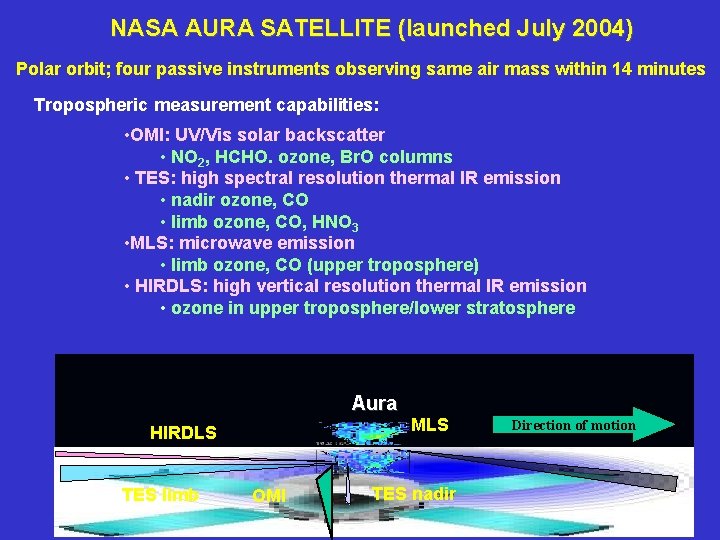
NASA AURA SATELLITE (launched July 2004) Polar orbit; four passive instruments observing same air mass within 14 minutes Tropospheric measurement capabilities: • OMI: UV/Vis solar backscatter • NO 2, HCHO. ozone, Br. O columns • TES: high spectral resolution thermal IR emission • nadir ozone, CO • limb ozone, CO, HNO 3 • MLS: microwave emission • limb ozone, CO (upper troposphere) • HIRDLS: high vertical resolution thermal IR emission • ozone in upper troposphere/lower stratosphere Aura HIRDLS TES limb OMI MLS TES nadir Direction of motion
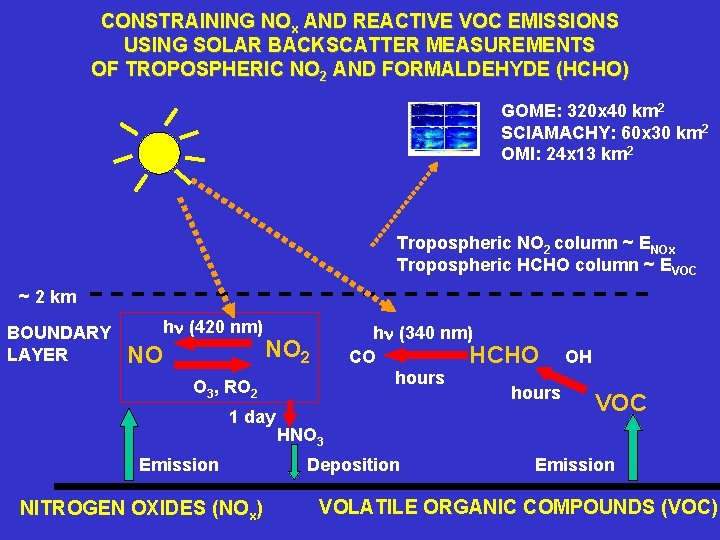
CONSTRAINING NOx AND REACTIVE VOC EMISSIONS USING SOLAR BACKSCATTER MEASUREMENTS OF TROPOSPHERIC NO 2 AND FORMALDEHYDE (HCHO) GOME: 320 x 40 km 2 SCIAMACHY: 60 x 30 km 2 OMI: 24 x 13 km 2 Tropospheric NO 2 column ~ ENOx Tropospheric HCHO column ~ EVOC ~ 2 km BOUNDARY LAYER hn (420 nm) NO hn (340 nm) HCHO OH CO hours NO 2 O 3, RO 2 1 day Emission NITROGEN OXIDES (NOx) VOC HNO 3 Deposition Emission VOLATILE ORGANIC COMPOUNDS (VOC)
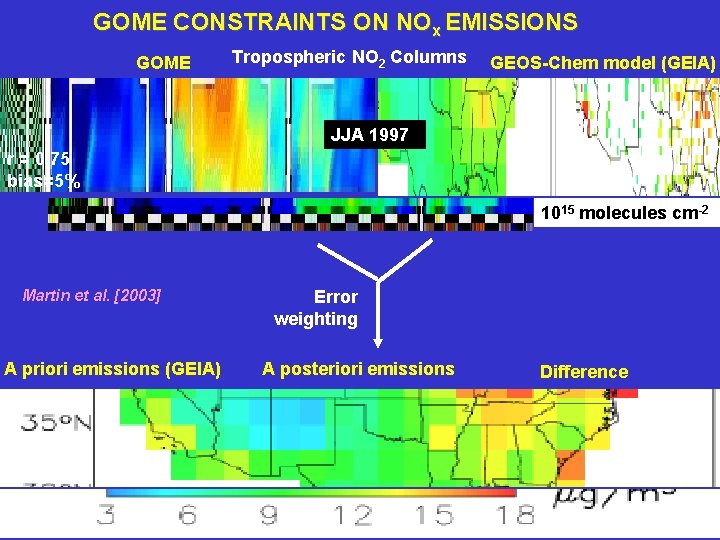
GOME CONSTRAINTS ON NOx EMISSIONS GOME Tropospheric NO 2 Columns GEOS-Chem model (GEIA) JJA 1997 r = 0. 75 bias=5% 1015 molecules cm-2 Martin et al. [2003] A priori emissions (GEIA) Error weighting A posteriori emissions Difference
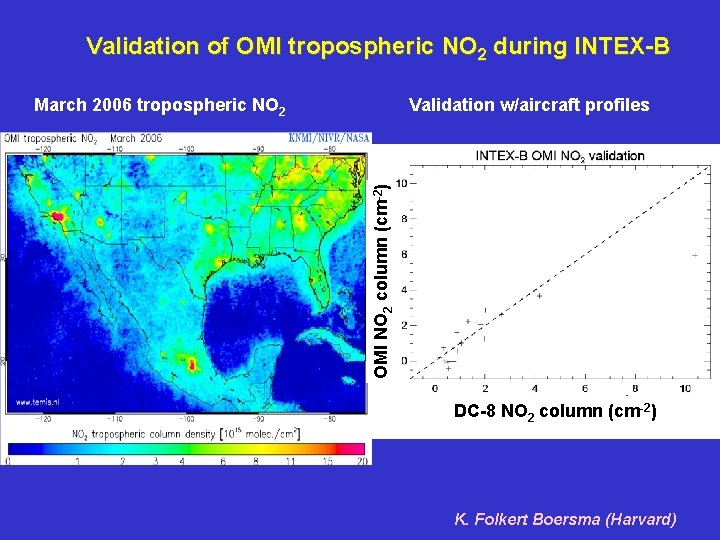
Validation of OMI tropospheric NO 2 during INTEX-B Validation w/aircraft profiles OMI NO 2 column (cm-2) March 2006 tropospheric NO 2 DC-8 NO 2 column (cm-2) K. Folkert Boersma (Harvard)
Difference between SCIA (10 local) and OMI (1345): instrument bias or diurnal cycle? K. Folkert Boersma (Harvard)
SCIAMACHY and OMI observe fast chemistry and emissions from space
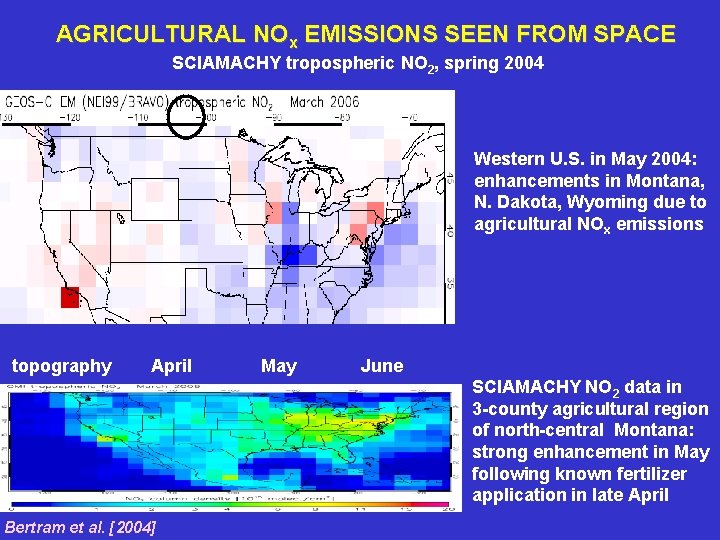
AGRICULTURAL NOx EMISSIONS SEEN FROM SPACE SCIAMACHY tropospheric NO 2, spring 2004 Western U. S. in May 2004: enhancements in Montana, N. Dakota, Wyoming due to agricultural NOx emissions topography April May June SCIAMACHY NO 2 data in 3 -county agricultural region of north-central Montana: strong enhancement in May following known fertilizer application in late April Bertram et al. [2004]
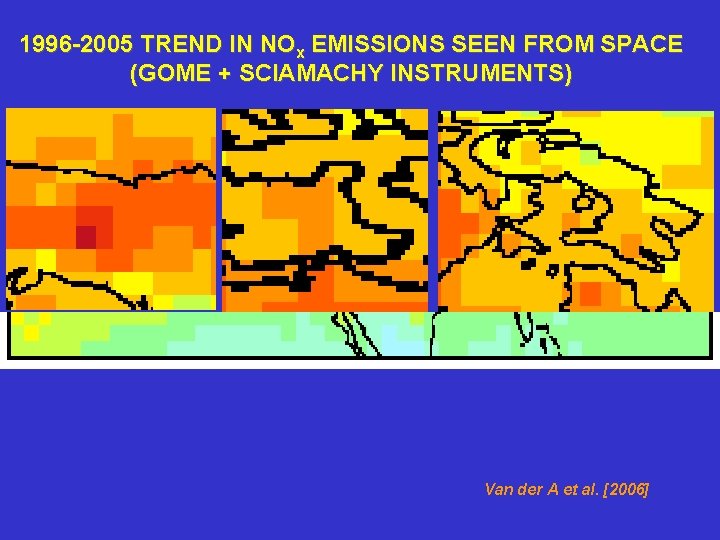
1996 -2005 TREND IN NOx EMISSIONS SEEN FROM SPACE (GOME + SCIAMACHY INSTRUMENTS) Van der A et al. [2006]
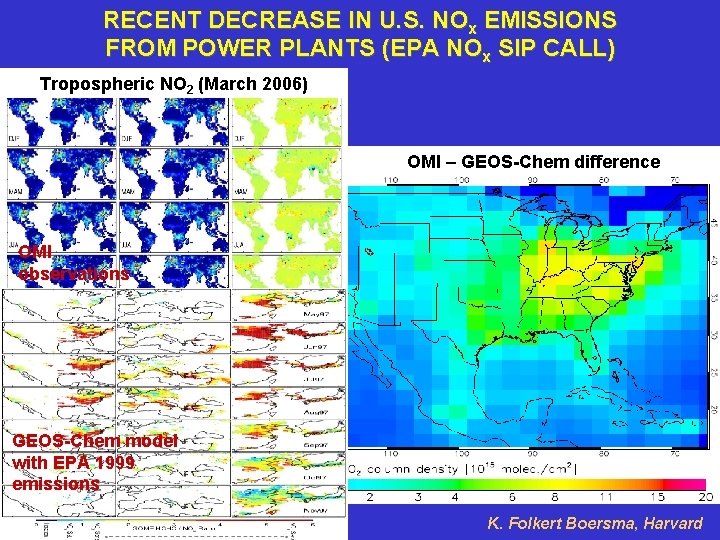
RECENT DECREASE IN U. S. NOx EMISSIONS FROM POWER PLANTS (EPA NOx SIP CALL) Tropospheric NO 2 (March 2006) OMI – GEOS-Chem difference OMI observations GEOS-Chem model with EPA 1999 emissions K. Folkert Boersma, Harvard
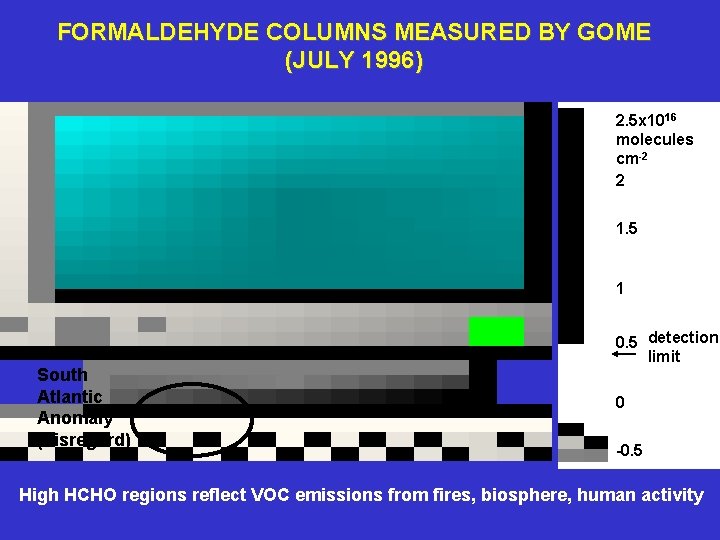
FORMALDEHYDE COLUMNS MEASURED BY GOME (JULY 1996) 2. 5 x 10¹⁶ molecules cm-2 2 1. 5 1 South Atlantic Anomaly (disregard) 0. 5 detection limit 0 -0. 5 High HCHO regions reflect VOC emissions from fires, biosphere, human activity
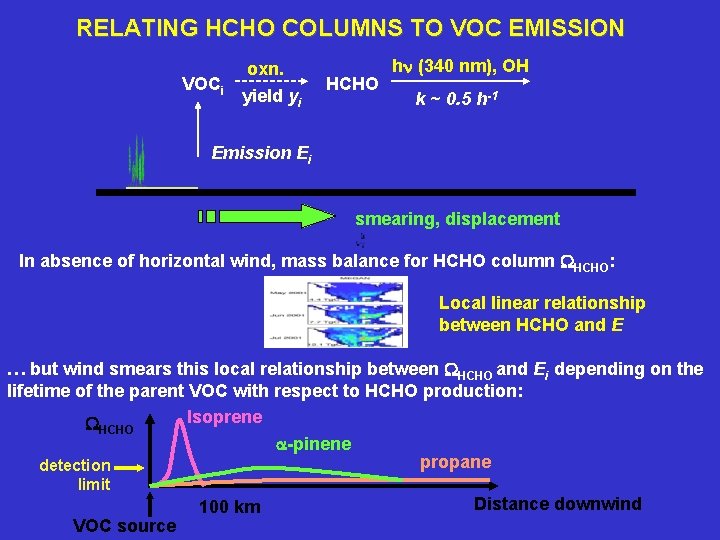
RELATING HCHO COLUMNS TO VOC EMISSION VOCi oxn. yield yi HCHO hn (340 nm), OH k ~ 0. 5 h-1 Emission Ei smearing, displacement In absence of horizontal wind, mass balance for HCHO column WHCHO: Local linear relationship between HCHO and E … but wind smears this local relationship between WHCHO and Ei depending on the lifetime of the parent VOC with respect to HCHO production: Isoprene WHCHO a-pinene propane detection limit VOC source 100 km Distance downwind
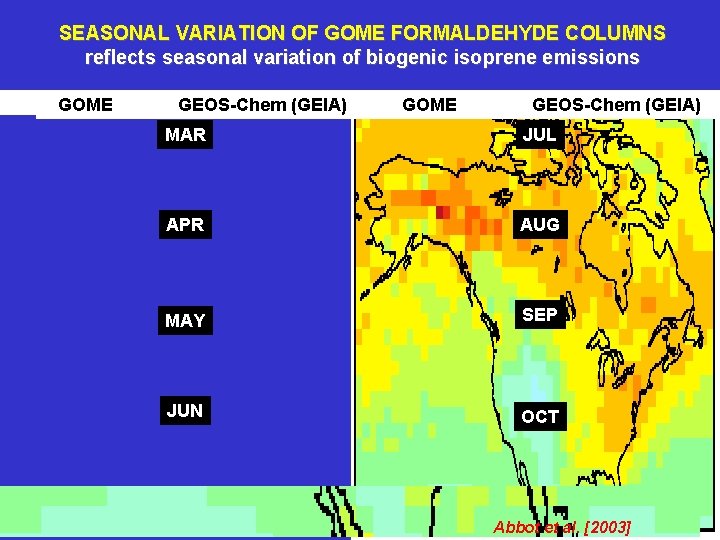
SEASONAL VARIATION OF GOME FORMALDEHYDE COLUMNS reflects seasonal variation of biogenic isoprene emissions GOME GEOS-Chem (GEIA) MAR JUL APR AUG MAY SEP JUN OCT Abbot et al. [2003]
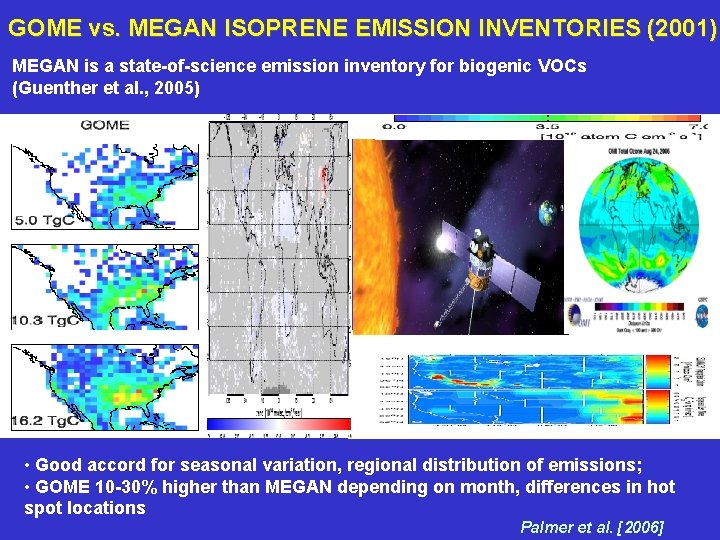
GOME vs. MEGAN ISOPRENE EMISSION INVENTORIES (2001) MEGAN is a state-of-science emission inventory for biogenic VOCs (Guenther et al. , 2005) • Good accord for seasonal variation, regional distribution of emissions; • GOME 10 -30% higher than MEGAN depending on month, differences in hot spot locations Palmer et al. [2006]
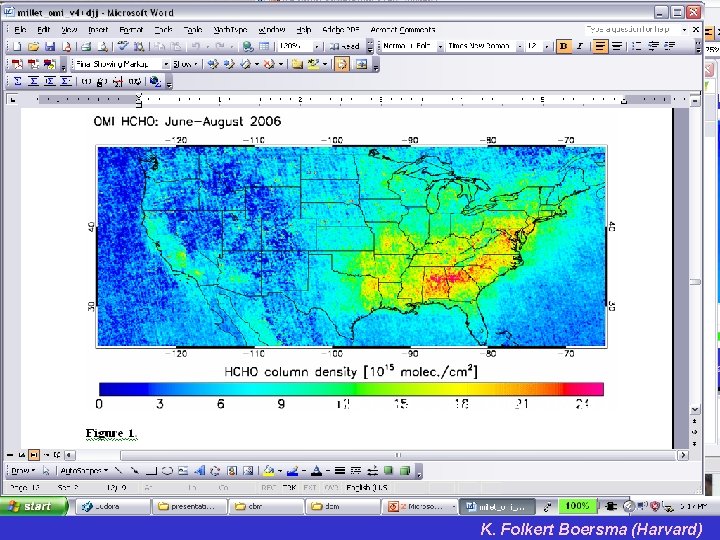
FORMALDEHYDE FROM OMI: MAPPING OF REACTIVE HYDROCARBON SOURCES Shows vegetation to be dominant; anthropogenic source hardly detectable Thomas Kurosu (Harvard/SAO) and Dylan B. Millet (Harvard)
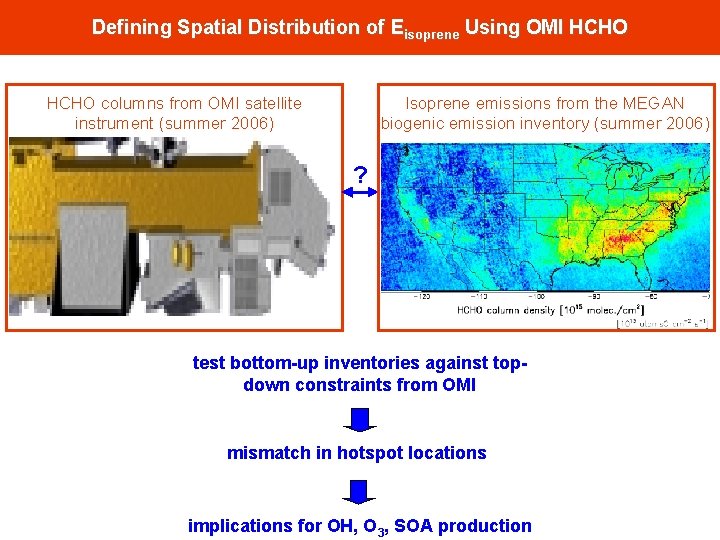
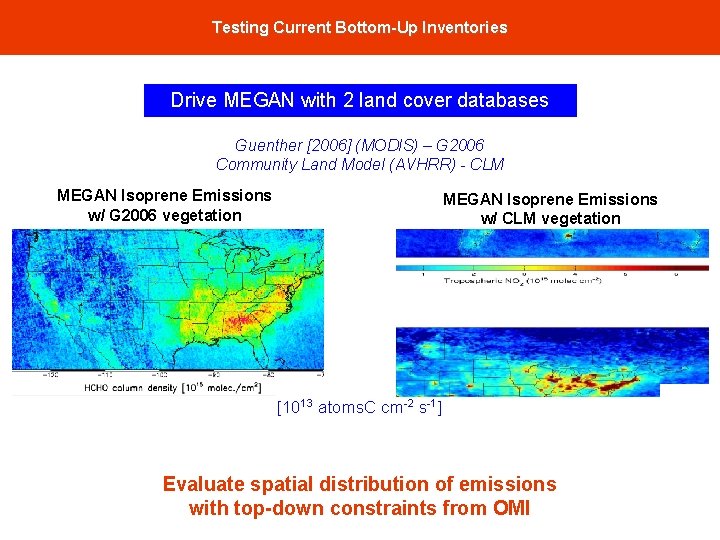
Defining Spatial Distribution of Eisoprene Using OMI HCHO Isoprene emissions from the MEGAN biogenic emission inventory (summer 2006) HCHO columns from OMI satellite instrument (summer 2006) ? test bottom-up inventories against topdown constraints from OMI mismatch in hotspot locations implications for OH, O 3, SOA production
Testing Current Bottom-Up Inventories Drive MEGAN with 2 land cover databases Guenther [2006] (MODIS) – G 2006 Community Land Model (AVHRR) - CLM MEGAN Isoprene Emissions w/ G 2006 vegetation MEGAN Isoprene Emissions w/ CLM vegetation [1013 atoms. C cm-2 s-1] Evaluate spatial distribution of emissions with top-down constraints from OMI
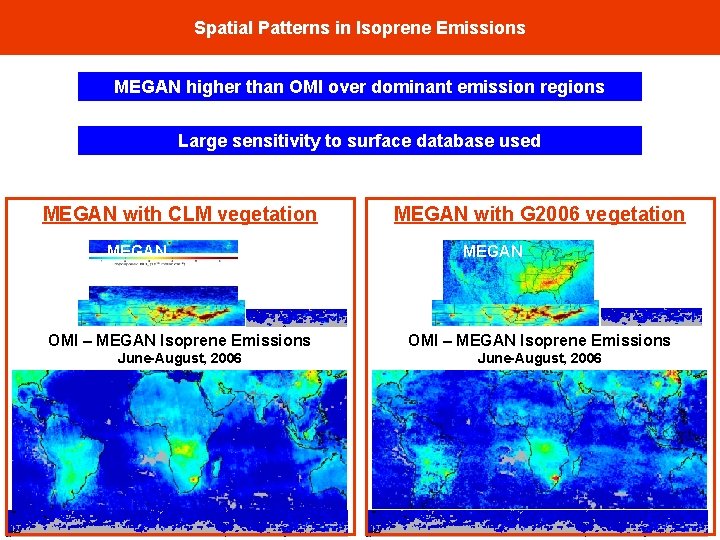
Spatial Patterns in Isoprene Emissions MEGAN higher than OMI over dominant emission regions Large sensitivity to surface database used MEGAN with CLM vegetation MEGAN with G 2006 vegetation MEGAN OMI – MEGAN Isoprene Emissions June-August, 2006
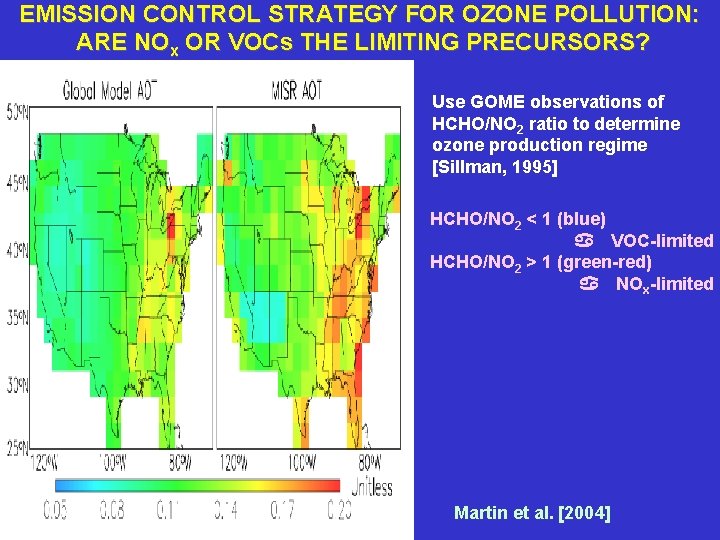
EMISSION CONTROL STRATEGY FOR OZONE POLLUTION: ARE NOx OR VOCs THE LIMITING PRECURSORS? Use GOME observations of HCHO/NO 2 ratio to determine ozone production regime [Sillman, 1995] HCHO/NO 2 < 1 (blue) a VOC-limited HCHO/NO 2 > 1 (green-red) a NOx-limited Martin et al. [2004]
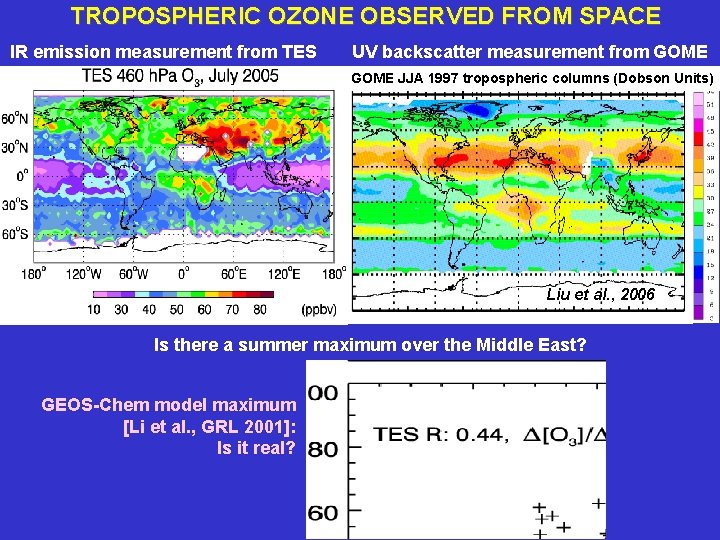
TROPOSPHERIC OZONE OBSERVED FROM SPACE IR emission measurement from TES UV backscatter measurement from GOME JJA 1997 tropospheric columns (Dobson Units) Liu et al. , 2006 Is there a summer maximum over the Middle East? GEOS-Chem model maximum [Li et al. , GRL 2001]: Is it real?
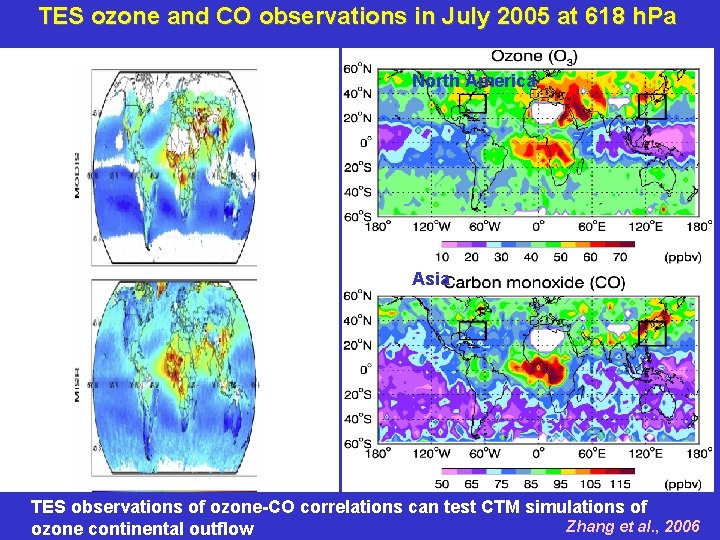
TES ozone and CO observations in July 2005 at 618 h. Pa North America Asia TES observations of ozone-CO correlations can test CTM simulations of Zhang et al. , 2006 ozone continental outflow
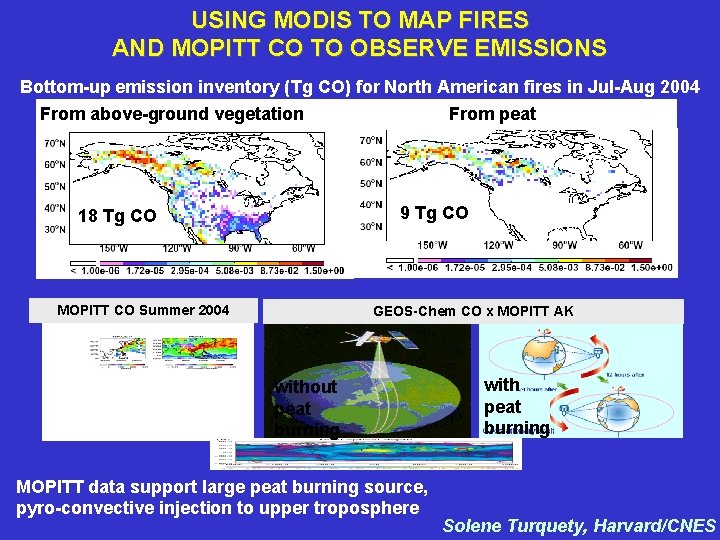
USING MODIS TO MAP FIRES AND MOPITT CO TO OBSERVE EMISSIONS Bottom-up emission inventory (Tg CO) for North American fires in Jul-Aug 2004 From above-ground vegetation From peat 9 Tg CO 18 Tg CO MOPITT CO Summer 2004 GEOS-Chem CO x MOPITT AK without peat burning MOPITT data support large peat burning source, pyro-convective injection to upper troposphere with peat burning Solene Turquety, Harvard/CNES
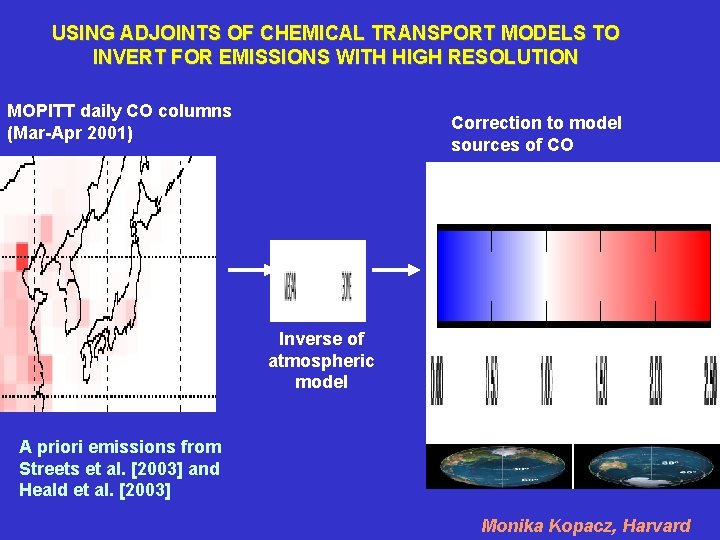
USING ADJOINTS OF CHEMICAL TRANSPORT MODELS TO INVERT FOR EMISSIONS WITH HIGH RESOLUTION MOPITT daily CO columns (Mar-Apr 2001) Correction to model sources of CO Inverse of atmospheric model A priori emissions from Streets et al. [2003] and Heald et al. [2003] Monika Kopacz, Harvard
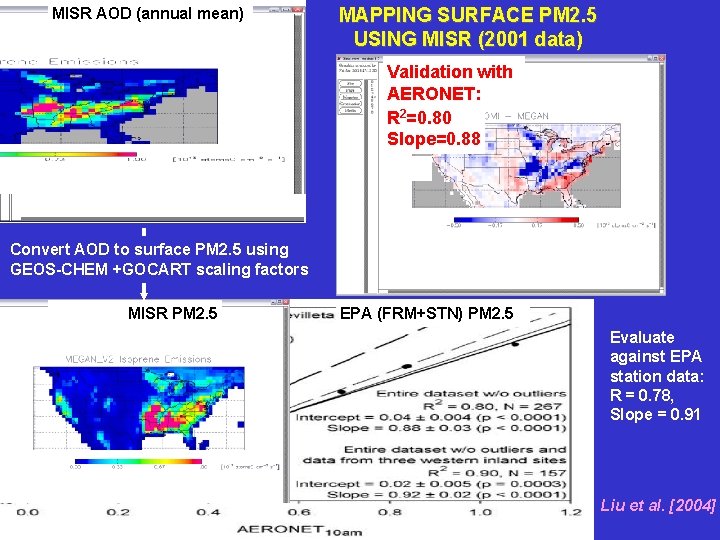
MISR AOD (annual mean) MAPPING SURFACE PM 2. 5 USING MISR (2001 data) Validation with AERONET: R 2=0. 80 Slope=0. 88 Convert AOD to surface PM 2. 5 using GEOS-CHEM +GOCART scaling factors MISR PM 2. 5 EPA (FRM+STN) PM 2. 5 Evaluate against EPA station data: R = 0. 78, Slope = 0. 91 Liu et al. [2004]
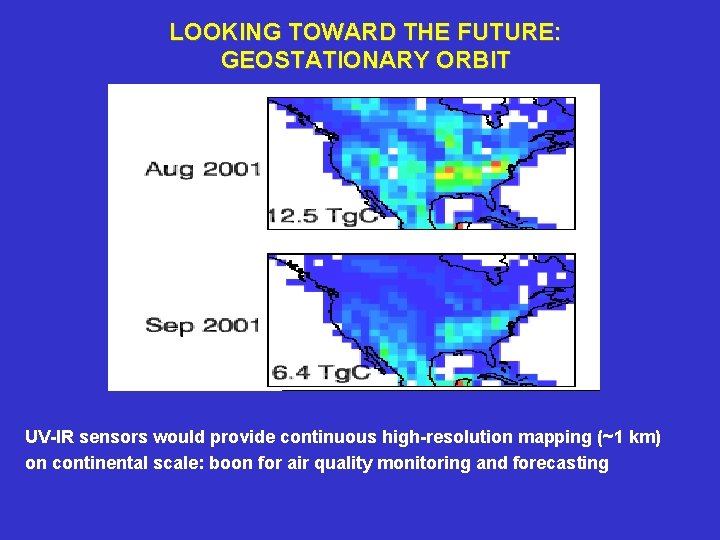
LOOKING TOWARD THE FUTURE: GEOSTATIONARY ORBIT UV-IR sensors would provide continuous high-resolution mapping (~1 km) on continental scale: boon for air quality monitoring and forecasting
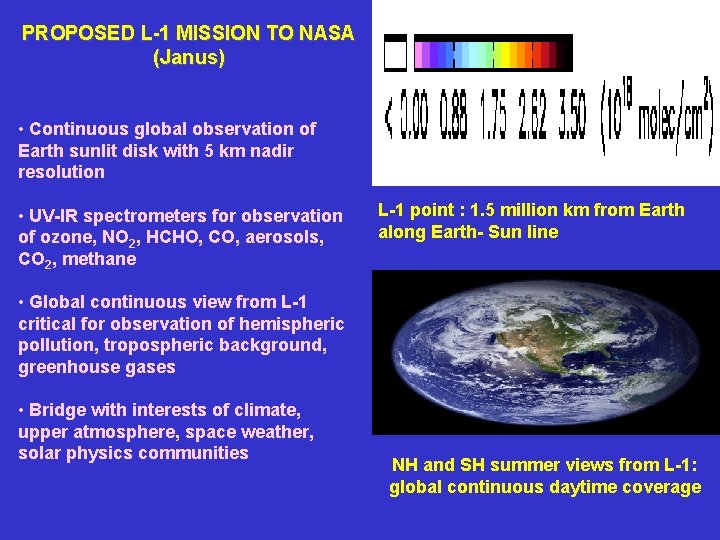
PROPOSED L-1 MISSION TO NASA (Janus) • Continuous global observation of Earth sunlit disk with 5 km nadir resolution • UV-IR spectrometers for observation of ozone, NO 2, HCHO, CO, aerosols, CO 2, methane L-1 point : 1. 5 million km from Earth along Earth- Sun line • Global continuous view from L-1 critical for observation of hemispheric pollution, tropospheric background, greenhouse gases • Bridge with interests of climate, upper atmosphere, space weather, solar physics communities NH and SH summer views from L-1: global continuous daytime coverage