Mapping migration Bruce Mitchell GIS and Mapping Unit

Mapping migration Bruce Mitchell GIS and Mapping Unit ONS Geography Special thanks are due to Martin Ralphs, Theo Manassis, Iva Špakulová and Jeremy Brocklehurst

Brief to identify • Migration catchment areas, and ‘stagnant’ areas in England Wales • Defined in terms of towns or cities • Very quick turnaround required – so published data • Local authority level

Scope of this presentation • The use of spatial analysis, mapping and unconventional graphics to answer a high-profile research question. • Not an exposition of demographic change. • Implications of the geography must be understood for sensible conclusions to be drawn. • The geography may conceal, or misrepresent, spatial characteristics of the data.
 making a residential move of at")
The data • All persons (aged 25 -64) making a residential move of at least a year. • Estimates based in part on the NHS Patient Register (NHSPR). • Migrations only recorded where person changes GP and where new address in different district.

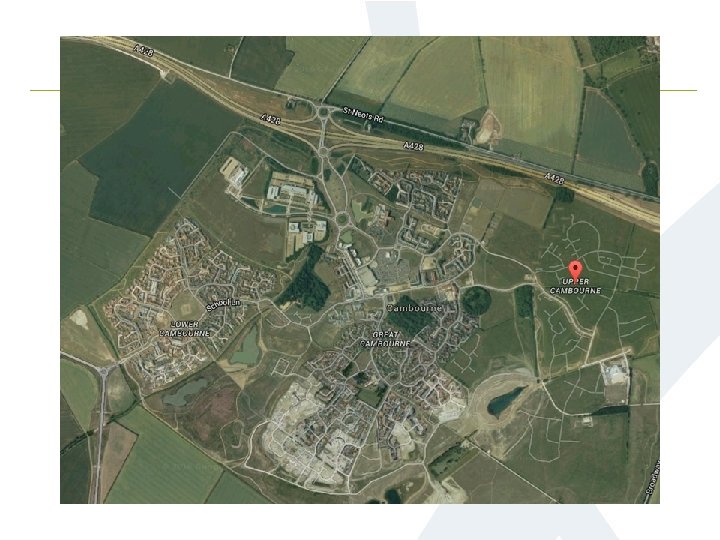
The Local Authority Geography © Crown copyright and database rights 2016 Ordnance Survey 100019153

The Local Authority Geography Pop. 132, 700 Area 5, 195 km 2 Pop. Dens. 26 pers. / km 2 © Crown copyright and database rights 2016 Ordnance Survey 100019153

The Local Authority Geography Pop. 132, 700 Area 5, 195 km 2 Pop. Dens. 26 pers. / km 2 Pop. 96, 200 Area 36 km 2 Pop. Dens. 2, 679 pers. / km 2 © Crown copyright and database rights 2016 Ordnance Survey 100019153

The Local Authority Geography Pop. 132, 700 Area 5, 195 km 2 Pop. Dens. 26 pers. / km 2 Pop. 96, 200 Area 36 km 2 Pop. Dens. 2, 679 pers. / km 2 © Crown copyright and database rights 2016 Ordnance Survey 100019153 Pop. 221, 000 Area 15 km 2 Pop. Dens. 14, 517 pers. / km 2
 demonstrated")
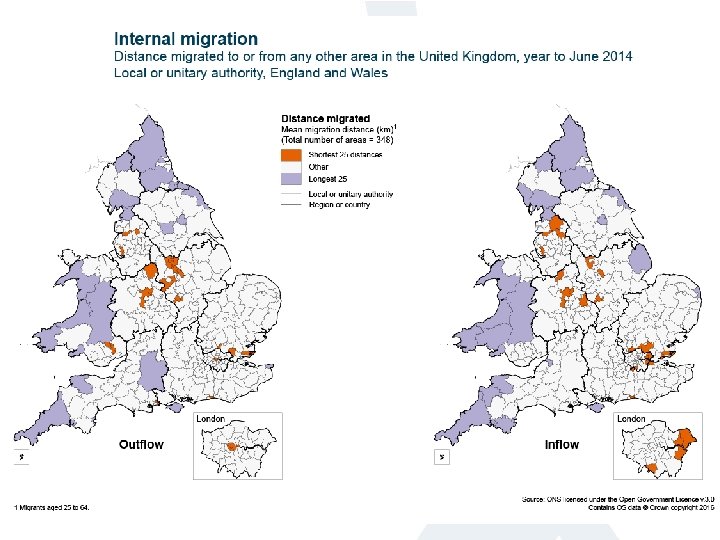
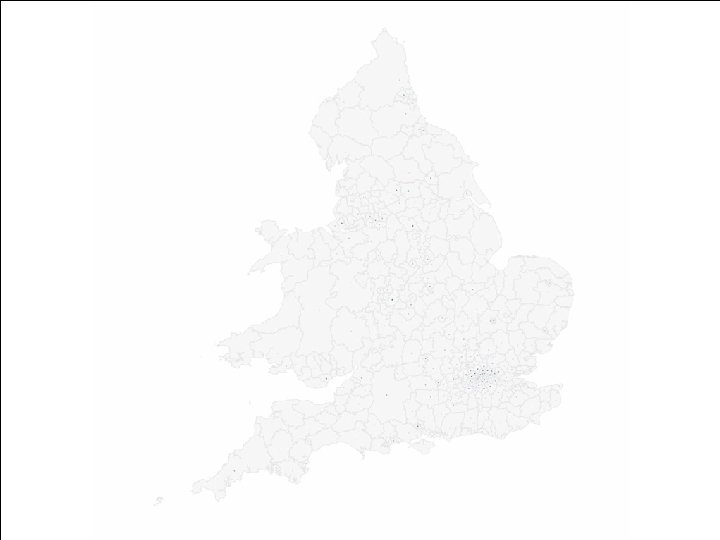
Average migration distance • Research on 2001 Census data (Spatial Analysis Unit ) demonstrated that, on average, people move less than 10 km • People who move but do not cross a LAD boundary are not recorded in migration statistics • Moves of average distance are most likely to go unrecorded in large areas as migrants need to move further to cross a border. • Moves of average distance are more likely to be recorded when they begin in small LADs, because here, they need move a shorter distance to cross a border.

The majority of the population of England Wales is located in a band between Liverpool, Leeds and London (3 L). Most of the LADs within this band are small. Average distance from one LAD to any other LAD is much shorter within the 3 L band than outside it. Moves within the 3 L band are more likely to be picked up than those beyond it. This produces a spatial bias in the dataset.

Cornwall 2008 © Crown copyright and database rights 2016 Ordnance Survey 100019153

Cornwall 2008 St Ives Falmouth 26 miles © Crown copyright and database rights 2016 Ordnance Survey 100019153

Cornwall 2008 Padstow 39 miles Falmouth © Crown copyright and database rights 2016 Ordnance Survey 100019153

Cornwall 2008 Padstow Torpoint 44 miles © Crown copyright and database rights 2016 Ordnance Survey 100019153

Cornwall 2008 Launceston 78 miles Sennan Cove © Crown copyright and database rights 2016 Ordnance Survey 100019153
! © Crown copyright and database rights 2016")
Cornwall 2009 Modifiable Areal Unit Problem (MAUP)! © Crown copyright and database rights 2016 Ordnance Survey 100019153

Average distance migrated Central areas closer to all other areas than areas on the periphery simple geometry. In 3 L on average, smaller Moves beginning in smaller areas are more likely to be registered. In combination, the measure not so much illuminating as an artefact of the inputs.

Correlations between Migration and Area Classifications London Cosmopolitan, Business and Education Rural, Mining & Manufacturing, Coastal, Heritage
 + Suitable for rate data - Dominated")
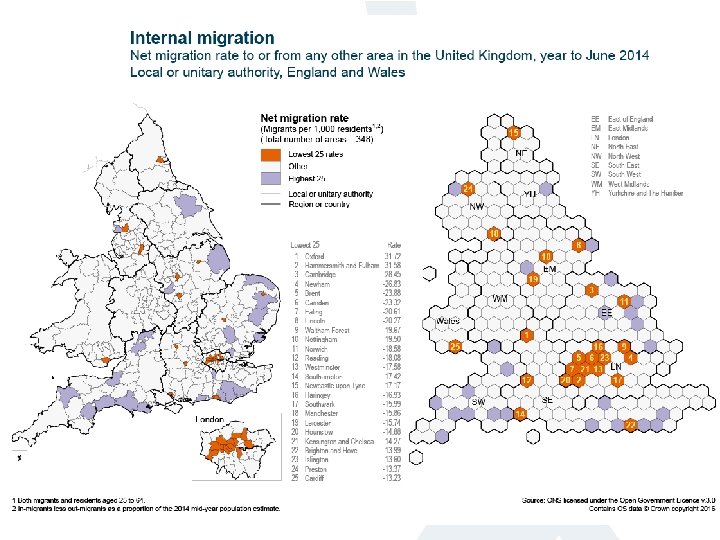
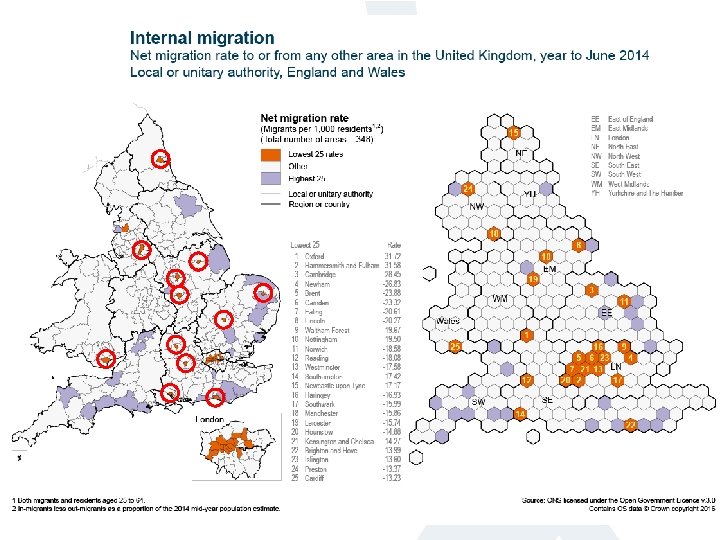
Selected mapping solutions • Choropleth (density shading) + Suitable for rate data - Dominated by large areas • Hex (each area represented by an equally-sized hexagon) + Small areas are easily seen - Hard to navigate

Adding value through non-standard graphical approaches using R • Flow mapping using R (http: //spatial. ly/) James Cheshire • Visualising Migration Flow Data with Circular Plots Nikola Sander, Guy J. Abel, Ramon Bauer and Johannes Schmidt. • Band or Sankey diagrams Originated with Charles Minard

Collaborations with Big. Data team: 1: Net Internal migration flows, plotted in R

3: Chord diagram - total internal migration flows by region

4: Sankey diagram - total internal migrations by region, England Wales, 2014

Contrasts with short-term migration

A degree of success • • Collaboration across ONS Spatial variations in labour mobility identified Correlations with ONS Area Classifications Rapid turnaround of innovative graphics “a great example of agile curiosity in action from all sides” “a very nice case study for how being curious can bring big dividends”

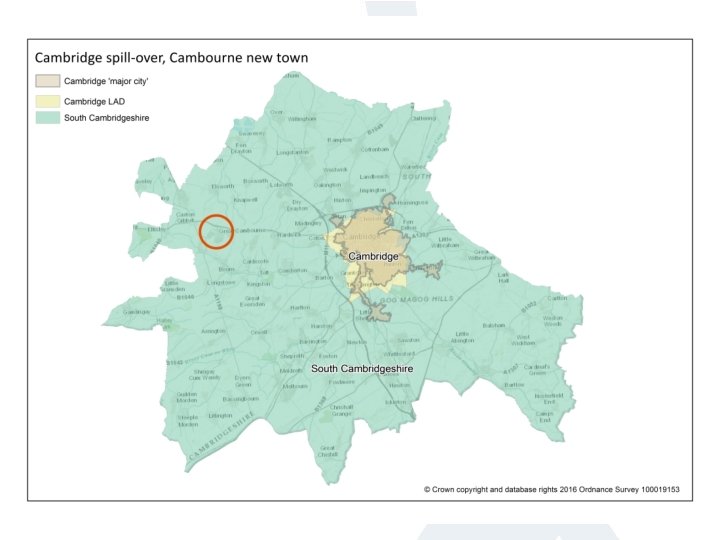
Some aspects of the brief unrealisable with current data • Districts are not towns • Migration ‘catchment areas’ meaningless at LAD level.

Some aspects of the brief unrealisable with current data • Districts are not towns. See ONS’ new ’Major Towns and Cities’ dataset. • Migration ‘catchment areas’ meaningless at LAD level.

MSOA - a solution to the catchment area problem? • Possible solutions: • Record-level extract from Census 2011 – but more out of date with every passing year. . • Disaggregation of current data to a lower geography? • Census statistical geography designed with spatial analysis in mind.

MSOA - a solution to the catchment area problem? • Possible solutions: • Record-level extract from Census 2011 – but more out of date with every passing year. . • Disaggregation of current data to a lower geography? • Census statistical geography designed with spatial analysis in mind.

MSOA - a solution to the catchment area problem? • Redistribute future internal migration data down to MSOA? • Accuracy and currency of underlying admin data? e. g. NHSPR: • Persistent lag • NHS Trusts are not equally efficient • Variable by age and sex

Summary • Understand your geography! • Opportunity to • • Train up new team Collaborate across ONS Adopt innovative approaches Acquire new capabilities

Thank you • Any questions? Contact ONS Geography at: Access Open Geography products at: Follow ONS Geography at @ONSgeography ons. geography@ons. gov. uk https: //geoportal. statistics. gov. uk/geoportal
- Slides: 38