Map Types Globe vs Map Depending on the

Map Types

Globe vs. Map • Depending on the information you are attempting to gain insight on you would need to decide on which picture representation you would want to refer to. 1. Globe – A model representation of Earth’s entire surface. • • Country coordinates Time zones 2. Map – A picture or model of a place or location. • • Driving Directions Points of Interest Grid Topographic maps

Globe or Map – Which would be best? • If I wanted to locate the nearest gas station in Ovid: Map • If I wanted to see where Hawaii is in relation to New York: Globe • If I wanted to find Sochi, Russia and see how many hours ahead of us they are for the Olympics? Globe • If I wanted to see what route would be best to drive from Ovid to Washington D. C. : Map

Globe • A picture of Earth’s entire surface. • Reference features used: 1. Lines of Longitude – run vertically • • Starts at the Prime Meridian - 0° Spaced every 15° - 24 total meridian lines – – Left of the Prime Meridian = West (0 -180) Right of the Prime Meridian – East (0 -180) 2. Lines of Latitude – run horizontally • Starts at the Equator - 0° – – Above the equator = North (0 -90) Below the equator = South (0 -90)

West East Greenland North America Europe Africa South America South Prime Meridian Equator X Asia Australia Antarctica

Using A Globe 1. Australia is located in which two hemispheres? Southern & Eastern Hemisphere 2. Is Greenland East or West of the Prime Meridian? West 3. Which continent is located at: 30°S and 60°W South America 4. What would be the coordinates for X in Asia? 30°N and 150°E

Time Zones • Lines of Longitude are spaced every 15°. – There are 24 meridian lines. • 15 X 24 = 360°. – So each meridian line = 1 hr of time. – Move West from the Prime Meridian = fall back 15° or, gain an hour of time. • 2 pm will become 1 pm if you move 1 meridian line to the left. – Move East from the Prime Meridian = move forward 15°, lose an hour of time. • 2 pm will become 3 pm if you move 1 meridian line to the right.

World Time Zones Fall Back = Gain Jump Forward = Lose X – Sochi, Russia Prime Meridian

World Time Zones 1. From the Prime Meridian, New York would gain or lose time? Gain – How many hours? 5 hours 2. Sochi, Russia was ahead or behind New York in time? ahead • How many hours? 9 hours 3. How many time zones does Australia have? 3

US Time Zones

US Time Zones • How many different time zones does the Continental United States have? 4 • Which time zone is Ovid, NY in? Eastern • If we travel to California, do we fall back or move forward in time? Fall back • If it is 10 am in Ovid, what time is it in: 9 am 8 am 7 am – Texas: – Wyoming: – Nevada:

Maps • Maps are picture or model representations of a location or place. • Map Types: – Driving Directions – Points of Interest – Grids – Topographic Maps

Reference Features Parking • Maps use reference features to help you understand the information being pictured: 1. Legend: Tells you what certain symbols may mean or represent. Post Office Marina School Information Lodging Picnic Area Handicap Friendly Restroom Hospital Telephone Airport Food First aid

Reference Features 2. Compass: Tells you the direction locations are in relation to each other. 3. Scale: Tells you how far a location is on the map in regards to the real distance on Earth.
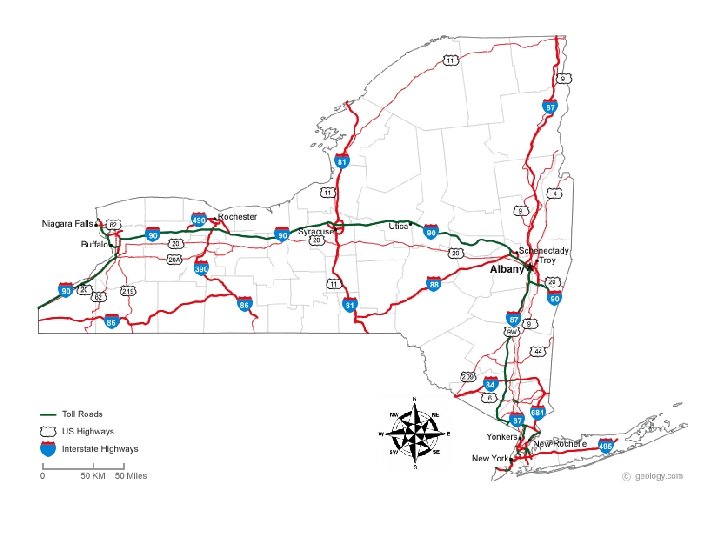

Reading Maps • What does the symbol mean? Interstate • From Buffalo to Albany, what would be the fastest road to travel on? 90 – Would it be free? No, toll road • Is there another road you could take that would be free? Yes, 20 US Highway • What direction does 81 run? NS – What type of road would this be?

Grids • Grids are similar to maps in that they are picture or model representations of a location or place. • They are different however in that they DO NOT use longitude/latitude coordinates but instead use letters and numbers. – Letters take the place of latitude. • Run East to West, horizontally – Numbers take the place of longitude. • Run North to South, vertically

Grids

Reading Grids 1. What will you find in each of the following: – A-1: Office - C-3: Kindergarten – A-2: Front door - C-1: Grade 3 2. Where would you find each of the following places? – Nurse’s Office: B-1 - Grade 2 Classroom: – Lunch Room: A-3 - Hallway: B-3 B-2, C-2

Topographic Maps • Topographic Maps show the birds-eye view of an area. – Show highly accurate information on: • • Elevation Gradient Topographic Profile Topography

Topographic Map Features 1. Contour lines connect similar elevations. – Can never cross or cut through another contour line. • Just like Isotherm, temperature, and Isobar, pressure, maps.

Drawing Contour Lines • Use the diagram below to create a topographic map with contour lines in 10 m intervals. (80 m, 90 m, 100 m, 110 m and 120 m)

Drawing Contour Lines • Use the diagram below to create a topographic map with contour lines in 50 m intervals. (400 m, 450 m and 500 m)
 is the difference in elevation (rise) divided by")
Topographic Map Features 2. Gradient (slope) is the difference in elevation (rise) divided by the distance between two points (run): Gradient = rise / run = 145 -125/5 = 20/5 = 4 m/Km

Topographic Profile • A profile takes the eagle-eye view of an area and translates it into cross-section view. – Identify two points on opposite sides of the map that you would like to profile. – Mark each contour interval that intersects the line, identify the elevation. – Plot the distance that each contour line is separated by onto the graph and the elevation that each line was found at. – Connect points to draw the profile.

Constructing A Profile • Complete the Topographic Profile below: B A • • •

Topographic Map Symbols • Symbols are often used to identify features on a topographic map:

Topography 1. Contour lines determine topography: – Depression – • has hachures - Hill – * no hachures

Reading Topographic Maps 1. What is the contour interval of this map? Cr ee ho r te r What does the symbol at C indicate? c. W A 2. k 20 m 3. What does the symbol at B indicate? 5. 6. 900 Swamp 4. 880 M Depression What is the elevation at A? C B 900 Below 840 m What is the elevation at C? 880 and lower Which creek has the: a. Steepest slope, how do you know? b. Mazzola – lines close together Most gradual slope? Kesler – lines farthest apart ek a M zz ola e Cr D Ke sle r. C re ek E
- Slides: 29