
MAP 4 C UNIT 3 MATHEMATICAL MODELS One


- Slides: 6
MAP 4 C UNIT 3: MATHEMATICAL MODELS
One Variable Data �A variable is an attribute that can be measured. �One-variable data sets give measures of one attribute. �One-variable data can be analyzed using mean, median and mode. �You can recognize this when you see: a) Tally charts b) Frequency Tables c) Bar Graphs d) Histograms e) Pictographs f) Circle graphs
Two Variable Data �Two-variable data sets give measures of two attributes for each item in a sample. �You can recognize 2 -variable data when you see: a) Ordered pairs b) Scatter plots c) Two column tables of values
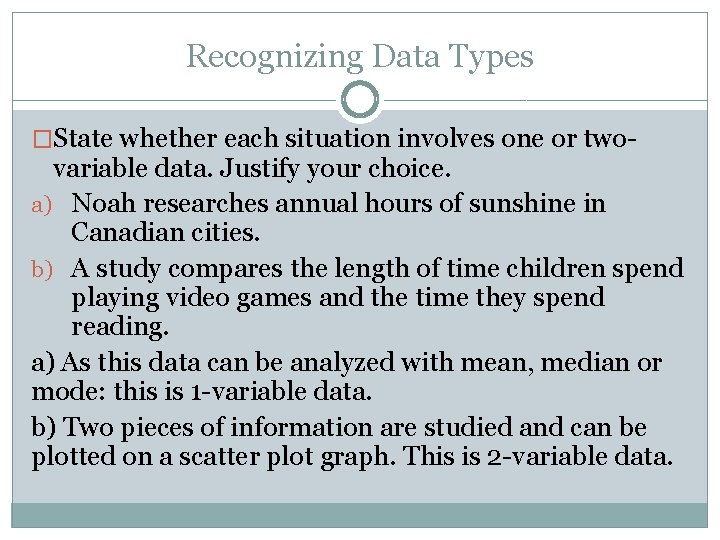
Recognizing Data Types �State whether each situation involves one or two- variable data. Justify your choice. a) Noah researches annual hours of sunshine in Canadian cities. b) A study compares the length of time children spend playing video games and the time they spend reading. a) As this data can be analyzed with mean, median or mode: this is 1 -variable data. b) Two pieces of information are studied and can be plotted on a scatter plot graph. This is 2 -variable data.
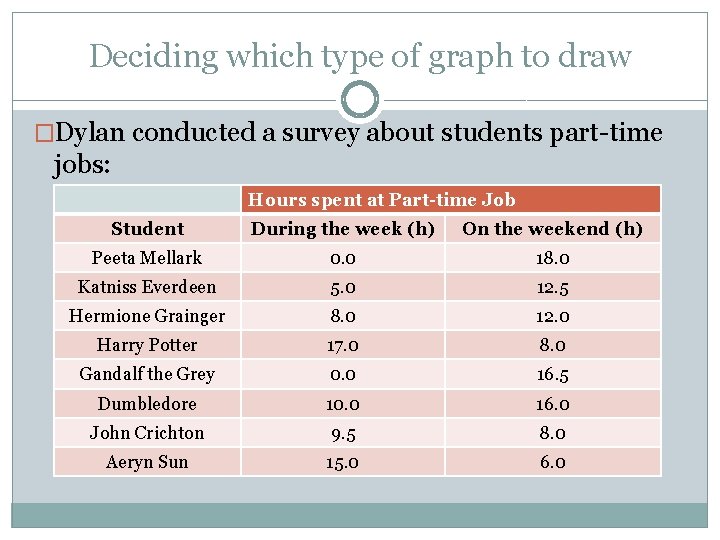
Deciding which type of graph to draw �Dylan conducted a survey about students part-time jobs: Hours spent at Part-time Job Student During the week (h) On the weekend (h) Peeta Mellark 0. 0 18. 0 Katniss Everdeen 5. 0 12. 5 Hermione Grainger 8. 0 12. 0 Harry Potter 17. 0 8. 0 Gandalf the Grey 0. 0 16. 5 Dumbledore 10. 0 16. 0 John Crichton 9. 5 8. 0 Aeryn Sun 15. 0 6. 0
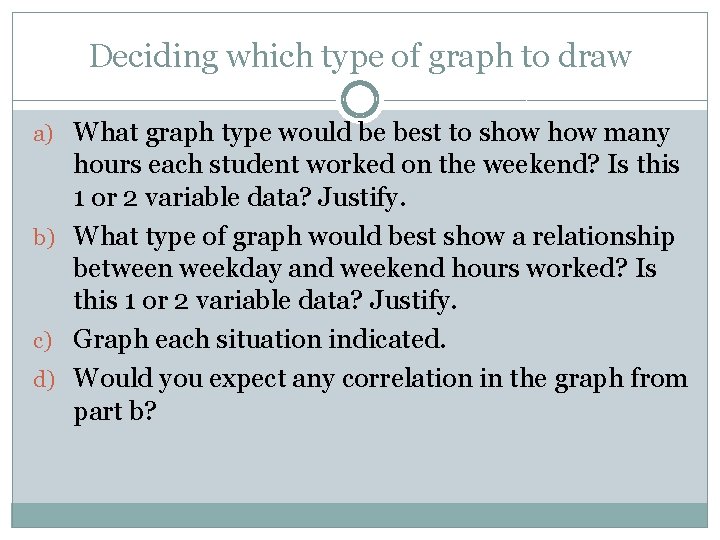
Deciding which type of graph to draw a) What graph type would be best to show many hours each student worked on the weekend? Is this 1 or 2 variable data? Justify. b) What type of graph would best show a relationship between weekday and weekend hours worked? Is this 1 or 2 variable data? Justify. c) Graph each situation indicated. d) Would you expect any correlation in the graph from part b?