MAP 21 Performance Measures for Pavements and Bridges

MAP 21 Performance Measures for Pavements and Bridges JON WILCOXSON DIVISION OF MAINTENANCE
 Federal Surface Transportation Funding")
Moving Ahead for Progress in the 21 st Century (MAP-21) Federal Surface Transportation Funding Bill Signed into Law July 2012 Establishes a Performance-Based Program for Highways

Performance Based Program Focus on National Transportation Goals Increase Accountability and Transparency Improve Investment Decisionmaking

Focus Areas for Performance Safety Infrastructure Condition Congestion Reduction System Reliability Freight Movement and Economic Vitality Environmental Sustainability Reduced Project Delivery Delays

Focus Areas for Performance Safety Infrastructure Condition Congestion Reduction System Reliability Freight Movement and Economic Vitality Environmental Sustainability Reduced Project Delivery Delays

Infrastructure Pavement Bridges Guardrail Signs Signals Striping Pipes Etc.

Infrastructure Pavement Bridges Guardrail Signs Signals Striping Pipes Etc.
 for Pavement and Bridge Conditions Published January 5, 2015")
Notice of Proposed Rulemaking (NPRM) for Pavement and Bridge Conditions Published January 5, 2015 Establishes Required Performance Measures and Targets for National Highway System Comment Period through May 8, 2015

Pavement Condition Measures INTERSTATES NON-INTERSTATE NHS % of “Good” Pavements % of “Poor” Pavements
 Cracking Rutting (Asphalt) Faulting (Concrete)")
Required Metrics Smoothness (IRI) Cracking Rutting (Asphalt) Faulting (Concrete)
 <95 95 -170")
How are “Good” and “Poor” Defined? Good Fair Poor IRI (inches/mile) <95 95 -170 >170 Cracking (%) <5% 5% - 10% >10% Rutting (inches) <0. 20 – 0. 40 >0. 40 Faulting (inches) <0. 05 – 0. 15 >0. 15

Determining Pavement Condition Metric Rating Results All three metrics rated “Good” More than 2 metrics rated “Poor” All other combinations Overall Section Rating Good Poor Fair

Required Threshold and Penalties No more than 5% of Interstate Pavements allowed in Poor Condition If target is not attained for two consecutive years, state must obligate funds to improve the measure.

Bridge Condition Measures National Highway System % of Bridges in “Good” Condition % of Bridges in “Poor” Condition % By Deck Area
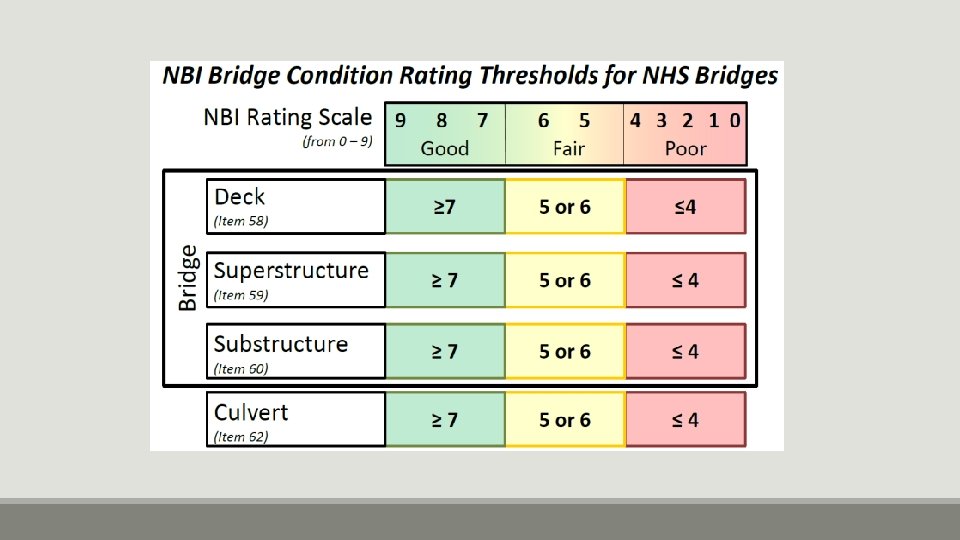

Determining Bridge Condition Metric Rating Results Overall Section Rating All three metrics rated “Good” Good ANY Metric Rated“Poor” Poor All other combinations Fair

Required Threshold and Penalties No more than 10% of NHS Bridge Deck Area allowed in Poor Condition If target is not attained for three consecutive years, state must obligate funds to improve the measure.

Potential Concerns Extremely High Threshold for Poor Pavements on Interstate
 <95 95 -170 >170 Cracking (%) <5% 5% -")
Good Fair Poor IRI (inches/mile) <95 95 -170 >170 Cracking (%) <5% 5% - 10% >10% Rutting (inches) <0. 20 – 0. 40 >0. 40 Faulting (inches) <0. 05 – 0. 15 >0. 15

Potential Concerns Extremely High Threshold for Poor Pavements on Interstate Missing Data is Considered Poor by Default

Potential Concerns Extremely High Threshold for Poor Pavements on Interstate Missing Pavement Data is Considered Poor by Default Forces Bridge Program to Focus on NHS Deck Area emphasis may hurt rural areas Replacement vs. Preservation
")
Possible KYTC-Specific Measures Pavements Bridges % Poor Pavements (by KYTC Definition, NHS and non-NHS) # of Substandard Bridges on State Routes % Good Pavements (by KYTC Definition, NHS and non-NHS) # of Structurally Deficient Bridges (entire system) Average Remaining Service Life (NHS and non-NHS) % Structurally Deficient Deck Area (entire system)

Questions/Comments Comment period open until May 8, 2015
- Slides: 23