Many Departments One Child Clyde Hertzman Human Early


 29% University Eligible Grades 41.")
 Reduced early vulnerability increases")


- Slides: 29
Many Departments, One Child Clyde Hertzman Human Early Learning Partnership University of British Columbia, Vancouver
Sensitive Periods in Early Brain Development Pre-school years High School years Numbers Peer social skills Language Symbol Habitual ways of responding Emotional control Vision Hearing Low 0 1 2 3 4 Years 5 6 Graph developed by Council for Early Child Development (ref: Nash, 1997; Early Years Study, 1999; Shonkoff, 2000. ) 7
Life Course Problems Related to Early Life 2 nd Decade • School Failure 3 rd/4 th Decade • Obesity 5 th/6 th Decade Old Age • Coronary Heart • Premature Disease Aging • Teen Pregnancy • Elevated Blood Pressure • Diabetes • Criminality • Depression • Memory Loss
What drives ECD? The experiences children have in the environments where they grow up, live and learn.
Monitoring the state of development at the level of the population and how it changes over time
Early Development Instrument 104 items
Early Development Instrument Teacher at age 5 is respondent
Early Development Instrument 5 developmental domains, with 16 subdomains
What Does the EDI Measure?
Early Development Instrument Extensive Validity and Reliability data from several countries
Early Development Instrument Not an ‘individual assessment’
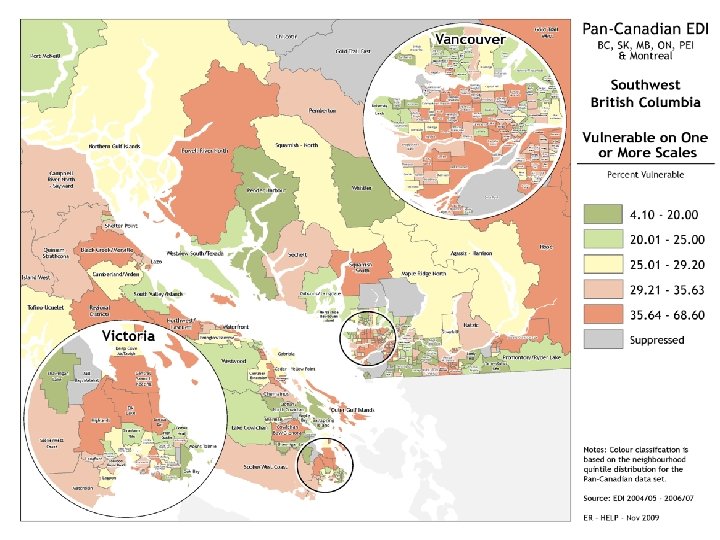
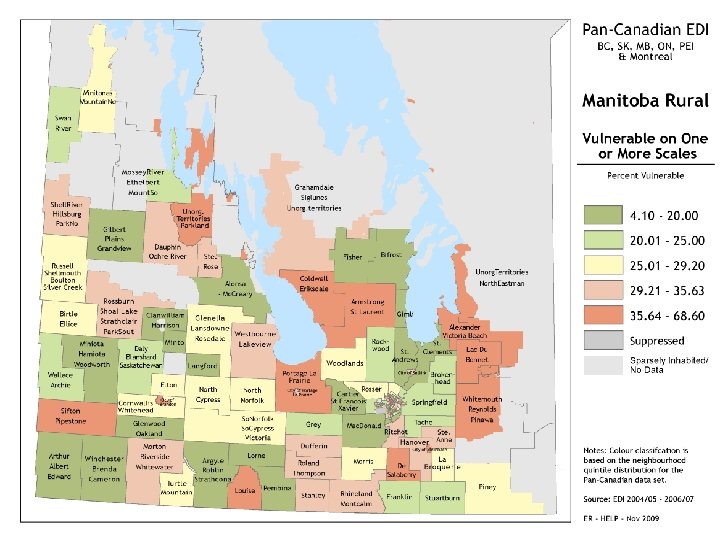
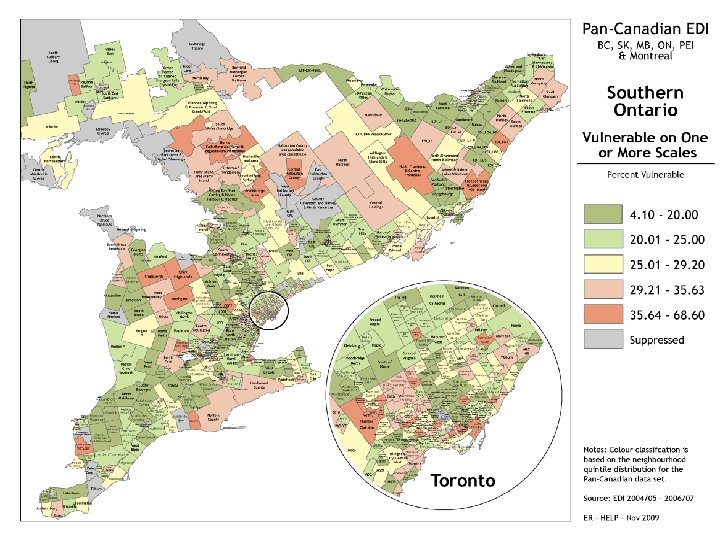
What the maps reveal… Large local area differences in the proportion of developmentally vulnerable children
What the maps reveal… The high proportion of avoidable vulnerability
What the maps reveal… why we need ‘proportionate universality’ in service provision
Proportionate Universality
What does it take to Reduce Vulnerability? High vulnerability EDI Low vulnerability Disadvantaged SES Advantaged
On average, disadvantaged children have poorer outcomes, However, most vulnerable children are in the middle class Socioeconomic Disadvantage Socioeconomic Advantage
Barriers of Access to Quality Programs 1. Program or service not there 2. Costs too much 3. Transportation 4. Time 0 ffered 5. Language 6. Fragmentation 7. Lack of info 8. Conflicting Expectations 9. Social distance 10. Parental consciousness
Proportionate Universality Universal access at a scale and intensity that addresses barriers at every level High vulnerability Barriers to access EDI Gradient flattened at both ends of the SES spectrum, but proportionate to level of risk 10 -15% Low vulnerability Disadvantaged SES Advantaged
Our evidence shows: Children who are vulnerable in kindergarten are less likely to be job ready
Linkage of EDI to Success in Grade 4 Percent not meeting expectations 90. 0 80. 0 70. 0 Reading Numera cy 60. 0 50. 0 40. 0 30. 0 20. 0 10. 0 Zero One Two Three Four Number of EDI vulnerabilities Five
Observe Transitions from EDI to School Completion Vulnerability (EDI) 29% University Eligible Grades 41. 5% 15% 50. 3% 10% 55. 6% 34% increase Source: Adapted from Kershaw et al. 2009, 15 by 15 : A Comprehensive Policy Framework for Early Human Capital Investment in BC, Table 1. .
Decreased Vulnerability = Increased Growth 1000 800 BC GDP ($Billions) Reduced early vulnerability increases GDP by Reduced vulnerability (10%) 20% That’s throwing away $2. 2 -$3. 4 trillion now + interest over 60 years! 600 Status Quo (29% vulnerable) 400 Baseline growth plus 0. 63% GDP per year First cohort graduates 200 First cohort of 5 year olds benefit from smart family policy We are here 0 0 10 20 Years 30 40 50
Smart Family Policy 0 to 18 months Time: improve parental leave Services: monthly access to health check-ins and parenting support 0 -18 months to six years Time: re-think ‘full-time’ work Services: early learning and care 18 months to school entry 0 to six years Low-income: make work pay Low-income: eliminate family poverty
Thank You www. earlylearning. ubc. ca Our Funders: