
Manhattan East Side Access Project Second Avenue Subway
Manhattan East Side Access Project Second Avenue Subway PEA Team: Jay Horwitz Bryan Mullins Muyiwa Teriba May 3, 2004
Overview of Presentation I. III. IV. V. Introduction Funding and Finance Costs Benefits Synthesis 2

INTRODUCTION 3
What is SAS? • 8. 5 mile subway project from 125 th Street to the financial district in Lower Manhattan • Will include 16 new stations along path under Second Avenue • Purpose to provide faster travel for current transit riders and relieve severe overcrowding conditions on Lexington Avenue line • Construction time estimated to start in 2004 and last 17 years 4
On the Table for Nearly a Century • Population density of East Side increased dramatically at turn of century • Proposals to build north-south subway line along Second Avenue date back to 1929 • During 1960 s a two-track subway line from the Bronx to Lower Manhattan resulted in construction of several tunnel segments • However, construction suspended in 1970 s due to City’s financial crisis 5
Transportation Problems have Renewed Interest in SAS Proposal • Lexington Avenue express service (4/5/6) operates with passenger loads that exceed New York City Transit guidelines • Overcrowding expected to increase • Access (1/4 to 1/2 mile) to subway service is lacking on far East Side of Manhattan • Overcrowding lengthens trip times and causes service delays • Majority of rush hour buses are crowded and travel speeds are slow due to traffic congestion • Severe traffic congestion on local streets and FDR Drive contribute to New York City’s inability to meet National Ambient Air Quality Standards 6
SAS Wins Favor Among Officials, Community Groups, General Public • No-Build Alternative: Examined future impacts of inaction • Transportation System Management (TSM) Alternative: Bus service improvements • Build Alternative 1: New subway line under Second Avenue from 125 th Street to 63 rd Street with connection to Lower Manhattan via Broadway subway line • Build Alternative 2: 125 th Street to 63 rd Street subway line with addition of light rail transit line linking Lower East Side to Union Square and Lower Manhattan • Build Alternative 3: Full-length Second Avenue Subway from 125 th Street to financial district in Lower Manhattan 7
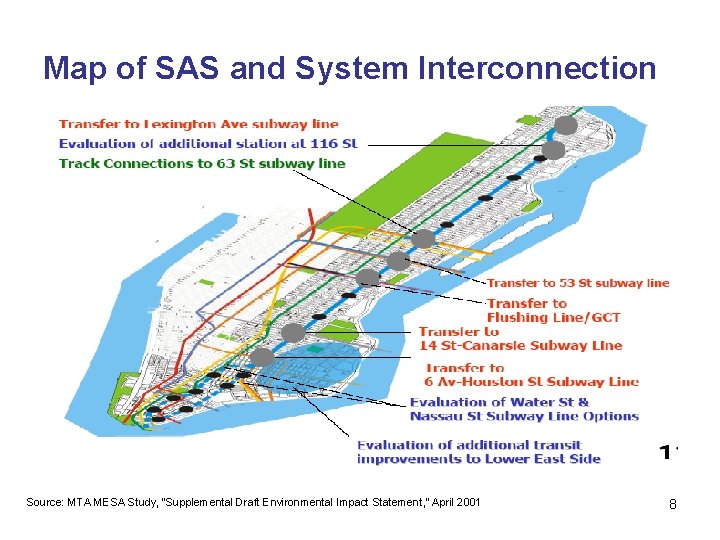
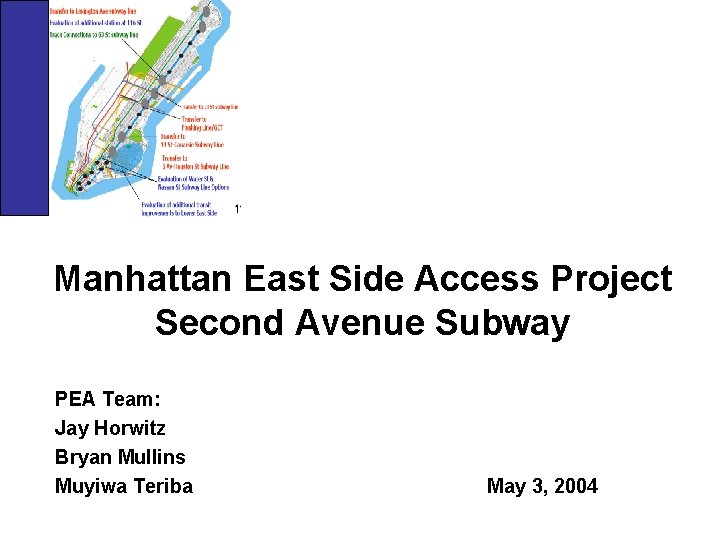
Map of SAS and System Interconnection Source: MTA MESA Study, “Supplemental Draft Environmental Impact Statement, ” April 2001 8
FUNDING 9
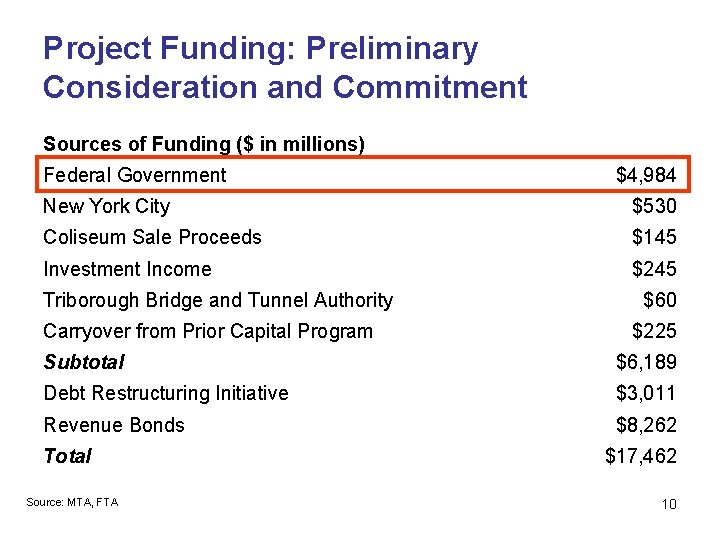
Project Funding: Preliminary Consideration and Commitment Sources of Funding ($ in millions) Federal Government $4, 984 New York City $530 Coliseum Sale Proceeds $145 Investment Income $245 Triborough Bridge and Tunnel Authority Carryover from Prior Capital Program $60 $225 Subtotal $6, 189 Debt Restructuring Initiative $3, 011 Revenue Bonds $8, 262 Total Source: MTA, FTA $17, 462 10
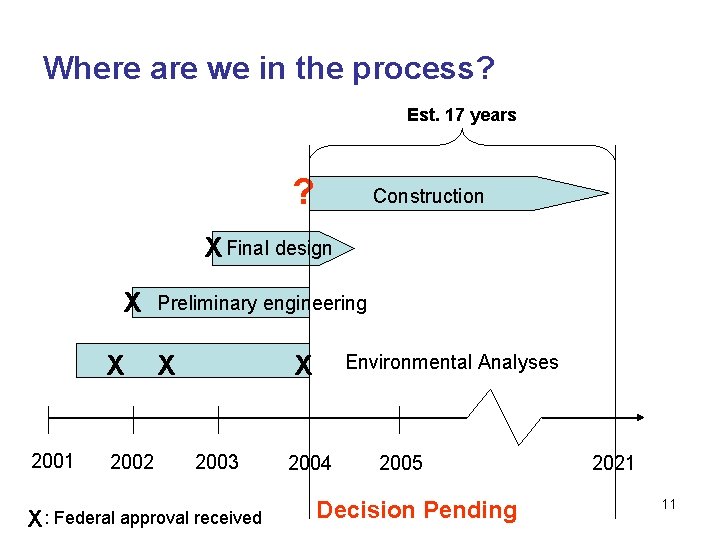
Where are we in the process? Est. 17 years ? Construction X Final design X X 2001 2002 Preliminary engineering X X 2003 X : Federal approval received Environmental Analyses 2004 2005 Decision Pending 2021 11
COSTS 12
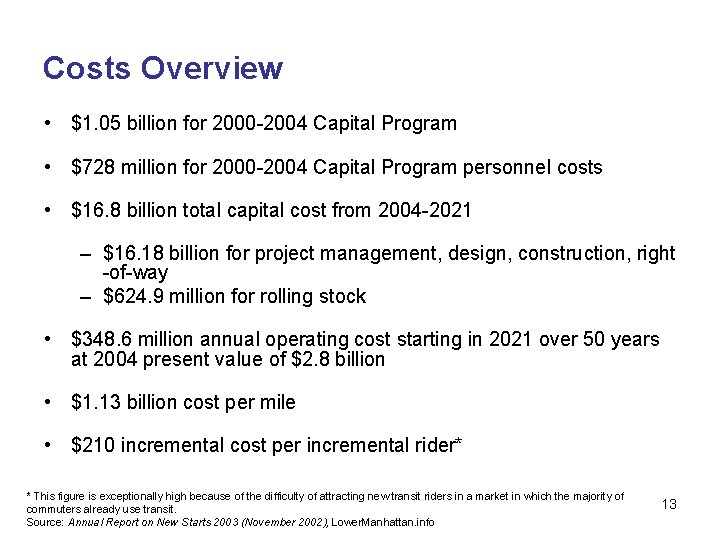
Costs Overview • $1. 05 billion for 2000 -2004 Capital Program • $728 million for 2000 -2004 Capital Program personnel costs • $16. 8 billion total capital cost from 2004 -2021 – $16. 18 billion for project management, design, construction, right -of-way – $624. 9 million for rolling stock • $348. 6 million annual operating cost starting in 2021 over 50 years at 2004 present value of $2. 8 billion • $1. 13 billion cost per mile • $210 incremental cost per incremental rider* * This figure is exceptionally high because of the difficulty of attracting new transit riders in a market in which the majority of commuters already use transit. Source: Annual Report on New Starts 2003 (November 2002), Lower. Manhattan. info 13
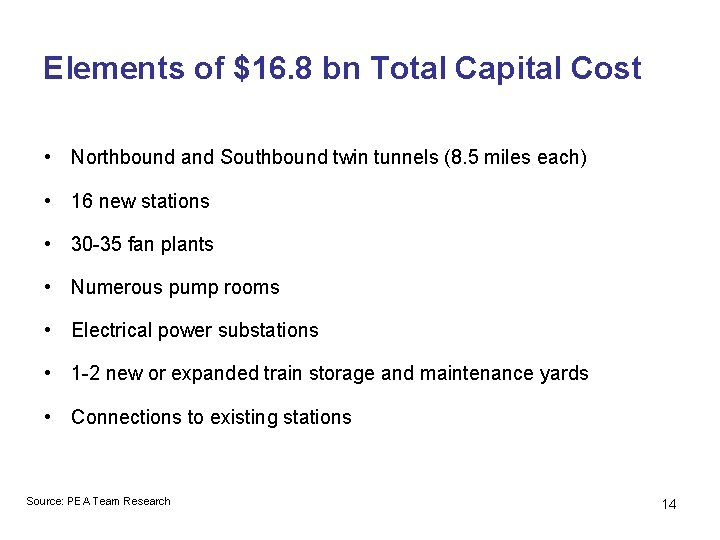
Elements of $16. 8 bn Total Capital Cost • Northbound and Southbound twin tunnels (8. 5 miles each) • 16 new stations • 30 -35 fan plants • Numerous pump rooms • Electrical power substations • 1 -2 new or expanded train storage and maintenance yards • Connections to existing stations Source: PEA Team Research 14
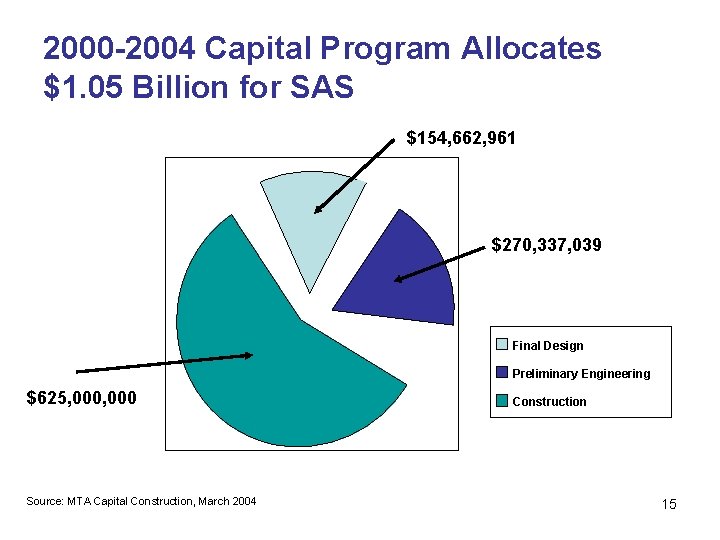
2000 -2004 Capital Program Allocates $1. 05 Billion for SAS $154, 662, 961 $270, 337, 039 Final Design Preliminary Engineering $625, 000 Source: MTA Capital Construction, March 2004 Construction 15
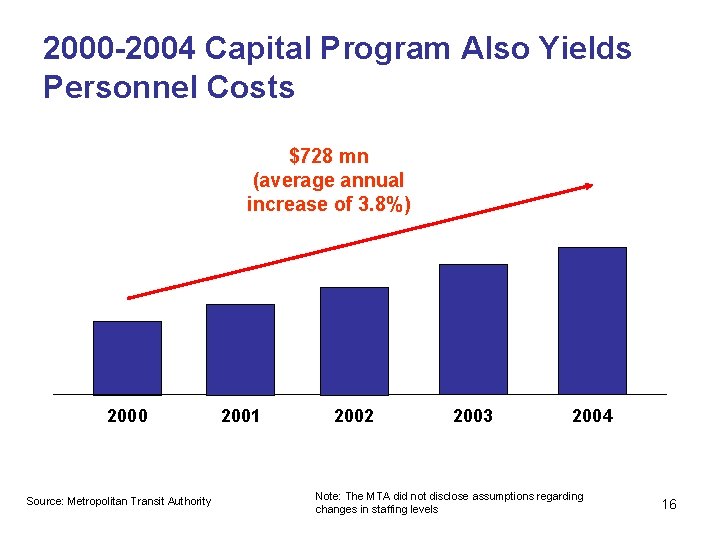
2000 -2004 Capital Program Also Yields Personnel Costs $728 mn (average annual increase of 3. 8%) 2000 Source: Metropolitan Transit Authority 2001 2002 2003 2004 Note: The MTA did not disclose assumptions regarding changes in staffing levels 16
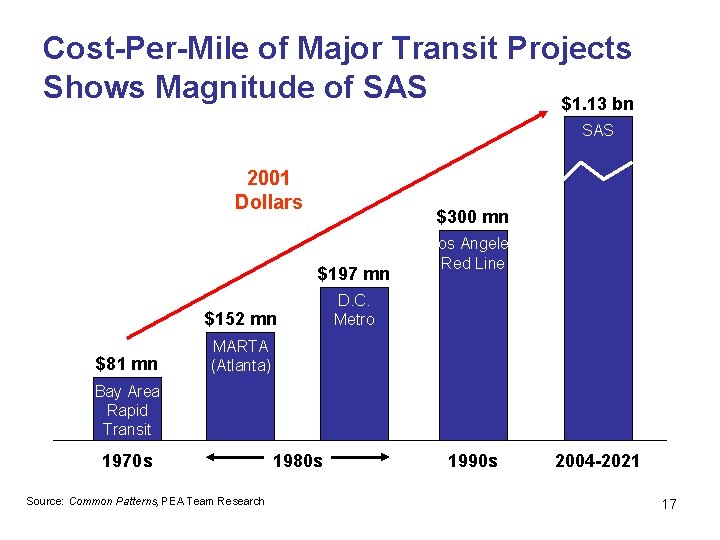
Cost-Per-Mile of Major Transit Projects Shows Magnitude of SAS $1. 13 bn SAS 2001 Dollars $300 mn $197 mn $152 mn $81 mn Los Angeles Red Line D. C. Metro MARTA (Atlanta) Bay Area Rapid Transit 1970 s Source: Common Patterns, PEA Team Research 1980 s 1990 s 2004 -2021 17
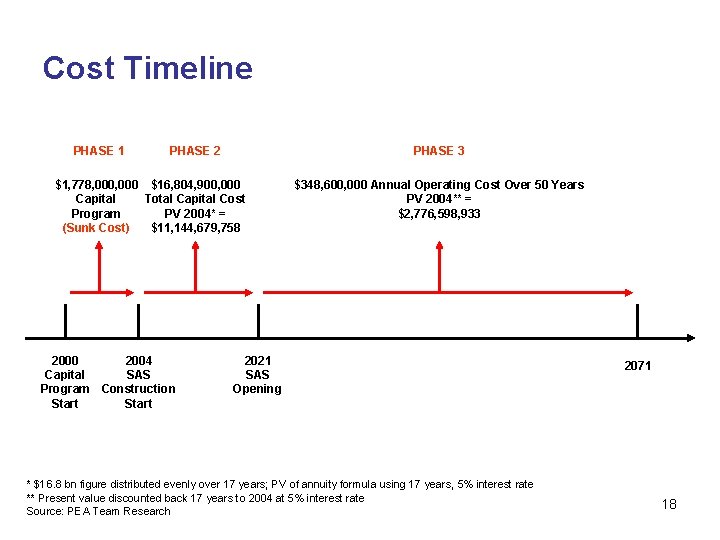
Cost Timeline PHASE 1 PHASE 2 PHASE 3 $1, 778, 000 $16, 804, 900, 000 Capital Total Capital Cost Program PV 2004* = (Sunk Cost) $11, 144, 679, 758 2000 2004 Capital SAS Program Construction Start $348, 600, 000 Annual Operating Cost Over 50 Years PV 2004** = $2, 776, 598, 933 2021 SAS Opening * $16. 8 bn figure distributed evenly over 17 years; PV of annuity formula using 17 years, 5% interest rate ** Present value discounted back 17 years to 2004 at 5% interest rate Source: PEA Team Research 2071 18
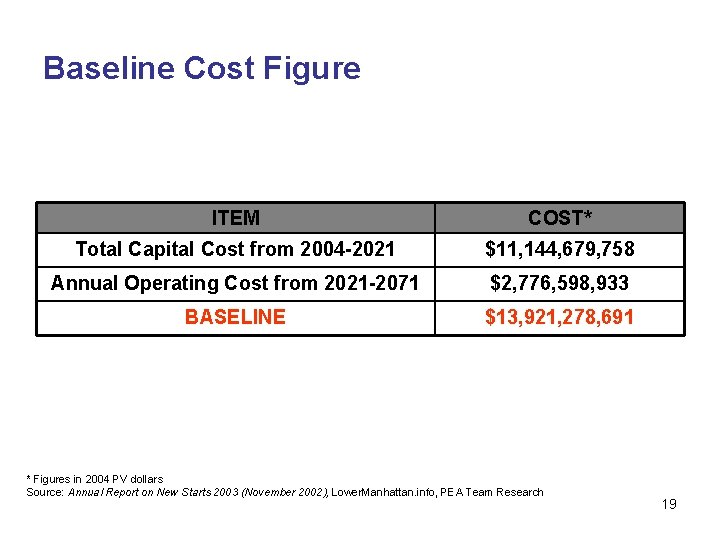
Baseline Cost Figure ITEM COST* Total Capital Cost from 2004 -2021 $11, 144, 679, 758 Annual Operating Cost from 2021 -2071 $2, 776, 598, 933 BASELINE $13, 921, 278, 691 * Figures in 2004 PV dollars Source: Annual Report on New Starts 2003 (November 2002), Lower. Manhattan. info, PEA Team Research 19

BENEFITS 20
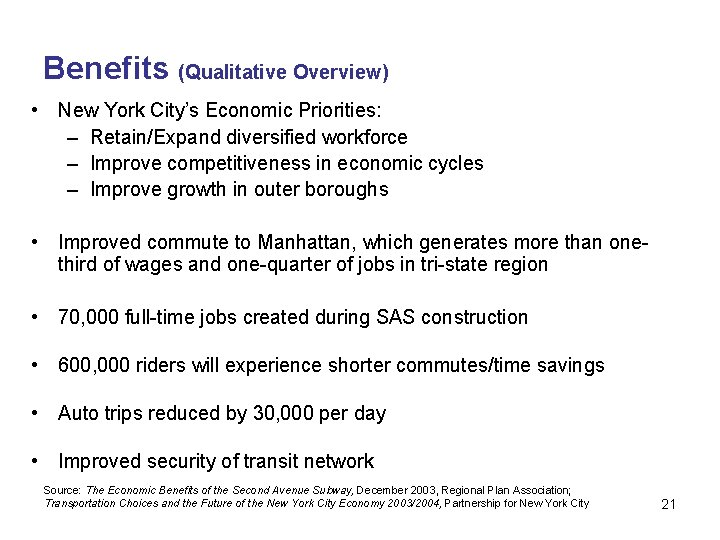
Benefits (Qualitative Overview) • New York City’s Economic Priorities: – Retain/Expand diversified workforce – Improve competitiveness in economic cycles – Improve growth in outer boroughs • Improved commute to Manhattan, which generates more than onethird of wages and one-quarter of jobs in tri-state region • 70, 000 full-time jobs created during SAS construction • 600, 000 riders will experience shorter commutes/time savings • Auto trips reduced by 30, 000 per day • Improved security of transit network Source: The Economic Benefits of the Second Avenue Subway, December 2003, Regional Plan Association; Transportation Choices and the Future of the New York City Economy 2003/2004, Partnership for New York City 21
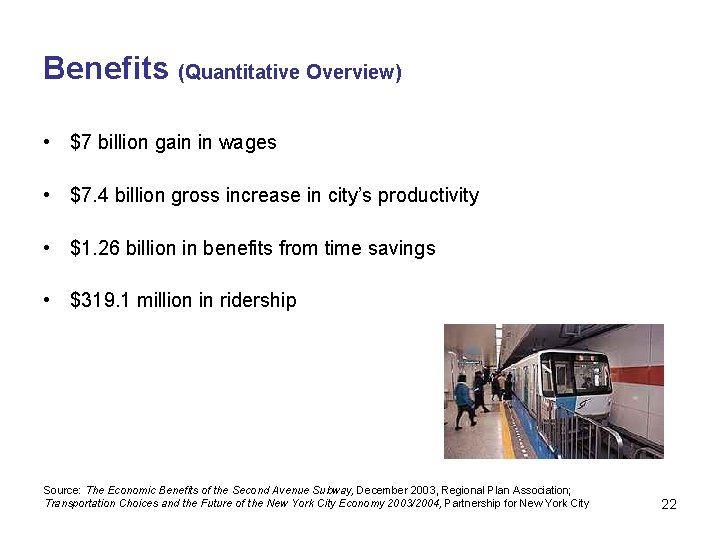
Benefits (Quantitative Overview) • $7 billion gain in wages • $7. 4 billion gross increase in city’s productivity • $1. 26 billion in benefits from time savings • $319. 1 million in ridership Source: The Economic Benefits of the Second Avenue Subway, December 2003, Regional Plan Association; Transportation Choices and the Future of the New York City Economy 2003/2004, Partnership for New York City 22
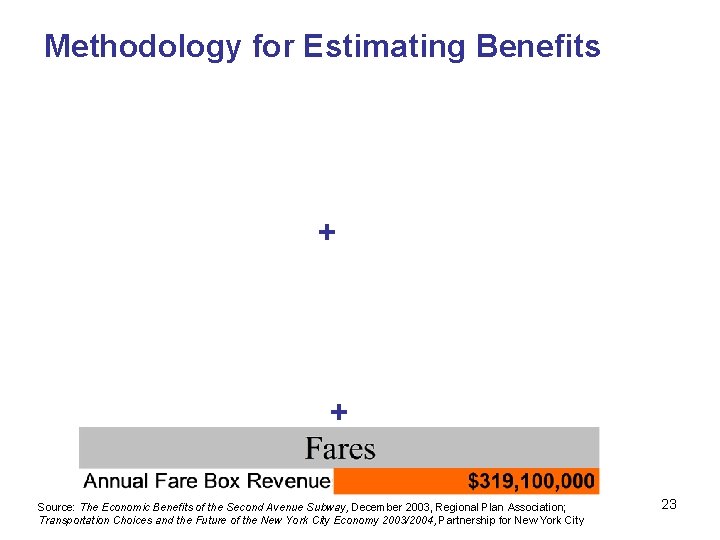
Methodology for Estimating Benefits + + Source: The Economic Benefits of the Second Avenue Subway, December 2003, Regional Plan Association; Transportation Choices and the Future of the New York City Economy 2003/2004, Partnership for New York City 23
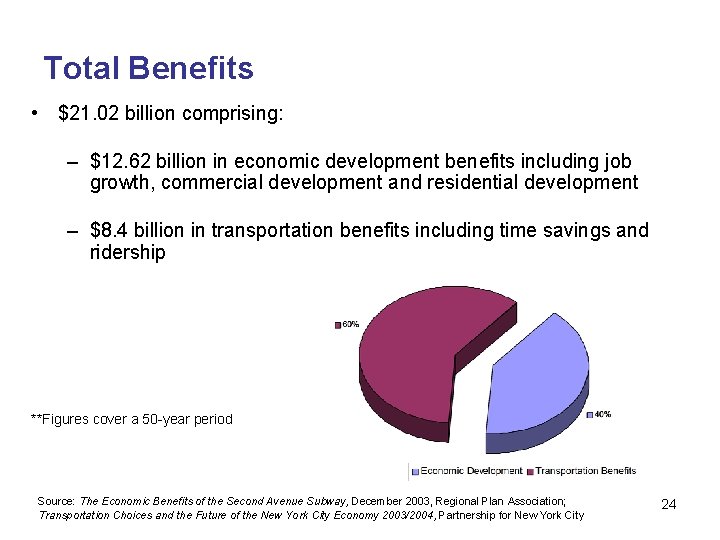
Total Benefits • $21. 02 billion comprising: – $12. 62 billion in economic development benefits including job growth, commercial development and residential development – $8. 4 billion in transportation benefits including time savings and ridership **Figures cover a 50 -year period Source: The Economic Benefits of the Second Avenue Subway, December 2003, Regional Plan Association; Transportation Choices and the Future of the New York City Economy 2003/2004, Partnership for New York City 24
Benefits Critique Jobs • 70, 000 jobs from SAS over 17 years worth $1, 000 per job – No explanation of where these jobs will come from • New jobs, or job movement/reallocation? • What kind of jobs? Value? – 22, 500 direct construction jobs estimated, majority of which will be short term in nature – No reference to jobs lost resulting from construction • No analysis of net jobs created (some jobs will be permanently lost due to subway, e. g. taxi drivers) Source: The Economic Benefits of the Second Avenue Subway, December 2003, Regional Plan Association; Transportation Choices and the Future of the New York City Economy 2003/2004, Partnership for New York City 25
Benefits Critique Time Savings • Estimated $1. 26 billion in time savings – No discussion or analysis of how much of this time savings value will be translated into dollars – No estimation of “net” time savings taking into account time wasted as a result of delays caused by construction – Time savings valued at today’s estimation to time value Source: The Economic Benefits of the Second Avenue Subway, December 2003, Regional Plan Association; Transportation Choices and the Future of the New York City Economy 2003/2004, Partnership for New York City 26
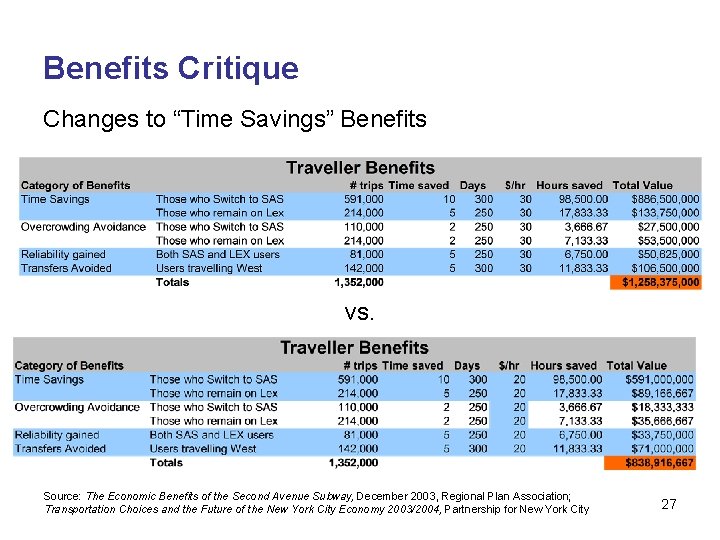
Benefits Critique Changes to “Time Savings” Benefits vs. Source: The Economic Benefits of the Second Avenue Subway, December 2003, Regional Plan Association; Transportation Choices and the Future of the New York City Economy 2003/2004, Partnership for New York City 27

SYNTHESIS 28
Context: This Project Must Inevitably Compete for Scarce Resources • Total New York City budget FY 2005: $46. 9 billion – SAS equals a non-trivial fraction • Financial pressure on City anticipated – Budget deficits expected to range from $3. 7 billion to $4. 2 billion annually from 2006 -2008 – Debt service increases from $2. 4 billion in 2004 to $4. 3 billion in 2008 • However, New York City pays $11. 4 billion more in federal taxes and $2. 6 billion more in state taxes than it receives in funding* * 1999 FY analysis 29
What should we count? • Depending on how you look at who has standing, things change: – Do federal dollars mean national standing? – Or, is it New York City’s turn at the federal transit pot? • New real estate development? – Where is the marginal benefit? • Jobs? – Construction? Business relocation? – Looks like redistribution of federal funds • Nearly $2 billion in sunk costs? – Planning, design and assessment are all expensive; these costs cannot be recouped if project is a “no go” 30
What is an appropriate discount rate? • OMB Guidelines (public investment) = 7% – “approximates marginal pre-tax rate of return on an average private investment” • U. S. Treasury bond rate (30 year) = 5. 2% • New York City municipal bond rate = 6. 5% • This is a long-lived project with high up-front costs—it matters Source: Guidelines and Discount Rates for Benefit-Cost Analysis of Federal Programs, OMB 1992, US Treasury Bond Rate for April 2004; NYC Municipal Bond rate based on Nuveen Bond Fund 31
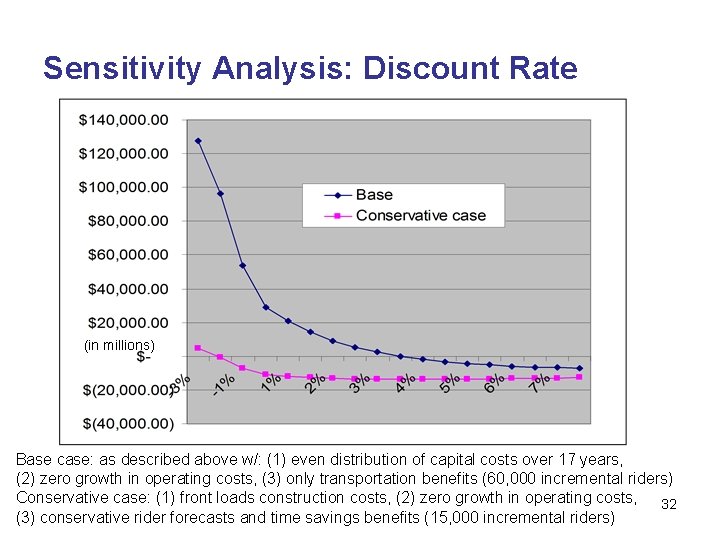
Sensitivity Analysis: Discount Rate Focus on transportation benefits: (in millions) (inmillions) Base case: as described above w/: (1) even distribution of capital costs over 17 years, (2) zero growth in operating costs, (3) only transportation benefits (60, 000 incremental riders) Conservative case: (1) front loads construction costs, (2) zero growth in operating costs, 32 (3) conservative rider forecasts and time savings benefits (15, 000 incremental riders)
Sensitivity Analysis: Putting the Core Assumptions to the Test • Ridership assumptions/forecast – Number of incremental riders (typically 150% overestimated) – Subway shift (tight travel corridors in New York City) • Development assumptions – Incremental job creation: these remain a non-factor • Capital costs – Time distribution matters – Overruns: time and cost (will focus on project creep) 33
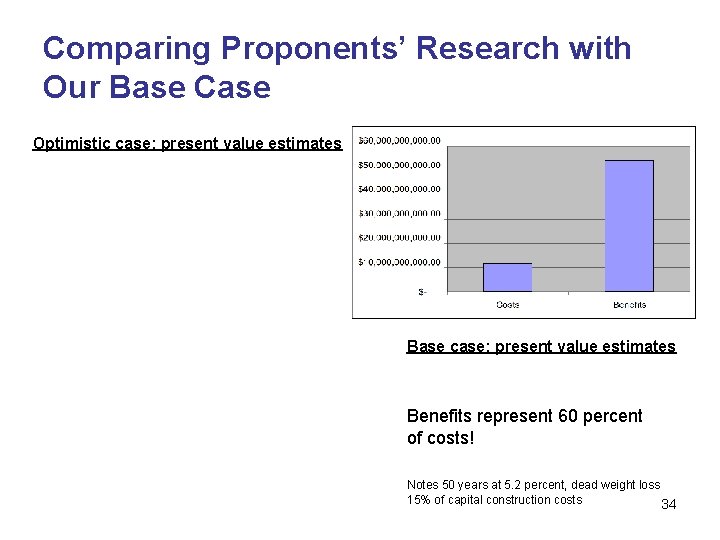
Comparing Proponents’ Research with Our Base Case Optimistic case: present value estimates Base case: present value estimates Benefits represent 60 percent of costs! Notes 50 years at 5. 2 percent, dead weight loss 15% of capital construction costs 34
Summary: What’s going on here? • Applying discount rates uniformly: – Makes costs look better, however… – This is very expensive even relative to comparable transit projects • Standing is important; we chose to ignore economic development because: – Difficult to estimate magnitude of effect • Studies did not employ reasonable estimation techniques – Very difficult to isolate marginal effects – Given national standing, marginal effects even less likely to appear 35
More Detailed Analysis Should Examine • Air quality improvements from mass transit • Quality of life: transportation options • Social equity: distributional weighting according to rider income distribution (Harlem, Lower East Side); access to CBDs • Value added of increased multimodal interconnection with other regional transportation • Real estate squeeze on low-income areas—a chronic problem in New York City 36
- Slides: 36