
Managing Oversaturated Arterials from Measurements to Control Dr

- Slides: 44
Managing Oversaturated Arterials: from Measurements to Control Dr. Henry Liu Professor, Dept. of Civil and Environmental Engr. Research Professor, Transportation Research Institute University of Michigan, Ann Arbor Seminar at University at Buffalo February 6, 2015 1
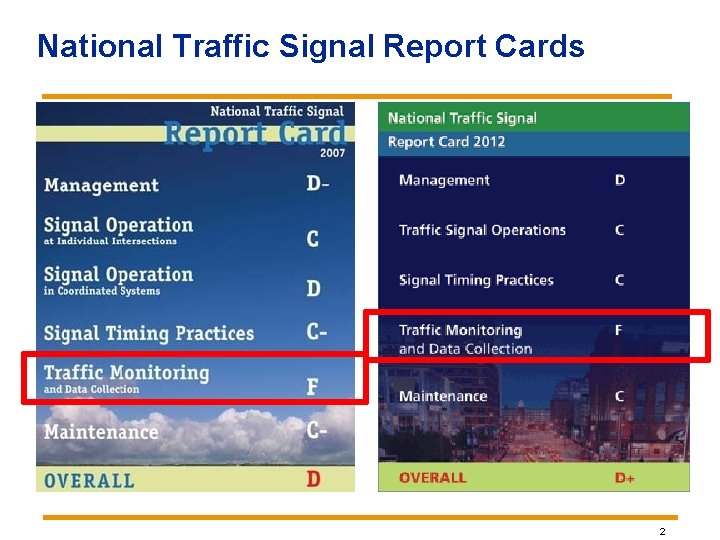
National Traffic Signal Report Cards 2
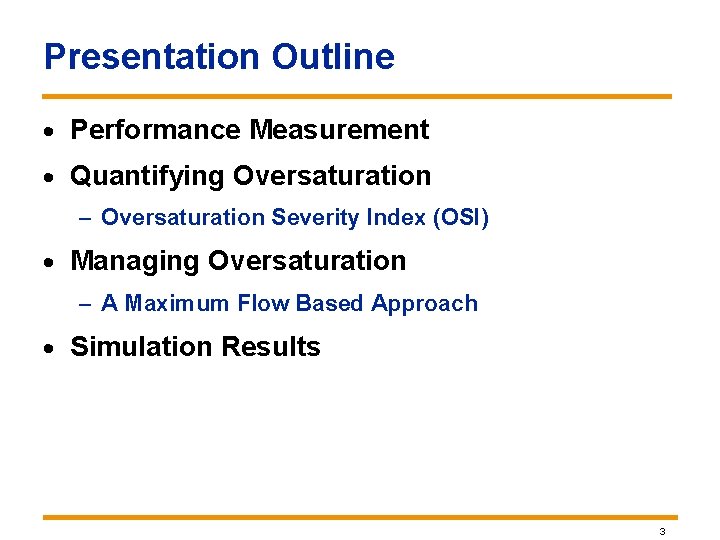
Presentation Outline · Performance Measurement · Quantifying Oversaturation – Oversaturation Severity Index (OSI) · Managing Oversaturation – A Maximum Flow Based Approach · Simulation Results 3
Performance Measurement Using the High-resolution Data SMART-Signal: Systematic Monitoring of Arterial Road Traffic Signals 4
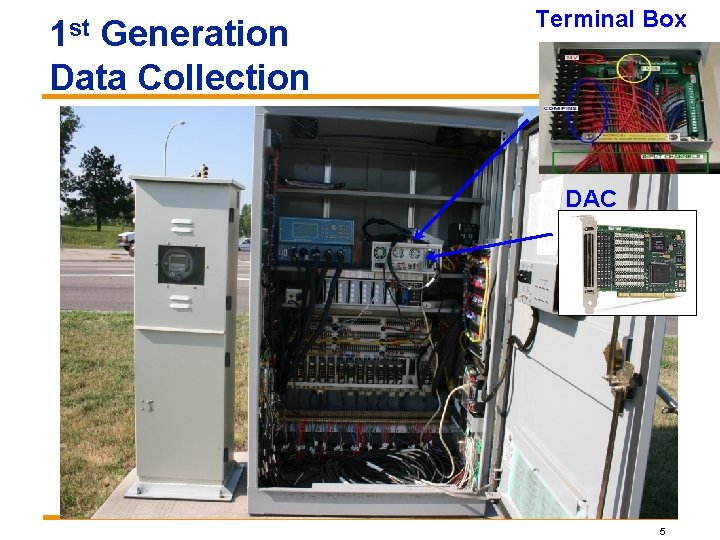
1 st Generation Data Collection Terminal Box DAC 5
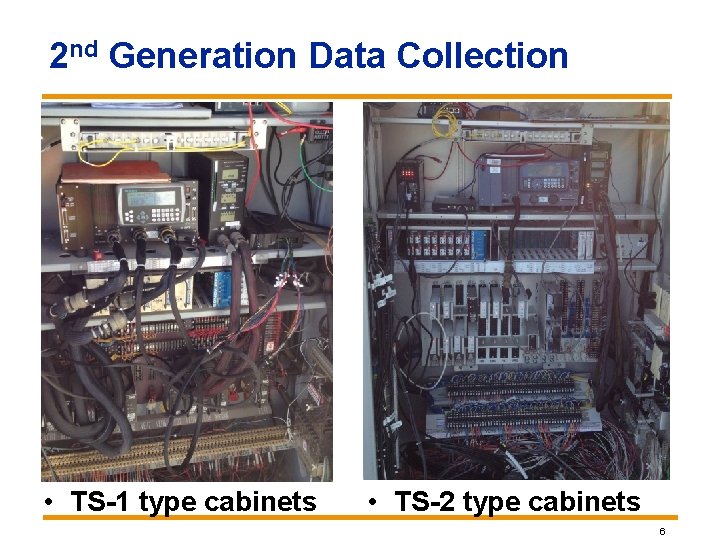
2 nd Generation Data Collection • TS-1 type cabinets • TS-2 type cabinets 6
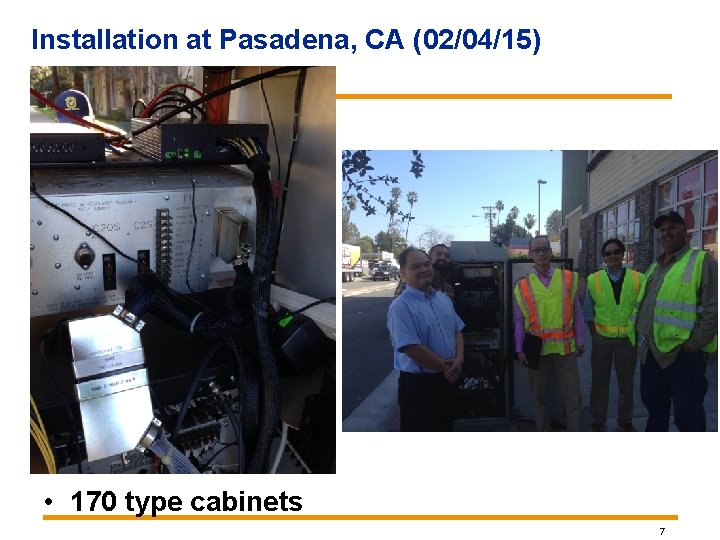
Installation at Pasadena, CA (02/04/15) • 170 type cabinets 7
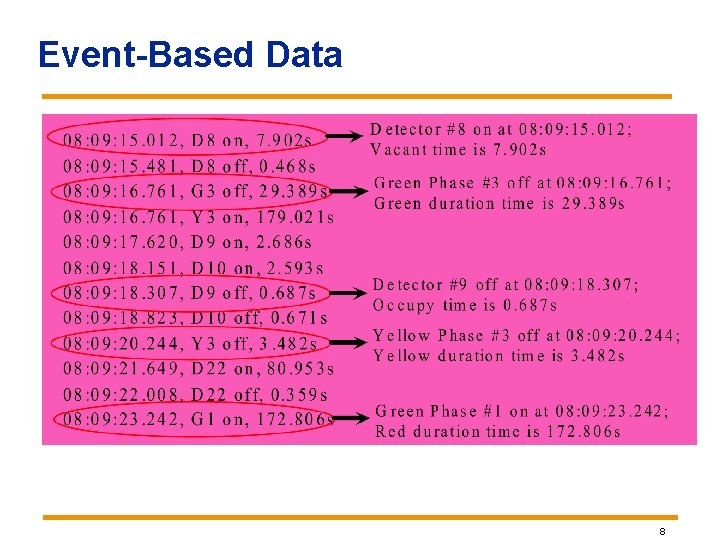
Event-Based Data 8
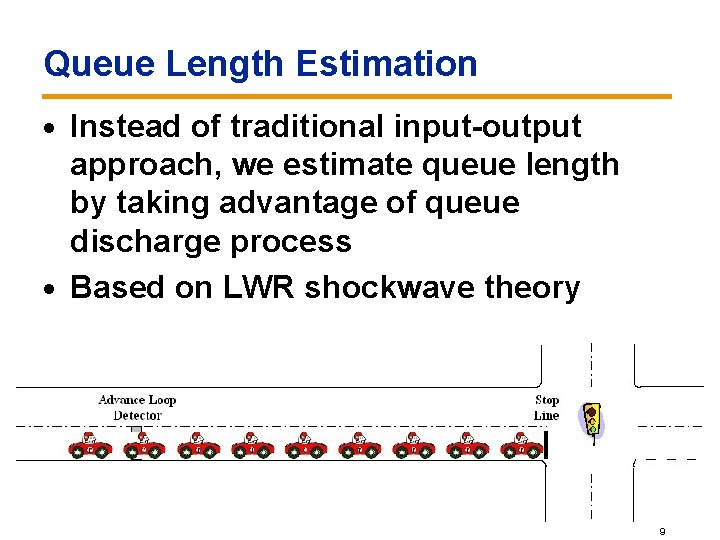
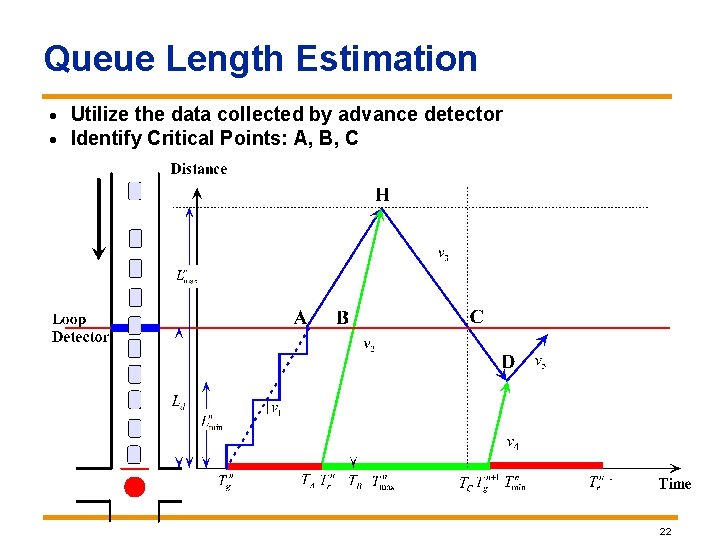
Queue Length Estimation · Instead of traditional input-output approach, we estimate queue length by taking advantage of queue discharge process · Based on LWR shockwave theory 9
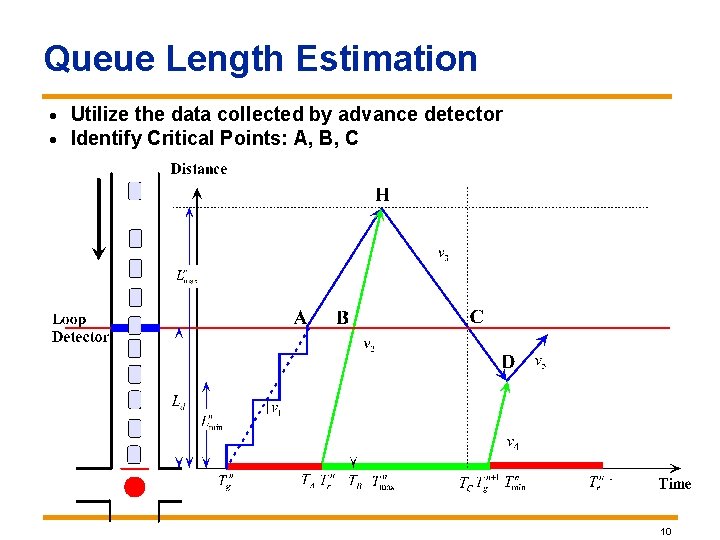
Queue Length Estimation · Utilize the data collected by advance detector · Identify Critical Points: A, B, C 10
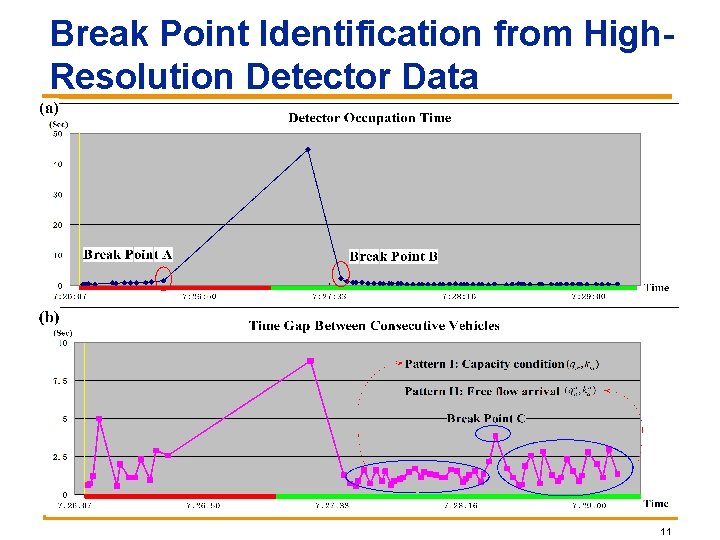
Break Point Identification from High. Resolution Detector Data 11
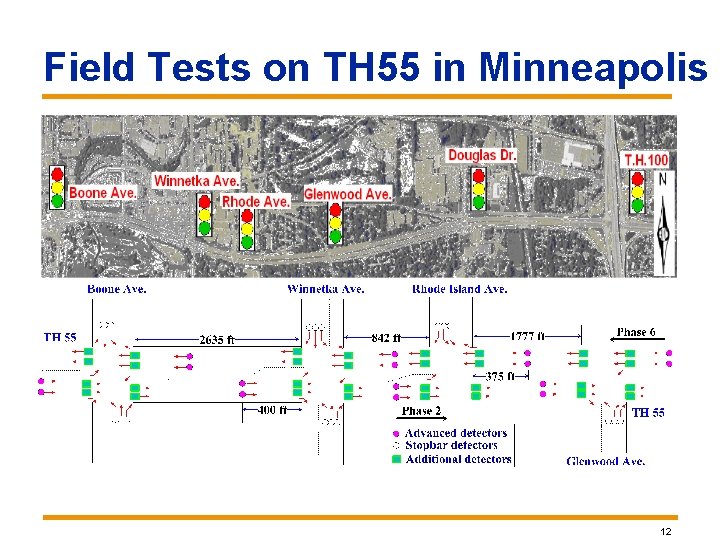
Field Tests on TH 55 in Minneapolis 12
Independent Evaluation of Performance Measures on TH 55 · By Alliant Engr. Inc · Queue length Manually count the vehicles (Two persons per approach) Four peak hours (July 22 nd and 23 rd, 2009) 13
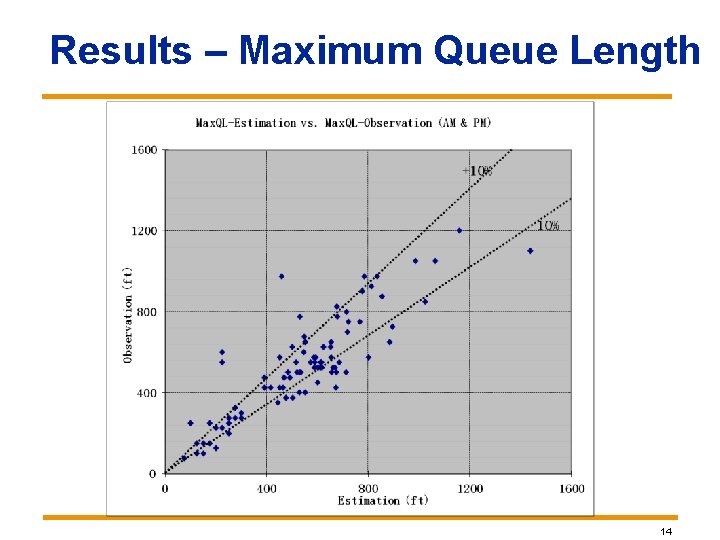
Results – Maximum Queue Length 14
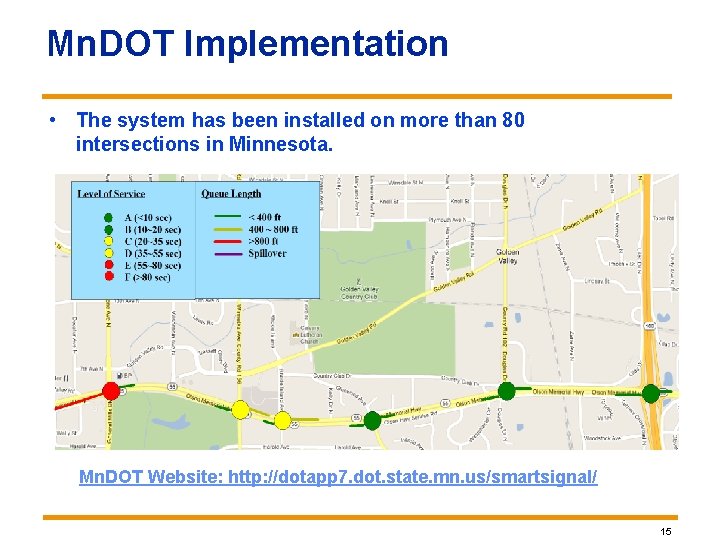
Mn. DOT Implementation • The system has been installed on more than 80 intersections in Minnesota. Mn. DOT Website: http: //dotapp 7. dot. state. mn. us/smartsignal/ 15
Quantifying Oversaturation Using the High-resolution Data 16
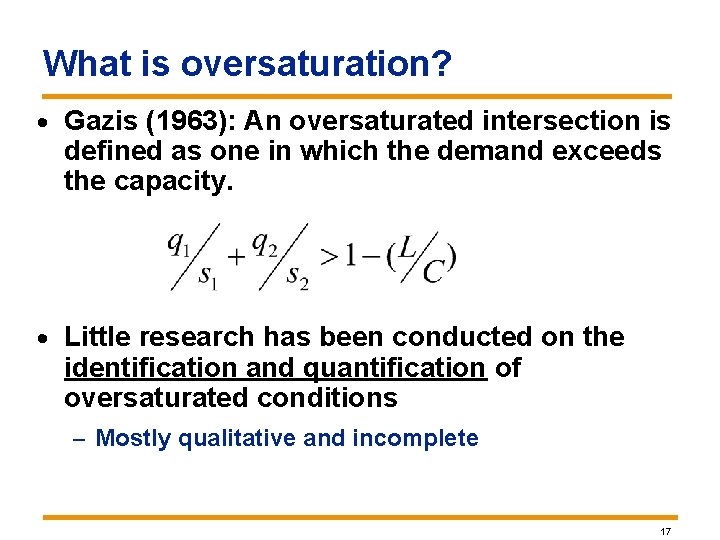
What is oversaturation? · Gazis (1963): An oversaturated intersection is defined as one in which the demand exceeds the capacity. · Little research has been conducted on the identification and quantification of oversaturated conditions – Mostly qualitative and incomplete 17
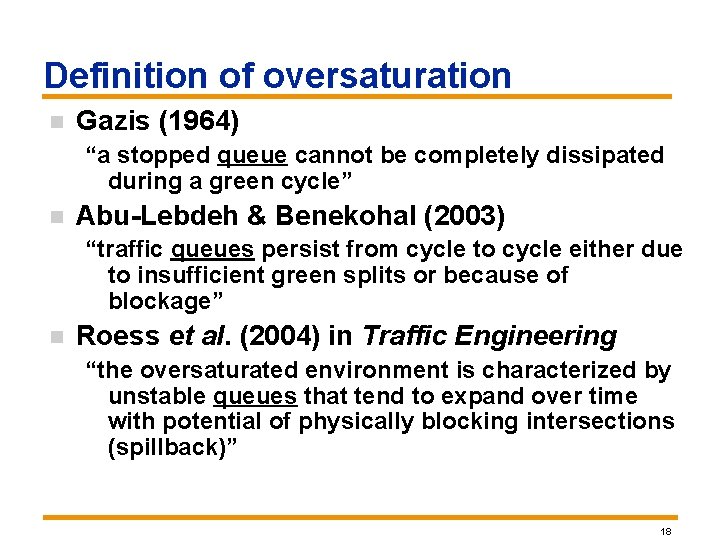
Definition of oversaturation n Gazis (1964) “a stopped queue cannot be completely dissipated during a green cycle” n Abu-Lebdeh & Benekohal (2003) “traffic queues persist from cycle to cycle either due to insufficient green splits or because of blockage” n Roess et al. (2004) in Traffic Engineering “the oversaturated environment is characterized by unstable queues that tend to expand over time with potential of physically blocking intersections (spillback)” 18
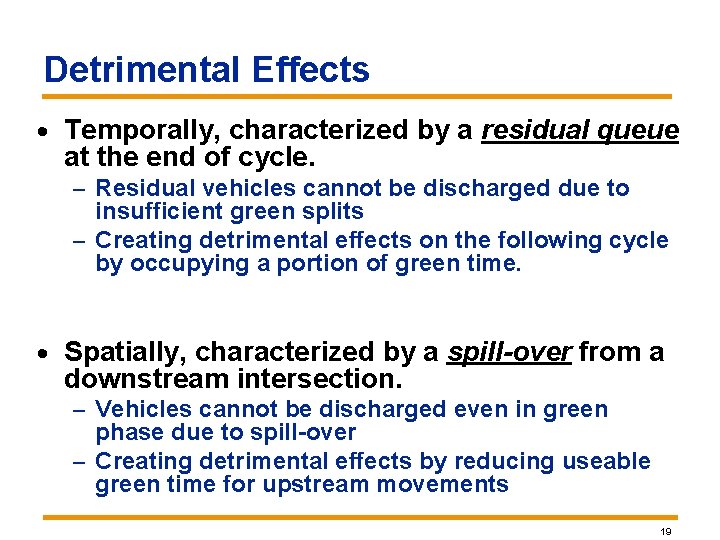
Detrimental Effects · Temporally, characterized by a residual queue at the end of cycle. – Residual vehicles cannot be discharged due to insufficient green splits – Creating detrimental effects on the following cycle by occupying a portion of green time. · Spatially, characterized by a spill-over from a downstream intersection. – Vehicles cannot be discharged even in green phase due to spill-over – Creating detrimental effects by reducing useable green time for upstream movements 19
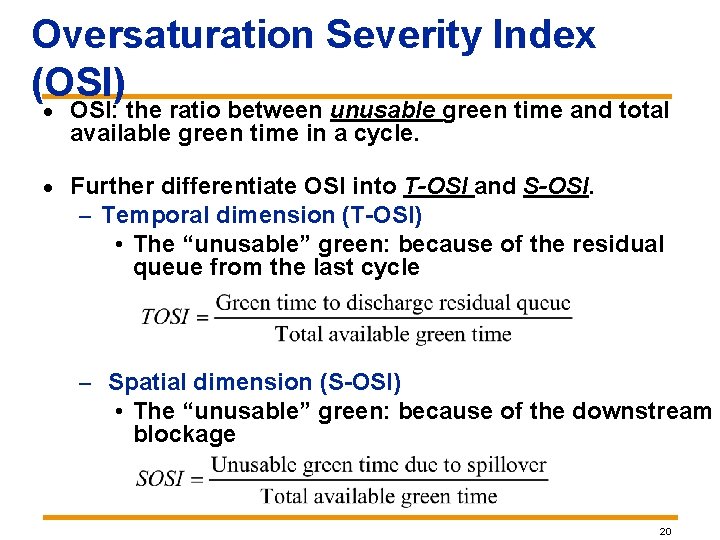
Oversaturation Severity Index (OSI) · OSI: the ratio between unusable green time and total available green time in a cycle. · Further differentiate OSI into T-OSI and S-OSI. – Temporal dimension (T-OSI) • The “unusable” green: because of the residual queue from the last cycle – Spatial dimension (S-OSI) • The “unusable” green: because of the downstream blockage 20
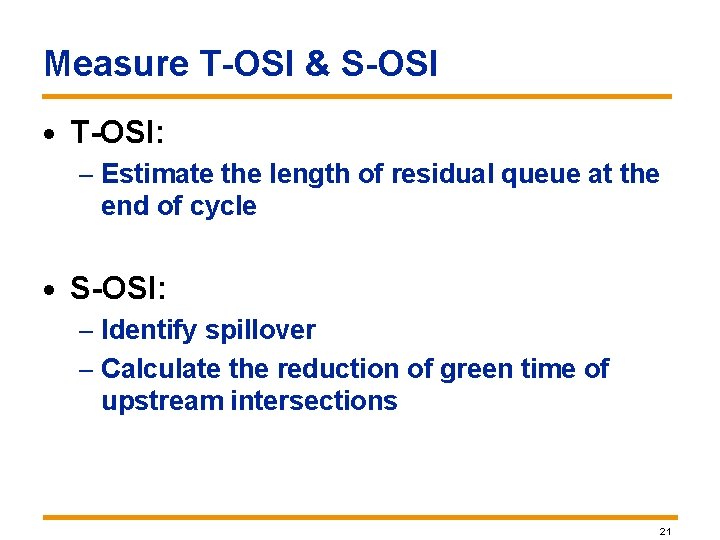
Measure T-OSI & S-OSI · T-OSI: – Estimate the length of residual queue at the end of cycle · S-OSI: – Identify spillover – Calculate the reduction of green time of upstream intersections 21
Queue Length Estimation · Utilize the data collected by advance detector · Identify Critical Points: A, B, C 22
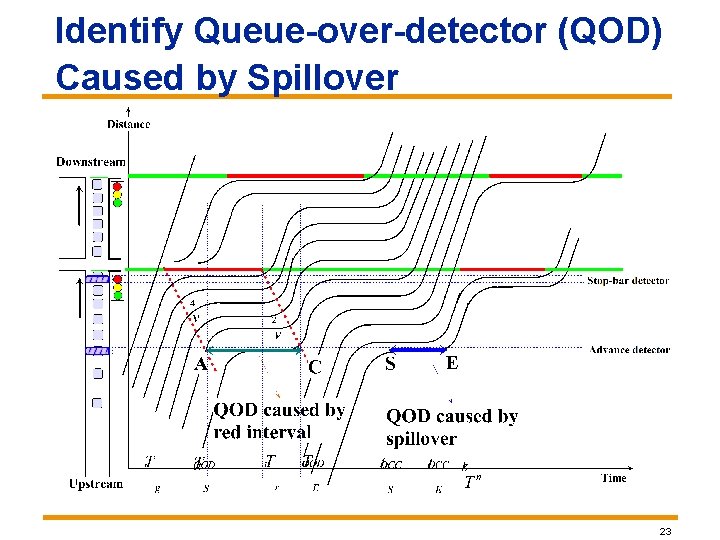
Identify Queue-over-detector (QOD) Caused by Spillover 23
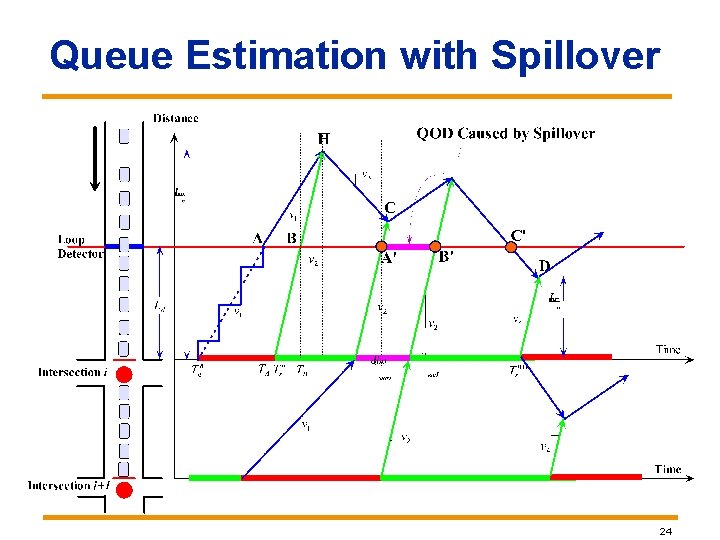
Queue Estimation with Spillover 24
Managing Oversaturation: A Maximum Flow Based Approach 25
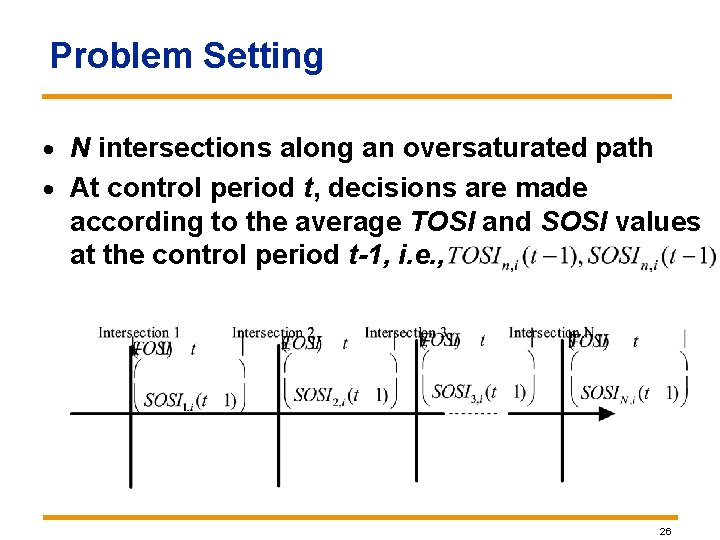
Problem Setting · N intersections along an oversaturated path · At control period t, decisions are made according to the average TOSI and SOSI values at the control period t-1, i. e. , 26
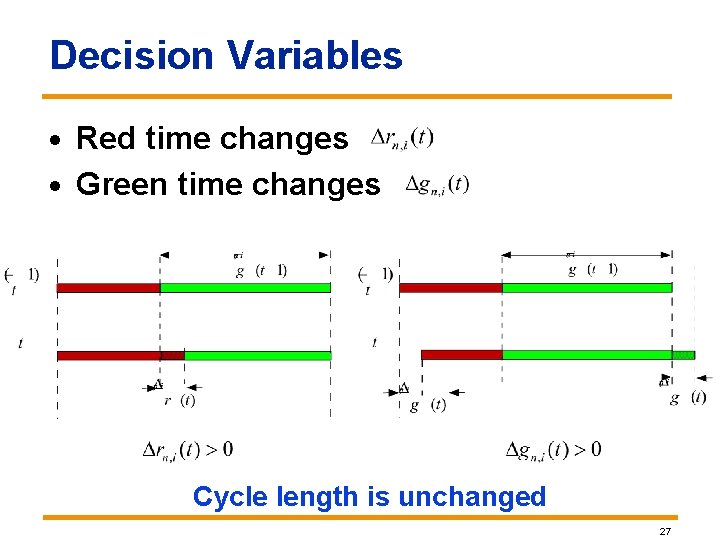
Decision Variables · Red time changes · Green time changes Cycle length is unchanged 27
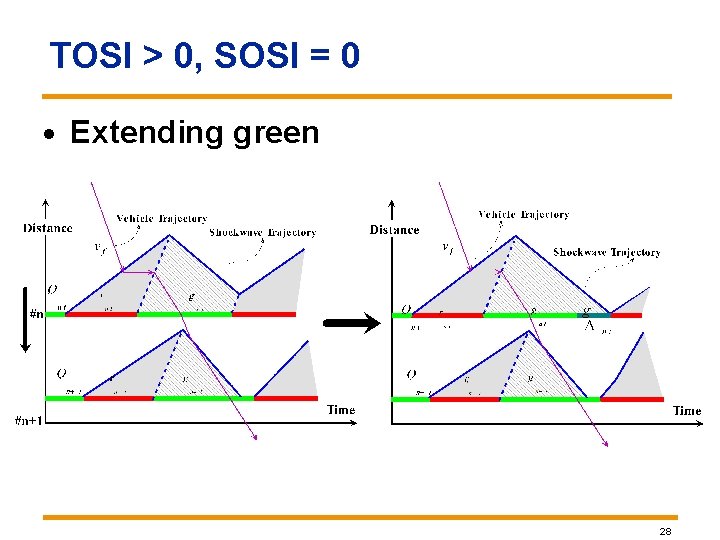
TOSI > 0, SOSI = 0 · Extending green 28
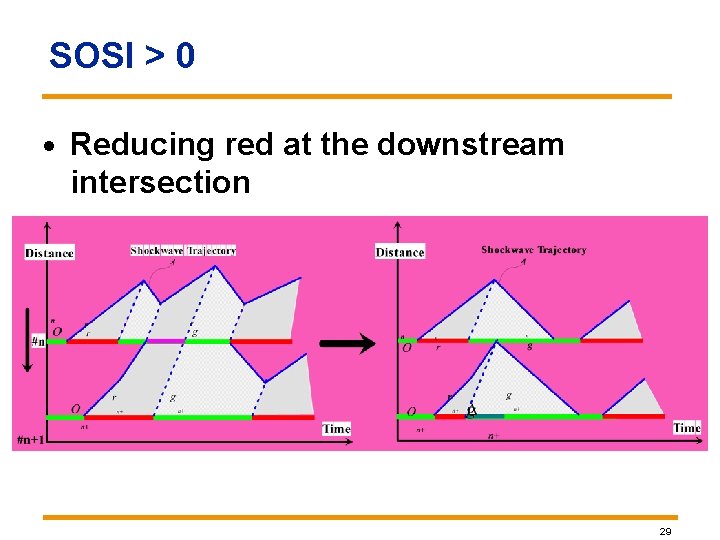
SOSI > 0 · Reducing red at the downstream intersection 29
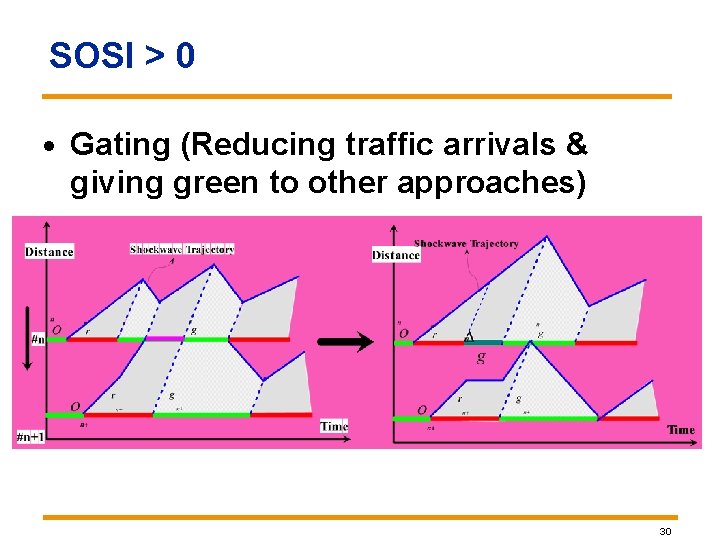
SOSI > 0 · Gating (Reducing traffic arrivals & giving green to other approaches) 30
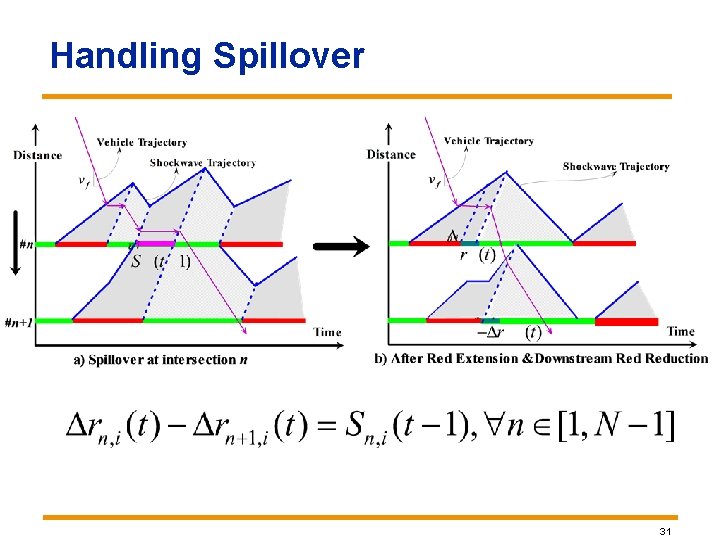
Handling Spillover 31
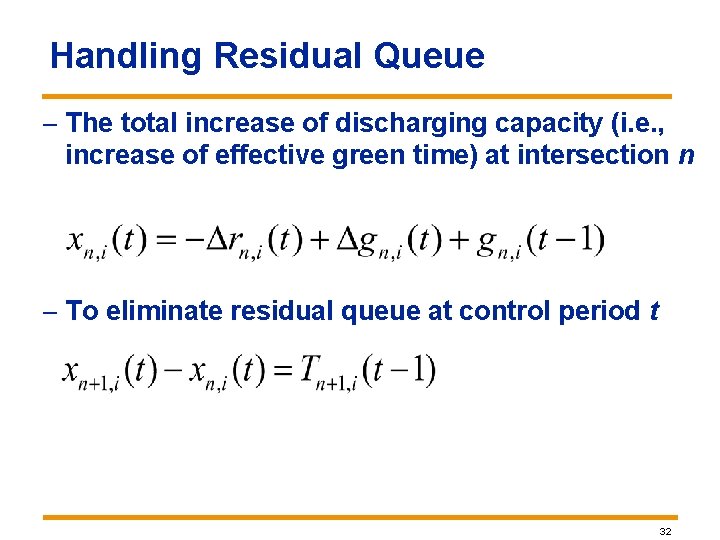
Handling Residual Queue – The total increase of discharging capacity (i. e. , increase of effective green time) at intersection n – To eliminate residual queue at control period t 32
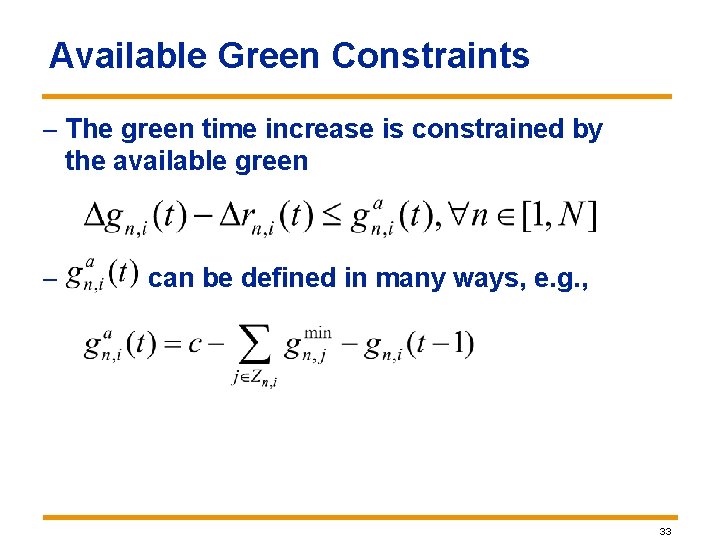
Available Green Constraints – The green time increase is constrained by the available green – can be defined in many ways, e. g. , 33
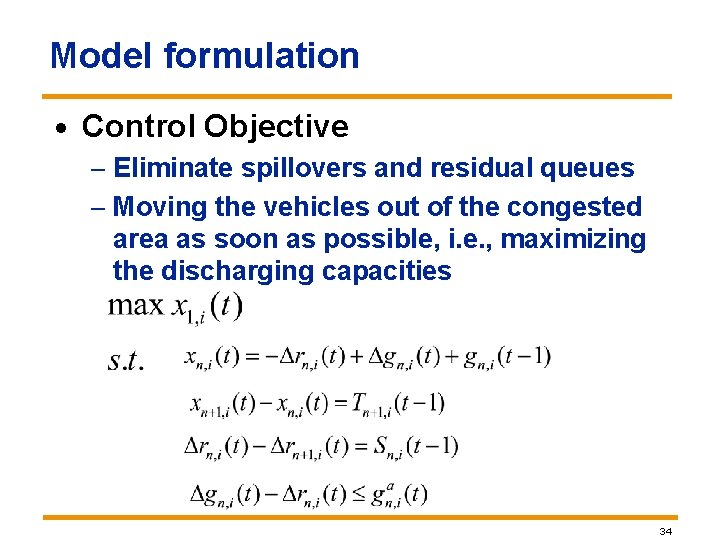
Model formulation · Control Objective – Eliminate spillovers and residual queues – Moving the vehicles out of the congested area as soon as possible, i. e. , maximizing the discharging capacities 34
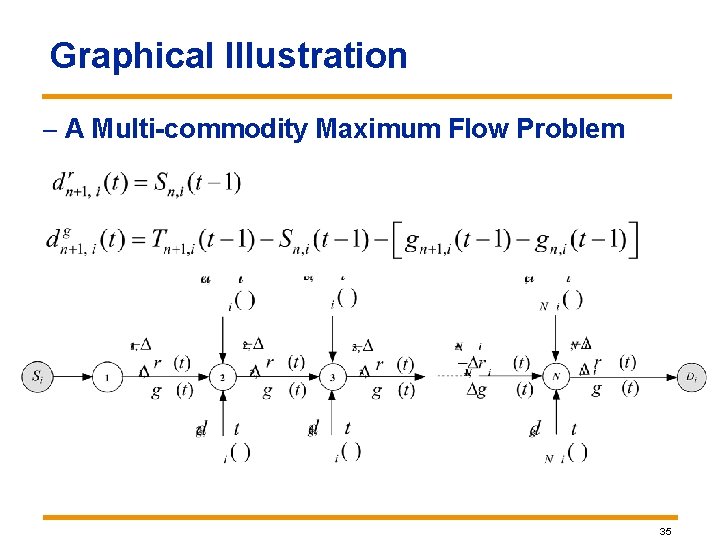
Graphical Illustration – A Multi-commodity Maximum Flow Problem 35
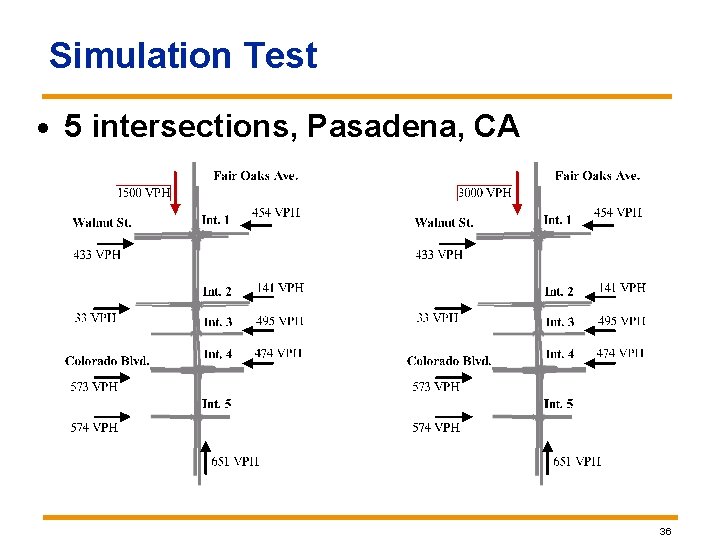
Simulation Test · 5 intersections, Pasadena, CA 36
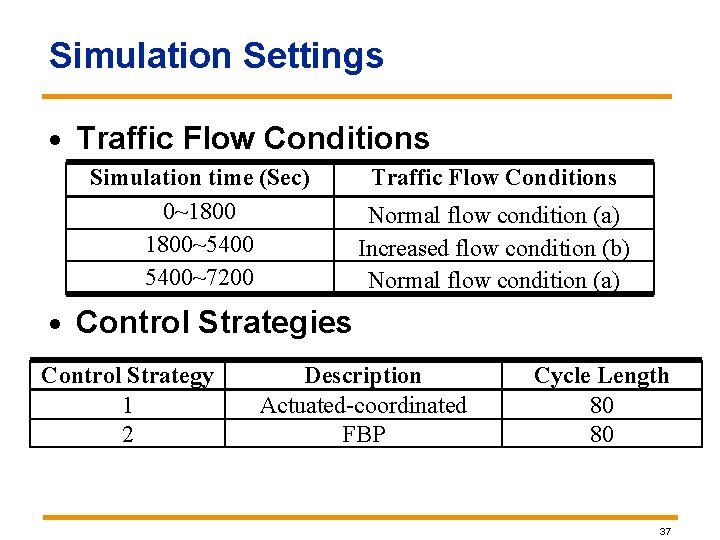
Simulation Settings · Traffic Flow Conditions Simulation time (Sec) 0~1800~5400~7200 Traffic Flow Conditions Normal flow condition (a) Increased flow condition (b) Normal flow condition (a) · Control Strategies Control Strategy 1 2 Description Actuated-coordinated FBP Cycle Length 80 80 37
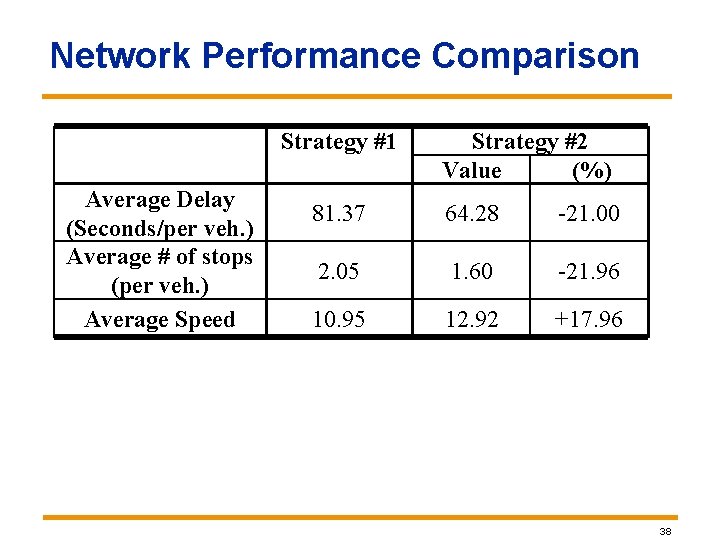
Network Performance Comparison Strategy #1 Average Delay (Seconds/per veh. ) Average # of stops (per veh. ) Average Speed Strategy #2 Value (%) 81. 37 64. 28 -21. 00 2. 05 1. 60 -21. 96 10. 95 12. 92 +17. 96 38
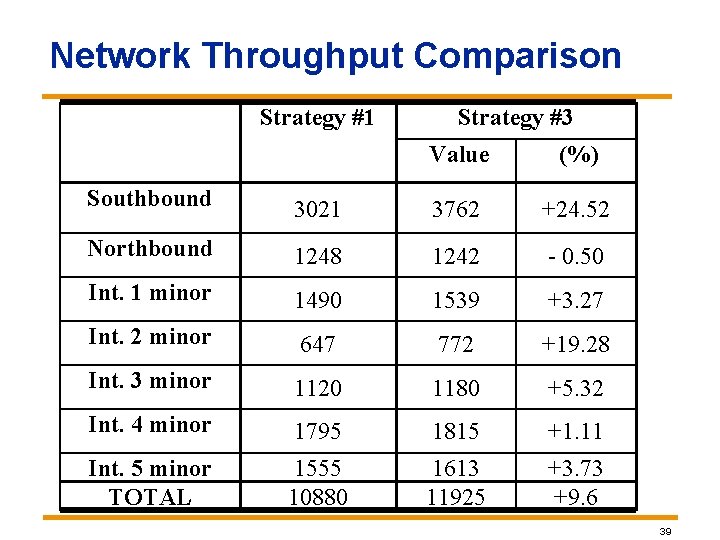
Network Throughput Comparison Strategy #1 Strategy #3 Value (%) Southbound 3021 3762 +24. 52 Northbound 1248 1242 - 0. 50 Int. 1 minor 1490 1539 +3. 27 Int. 2 minor 647 772 +19. 28 Int. 3 minor 1120 1180 +5. 32 Int. 4 minor 1795 1815 +1. 11 Int. 5 minor TOTAL 1555 10880 1613 11925 +3. 73 +9. 6 39
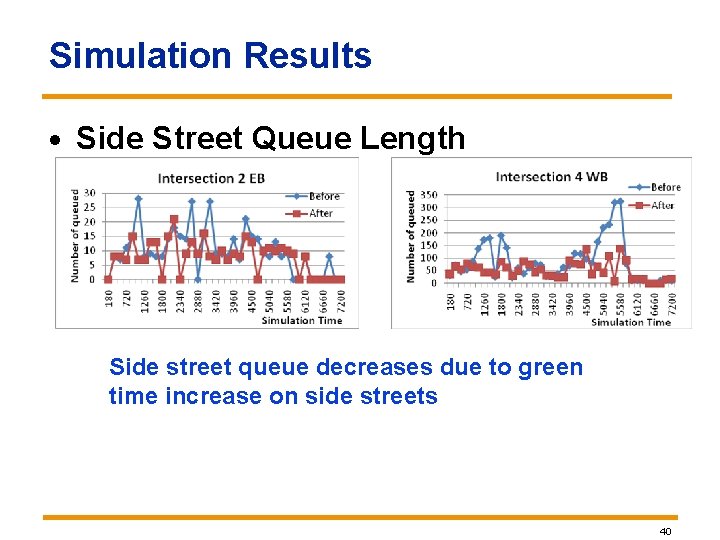
Simulation Results · Side Street Queue Length Side street queue decreases due to green time increase on side streets 40
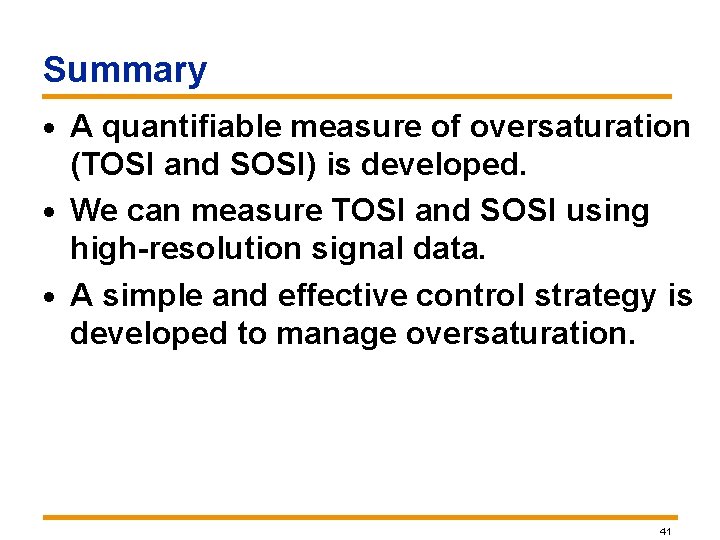
Summary · A quantifiable measure of oversaturation (TOSI and SOSI) is developed. · We can measure TOSI and SOSI using high-resolution signal data. · A simple and effective control strategy is developed to manage oversaturation. 41
Concluding Remarks Although traffic is traditionally modeled as “continuous flow”, traffic, after all, is discrete. Measuring traffic flow parameters using the data collected at the individual vehicle level Embrace the era of “BIG DATA”, but DATA is not everything. Measurements and Models, you cannot have one without the other. 42
Acknowledgements 43
THANK YOU! Prof. Henry Liu 1 -734 -764 -4354 henryliu@umich. edu 44