
Managing Interest Rate RiskII Duration GAP and Economic
- Slides: 20
Managing Interest Rate Risk(II): Duration GAP and Economic Value of Equity
Measuring Interest Rate Risk with Duration GAP n Economic Value of Equity Analysis n Focuses on changes in stockholders’ equity given potential changes in interest rates n Duration GAP Analysis n Compares the price sensitivity of a bank’s total assets with the price sensitivity of its total liabilities to assess the impact of potential changes in interest rates on stockholders’ equity.
Duration GAP n Duration GAP Model n Focuses on managing the market value of stockholders’ equity n The bank can protect EITHER the market value of equity or net interest income, but not both n Duration GAP analysis emphasizes the impact on equity n Compares the duration of a bank’s assets with the duration of the bank’s liabilities and examines how the economic value stockholders’ equity will change when interest rates change.
Steps in Duration GAP Analysis n Forecast interest rates. n Estimate the market values of bank assets, liabilities and stockholders’ equity. n Estimate the weighted average duration of assets and the weighted average duration of liabilities. n Incorporate the effects of both on- and offbalance sheet items. These estimates are used to calculate duration gap. n Forecasts changes in the market value of stockholders’ equity across different interest rate environments.
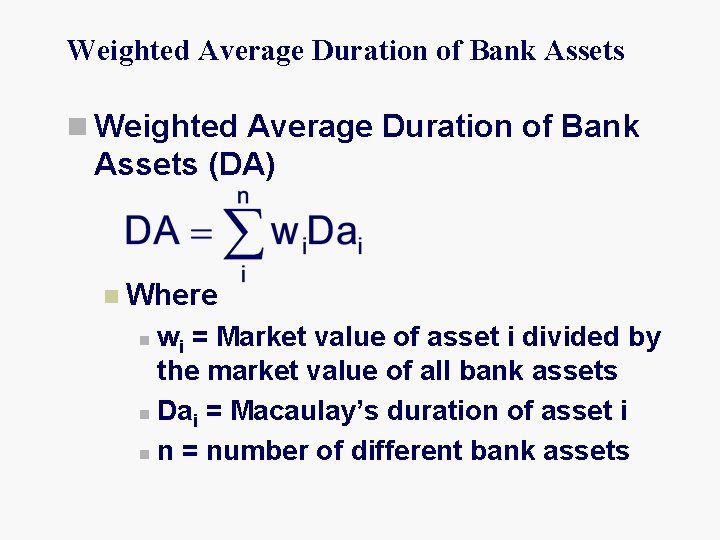
Weighted Average Duration of Bank Assets n Weighted Average Duration of Bank Assets (DA) n Where wi = Market value of asset i divided by the market value of all bank assets n Dai = Macaulay’s duration of asset i n n = number of different bank assets n
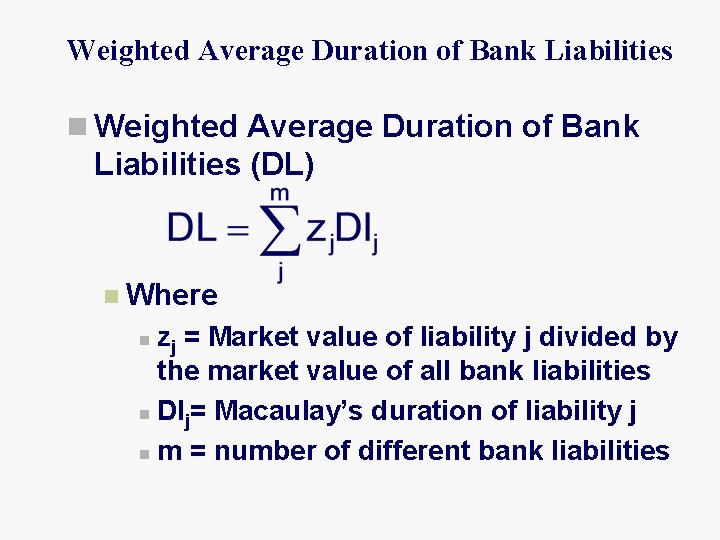
Weighted Average Duration of Bank Liabilities n Weighted Average Duration of Bank Liabilities (DL) n Where zj = Market value of liability j divided by the market value of all bank liabilities n Dlj= Macaulay’s duration of liability j n m = number of different bank liabilities n
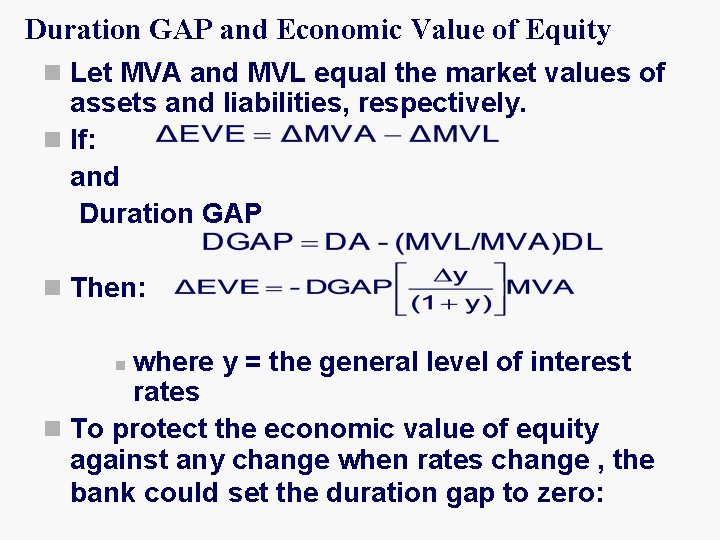
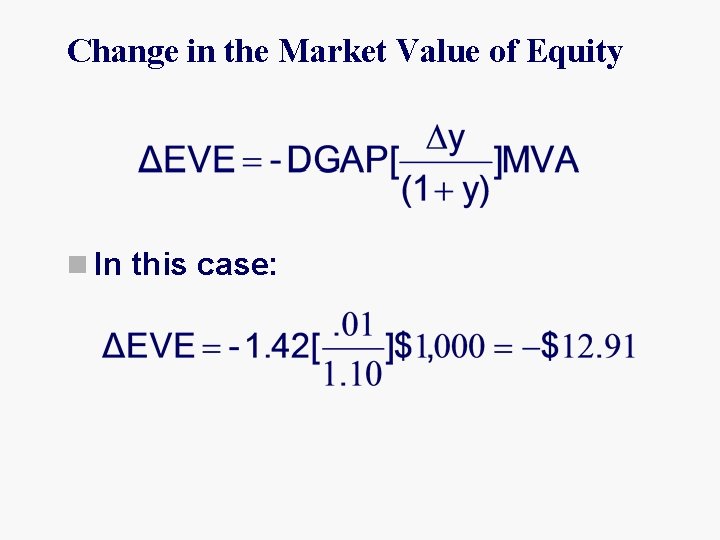
Duration GAP and Economic Value of Equity n Let MVA and MVL equal the market values of assets and liabilities, respectively. n If: and Duration GAP n Then: where y = the general level of interest rates n To protect the economic value of equity against any change when rates change , the bank could set the duration gap to zero: n
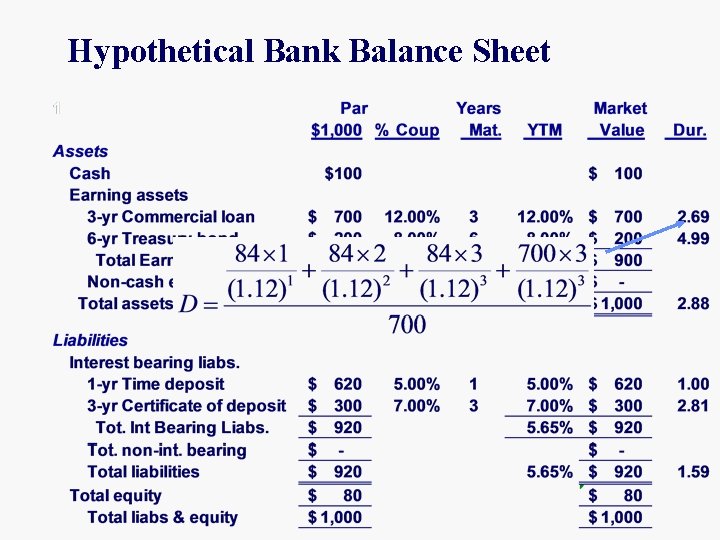
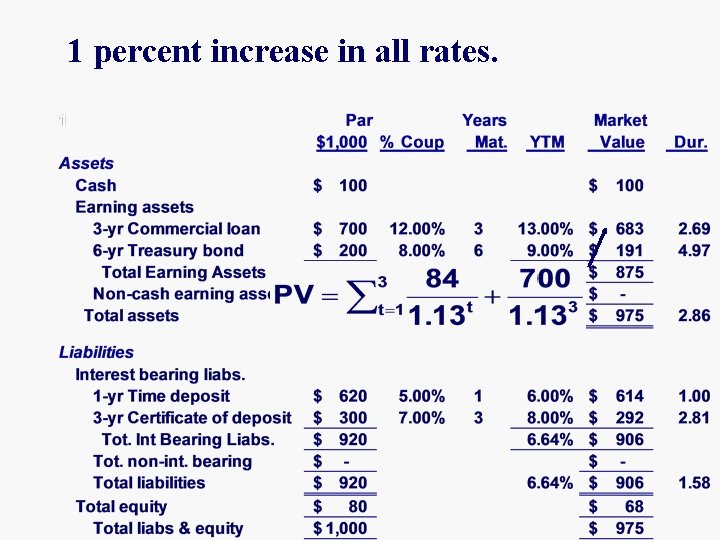
Hypothetical Bank Balance Sheet
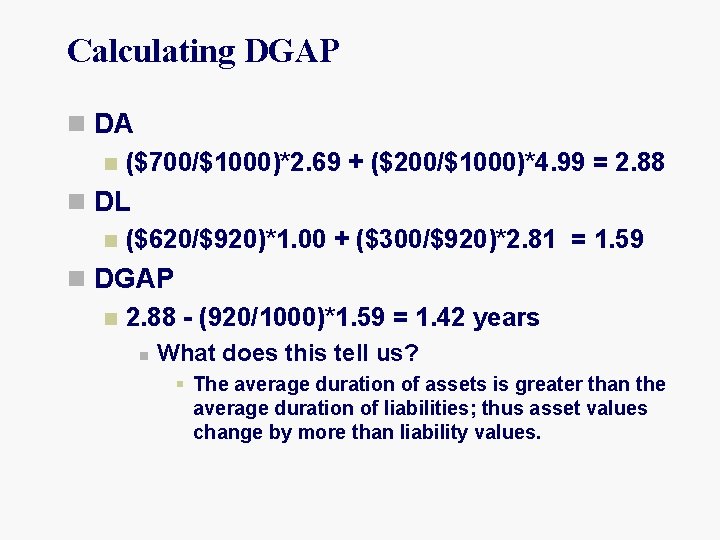
Calculating DGAP n DA n ($700/$1000)*2. 69 + ($200/$1000)*4. 99 = 2. 88 n DL n ($620/$920)*1. 00 + ($300/$920)*2. 81 = 1. 59 n DGAP n 2. 88 - (920/1000)*1. 59 = 1. 42 years n What does this tell us? § The average duration of assets is greater than the average duration of liabilities; thus asset values change by more than liability values.
1 percent increase in all rates.
Change in the Market Value of Equity n In this case:
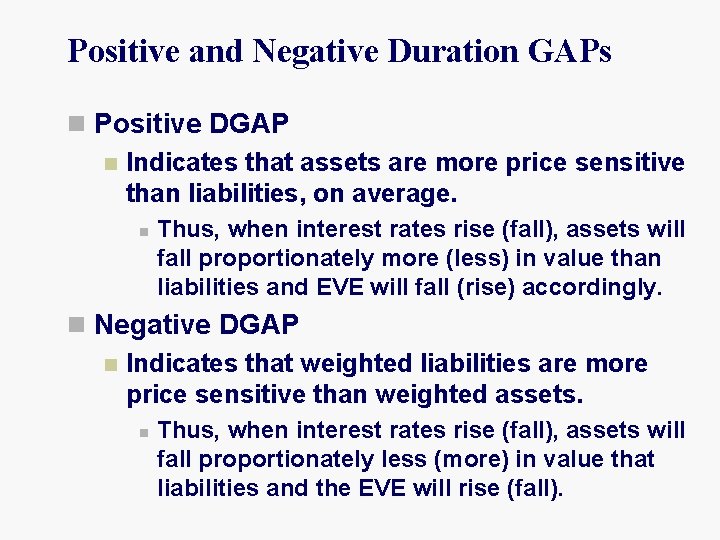
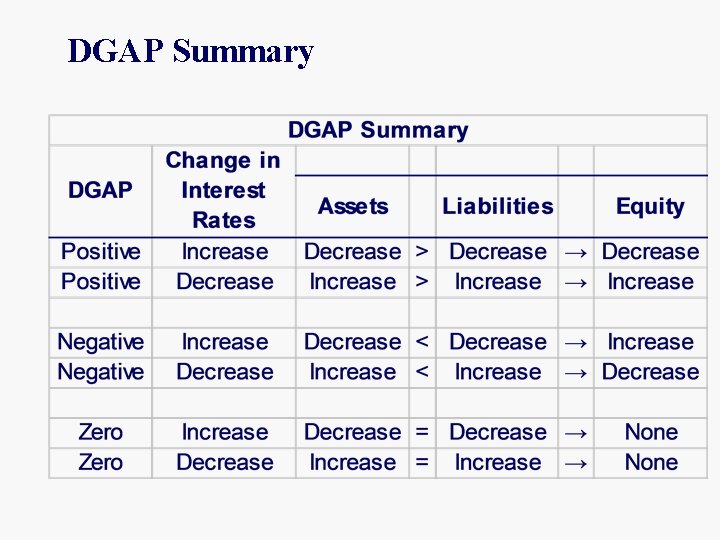
Positive and Negative Duration GAPs n Positive DGAP n Indicates that assets are more price sensitive than liabilities, on average. n Thus, when interest rates rise (fall), assets will fall proportionately more (less) in value than liabilities and EVE will fall (rise) accordingly. n Negative DGAP n Indicates that weighted liabilities are more price sensitive than weighted assets. n Thus, when interest rates rise (fall), assets will fall proportionately less (more) in value that liabilities and the EVE will rise (fall).
DGAP Summary
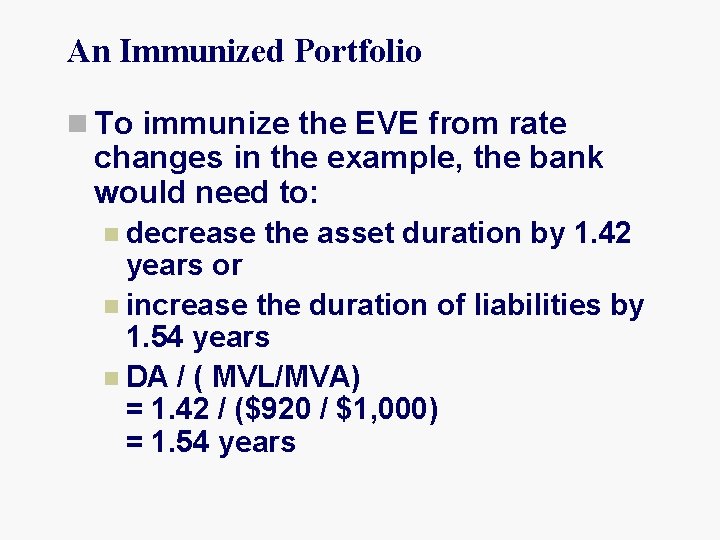
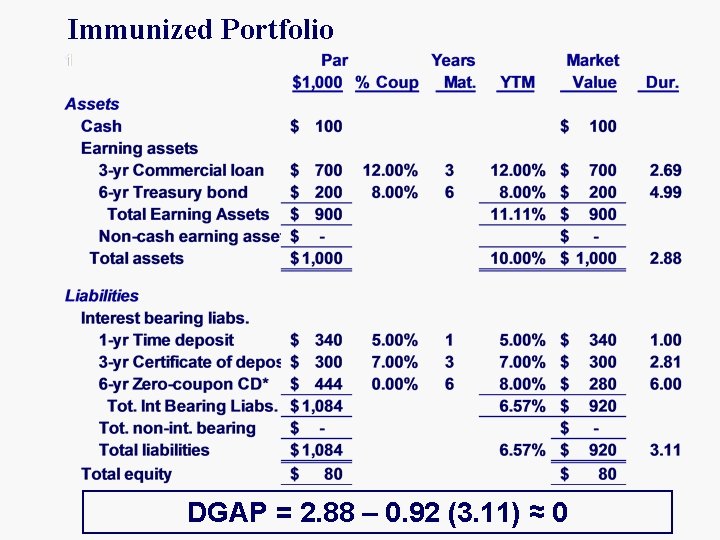
An Immunized Portfolio n To immunize the EVE from rate changes in the example, the bank would need to: n decrease the asset duration by 1. 42 years or n increase the duration of liabilities by 1. 54 years n DA / ( MVL/MVA) = 1. 42 / ($920 / $1, 000) = 1. 54 years
Immunized Portfolio DGAP = 2. 88 – 0. 92 (3. 11) ≈ 0
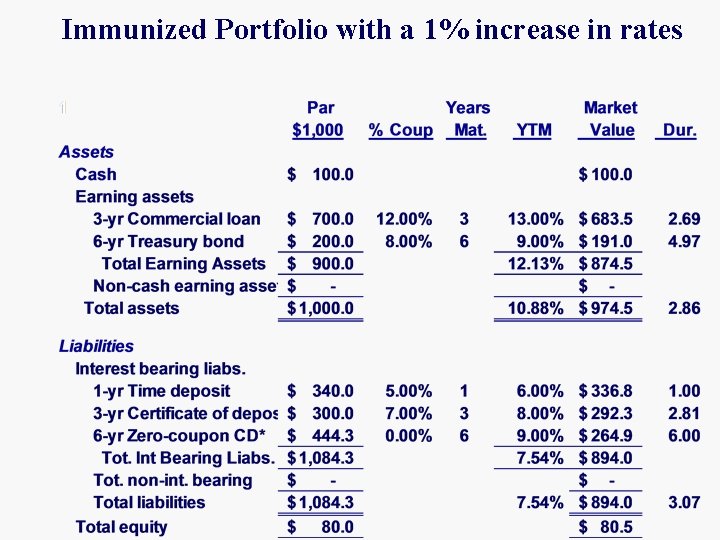
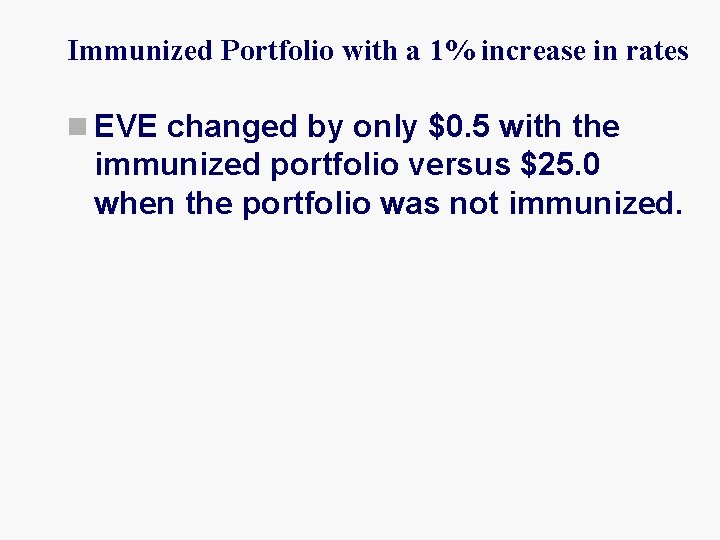
Immunized Portfolio with a 1% increase in rates
Immunized Portfolio with a 1% increase in rates n EVE changed by only $0. 5 with the immunized portfolio versus $25. 0 when the portfolio was not immunized.
Economic Value of Equity Sensitivity Analysis n Effectively involves the same steps as earnings sensitivity analysis. n In EVE analysis, however, the bank focuses on: n The relative durations of assets and liabilities n How much the durations change in different interest rate environments n What happens to the economic value of equity across different rate environments
Strengths and Weaknesses: DGAP and EVESensitivity Analysis n Strengths n Duration analysis provides a comprehensive measure of interest rate risk n Duration measures are additive n This allows for the matching of total assets with total liabilities rather than the matching of individual accounts n Duration analysis takes a longer term view than static gap analysis
Strengths and Weaknesses: DGAP and EVESensitivity Analysis n Weaknesses n It is difficult to compute duration accurately n “Correct” duration analysis requires that each future cash flow be discounted by a distinct discount rate n A bank must continuously monitor and adjust the duration of its portfolio n It is difficult to estimate the duration on assets and liabilities that do not earn or pay interest n Duration measures are highly subjective