
MANAGEMENT TOOLKIT PART 2 CUSTOMER SATISFACTION SYSTEM The
- Slides: 15
MANAGEMENT TOOLKIT (PART 2)
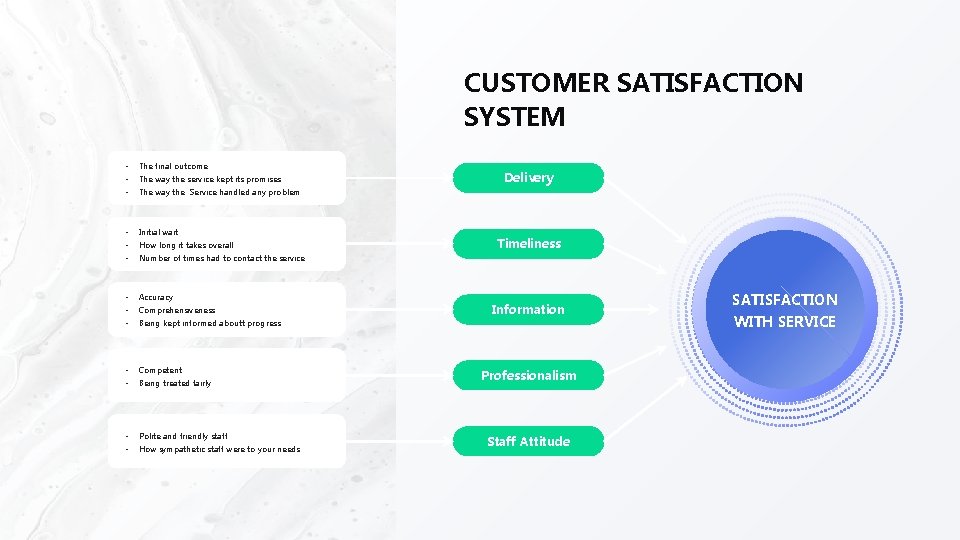
CUSTOMER SATISFACTION SYSTEM • The final outcome • The way the service kept its promises • The way the Service handled any problem • Initial wait • How long it takes overall • Number of times had to contact the service • Accuracy • Comprehensiveness • Being kept informed aboutt progress • Competent • Being treated fairly • Polite and friendly staff • How sympathetic staff were to your needs Delivery Timeliness Information Professionalism Staff Attitude SATISFACTION WITH SERVICE
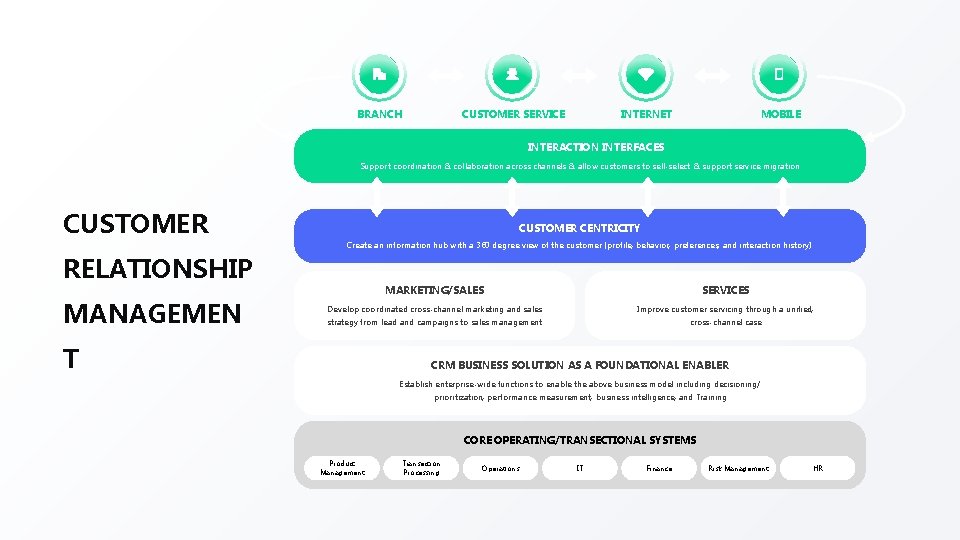
BRANCH CUSTOMER SERVICE INTERNET MOBILE INTERACTION INTERFACES Support coordination & collaboration across channels & allow customers to sell-select & support service migration CUSTOMER CENTRICITY Create an information hub with a 360 degree view of the customer (profile, behavior, preferences, and interaction history) RELATIONSHIP MANAGEMEN MARKETING/SALES SERVICES Develop coordinated cross-channel marketing and sales Improve customer servicing through a unified, strategy from lead and campaigns to sales management cross-channel case T CRM BUSINESS SOLUTION AS A FOUNDATIONAL ENABLER Establish enterprise-wide functions to enable the above business model including decisioning/ prioritization, performance measurement, business intelligence, and Training CORE OPERATING/TRANSECTIONAL SYSTEMS Product Management Transection Processing Operations IT Finance Risk Management HR
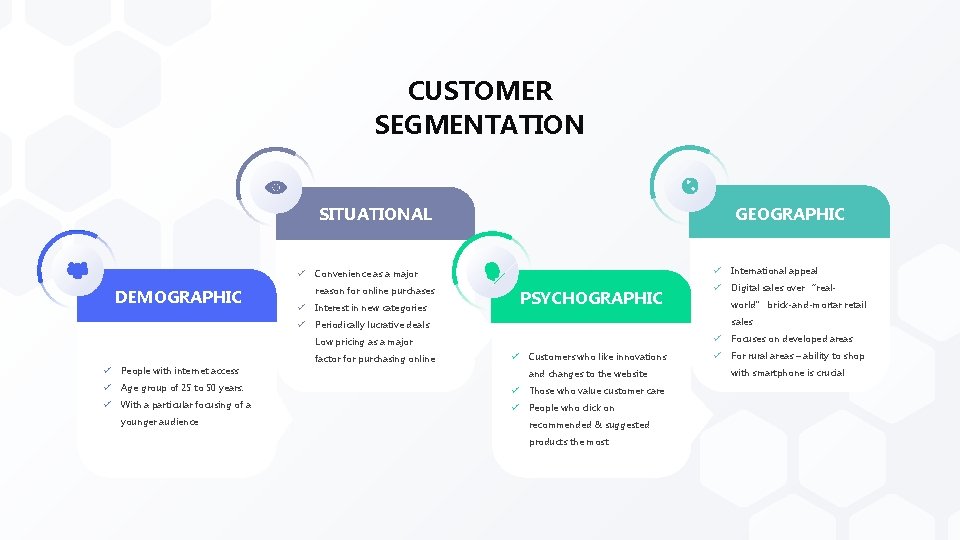
CUSTOMER SEGMENTATION SITUATIONAL ü DEMOGRAPHIC GEOGRAPHIC Convenience as a major ü International appeal reason for online purchases ü Digital sales over “real- ü Interest in new categories ü Periodically lucrative deals PSYCHOGRAPHIC sales Low pricing as a major factor for purchasing online ü Customers who like innovations ü People with internet access ü Age group of 25 to 50 years. ü Those who value customer care ü With a particular focusing of a ü People who click on younger audience world” brick-and-mortar retail and changes to the website recommended & suggested products the most. ü Focuses on developed areas ü For rural areas – ability to shop with smartphone is crucial
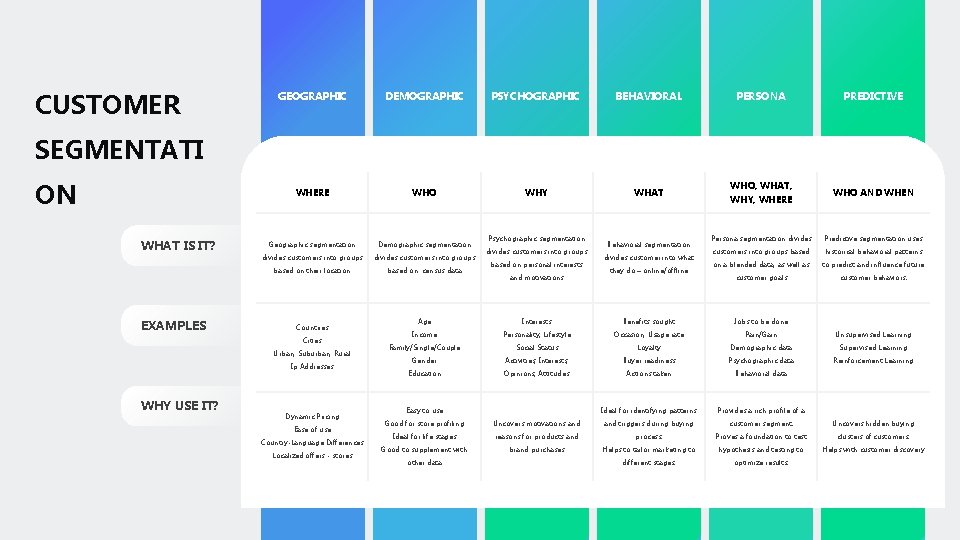
CUSTOMER GEOGRAPHIC DEMOGRAPHIC PSYCHOGRAPHIC BEHAVIORAL WHERE WHO WHY WHAT Geographic segmentation Demographic segmentation divides customers into groups based on their location based on census data PERSONA PREDICTIVE SEGMENTATI ON WHAT IS IT? EXAMPLES Countries Cities Urban, Suburban, Rural Ip Addresses WHY USE IT? Dynamic Pricing Ease of use Country-Language Differences Localized offers - stores Psychographic segmentation divides customers into groups based on personal interests and motivations Behavioral segmentation divides customer into what they do – online/offline Age Interests Benefits sought WHO, WHAT, WHY, WHERE Persona segmentation divides WHO AND WHEN Predictive segmentation uses customers into groups based historical behavioral patterns on a blended data, as well as to predict and influence future customer goals customer behaviors. Jobs to be done Income Personality, Lifestyle Occasion, Usage rate Pain/Gain Family/Single/Couple Social Status Loyalty Demographic data Supervised Learning Gender Activities, Interests, Buyer readiness Psychographic data Reinforcement Learning Education Opinions, Attitudes Actions taken Behavioral data Ideal for identifying patterns Provides a rich profile of a Easy to use Unsupervised Learning Good for store profiling Uncovers motivations and triggers during buying customer segment. Ideal for life stages reasons for products and process. Proves a foundation to test clusters of customers. Good to supplement with brand purchases Helps to tailor marketing to hypothesis and testing to Helps with customer discovery different stages. optimize results. other data Uncovers hidden buying
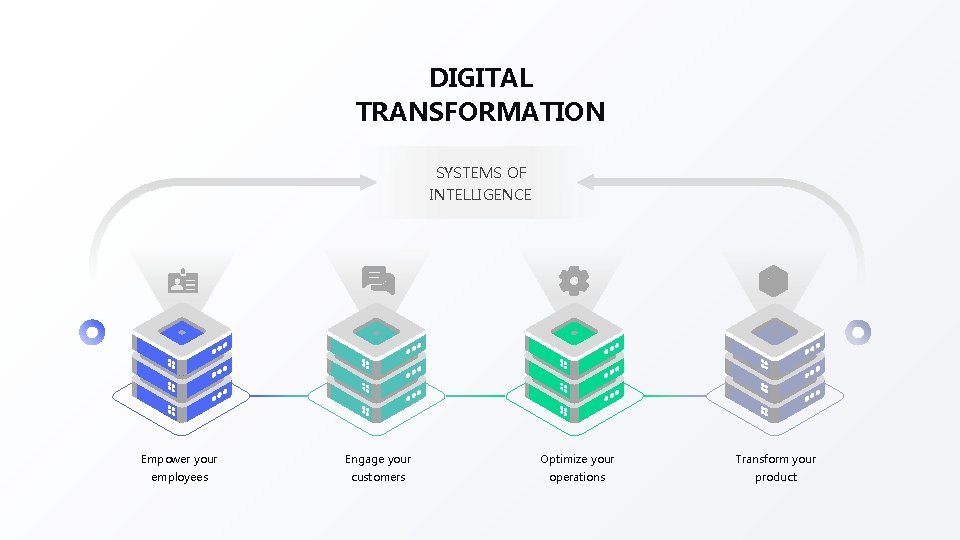
DIGITAL TRANSFORMATION SYSTEMS OF INTELLIGENCE Empower your Engage your Optimize your Transform your employees customers operations product
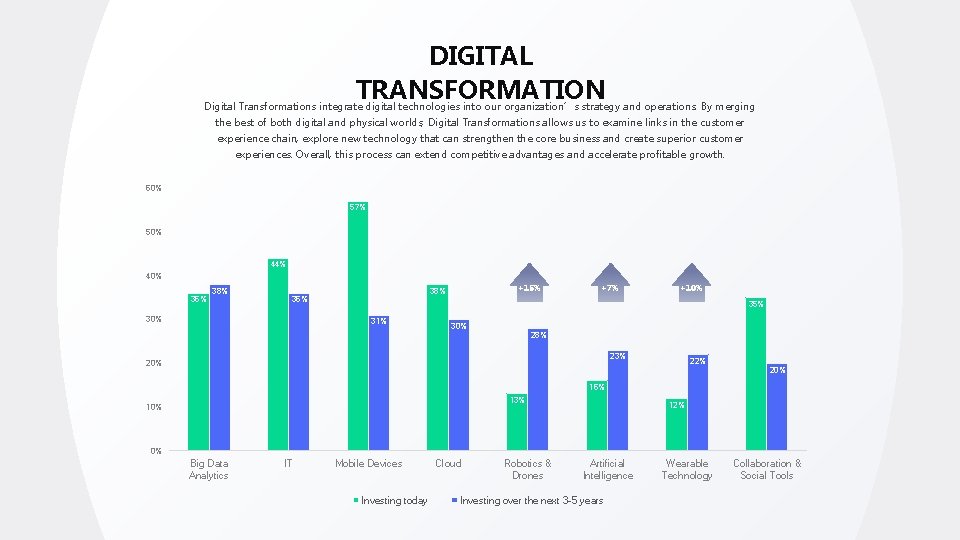
DIGITAL TRANSFORMATION Digital Transformations integrate digital technologies into our organization’s strategy and operations. By merging the best of both digital and physical worlds, Digital Transformations allows us to examine links in the customer experience chain, explore new technology that can strengthen the core business and create superior customer experiences. Overall, this process can extend competitive advantages and accelerate profitable growth. 60% 57% 50% 44% 40% 36% 38% 30% +15% 38% 36% +7% +10% 35% 31% 30% 28% 23% 20% 22% 20% 16% 13% 10% 12% 0% Big Data Analytics IT Mobile Devices Investing today Cloud Robotics & Drones Artificial Intelligence Investing over the next 3 -5 years Wearable Technology Collaboration & Social Tools
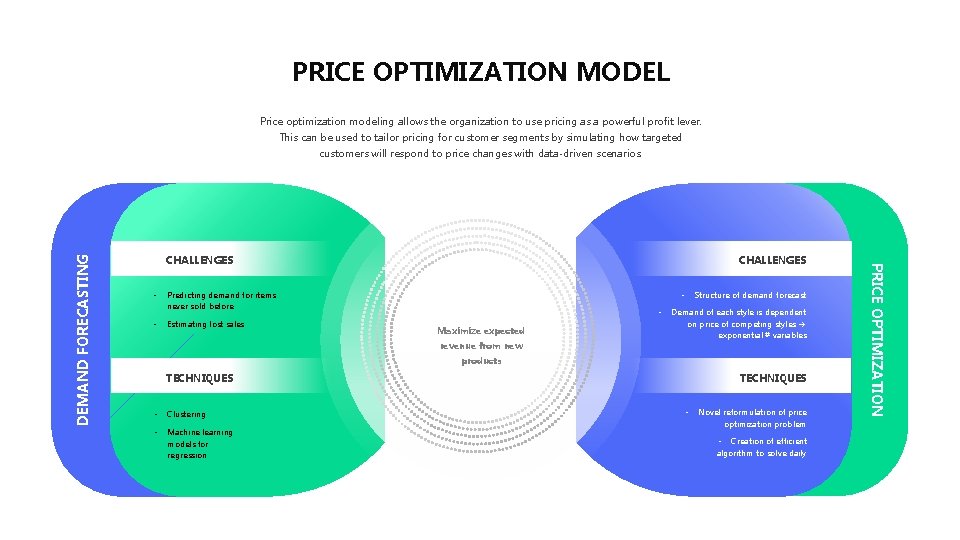
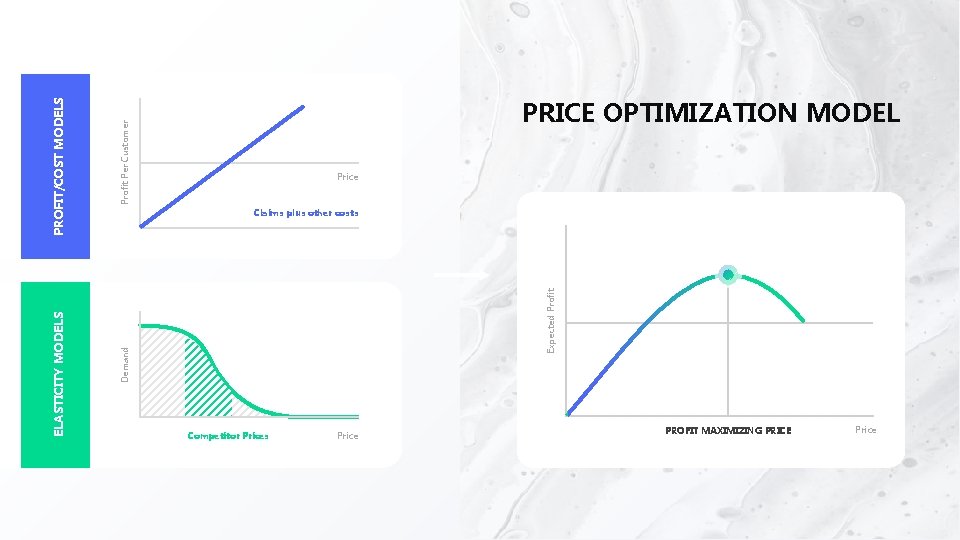
PRICE OPTIMIZATION MODEL Price optimization modeling allows the organization to use pricing as a powerful profit lever. This can be used to tailor pricing for customer segments by simulating how targeted CHALLENGES • Predicting demand for items never sold before • Estimating lost sales CHALLENGES Structure of demand forecast • • Maximize expected revenue from new Demand of each style is dependent on price of competing styles exponential # variables products TECHNIQUES • Clustering • Machine learning models for regression TECHNIQUES • Novel reformulation of price optimization problem • Creation of efficient algorithm to solve daily PRICE OPTIMIZATION DEMAND FORECASTING customers will respond to price changes with data-driven scenarios.
Profit Per Customer Price Expected Profit Claims plus other costs Demand PROFIT/COST MODELS ELASTICITY MODELS PRICE OPTIMIZATION MODEL Competitor Prices Price PROFIT MAXIMIZING PRICE Price
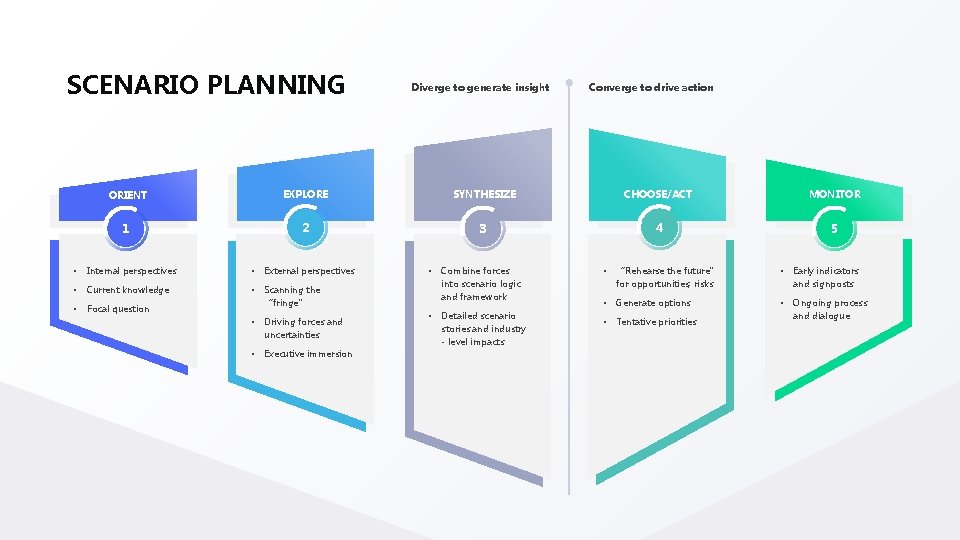
SCENARIO PLANNING Diverge to generate insight Converge to drive action ORIENT EXPLORE SYNTHESIZE CHOOSE/ACT MONITOR 1 2 3 4 5 • Internal perspectives • External perspectives • Current knowledge • • Focal question Scanning the “fringe” • Driving forces and uncertainties • Executive immersion • Combine forces into scenario logic and framework • Detailed scenario stories and industry - level impacts • “Rehearse the future” for opportunities, risks • Early indicators and signposts • Generate options • • Tentative priorities Ongoing process and dialogue
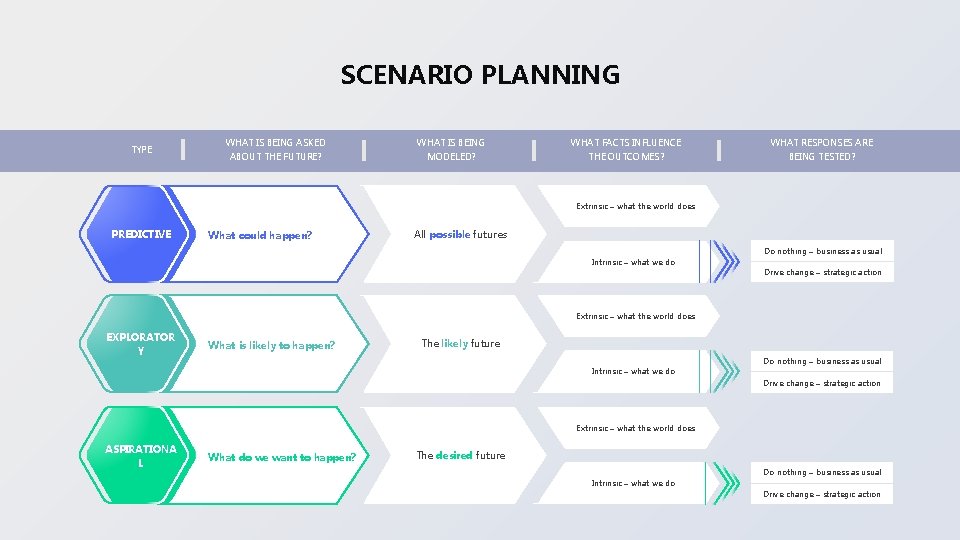
SCENARIO PLANNING TYPE WHAT IS BEING ASKED WHAT IS BEING WHAT FACTS INFLUENCE WHAT RESPONSES ARE ABOUT THE FUTURE? MODELED? THE OUTCOMES? BEING TESTED? Extrinsic – what the world does PREDICTIVE What could happen? All possible futures Do nothing – business as usual Intrinsic – what we do Drive change – strategic action Extrinsic – what the world does EXPLORATOR Y What is likely to happen? The likely future Intrinsic – what we do Do nothing – business as usual Drive change – strategic action Extrinsic – what the world does ASPIRATIONA L What do we want to happen? The desired future Do nothing – business as usual Intrinsic – what we do Drive change – strategic action
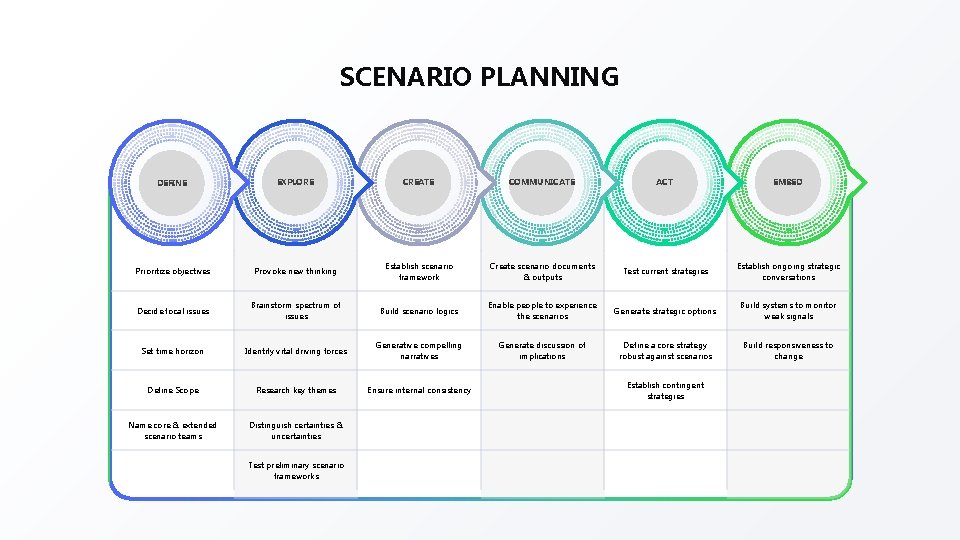
SCENARIO PLANNING DEFINE EXPLORE CREATE COMMUNICATE ACT EMBED Prioritize objectives Provoke new thinking Establish scenario framework Create scenario documents & outputs Test current strategies Establish ongoing strategic conversations Decide focal issues Brainstorm spectrum of issues Build scenario logics Enable people to experience the scenarios Generate strategic options Build systems to monitor weak signals Set time horizon Identify vital driving forces Generative compelling narratives Generate discussion of implications Define a core strategy robust against scenarios Build responsiveness to change Define Scope Research key themes Ensure internal consistency Name core & extended scenario teams Distinguish certainties & uncertainties Test preliminary scenario frameworks Establish contingent strategies
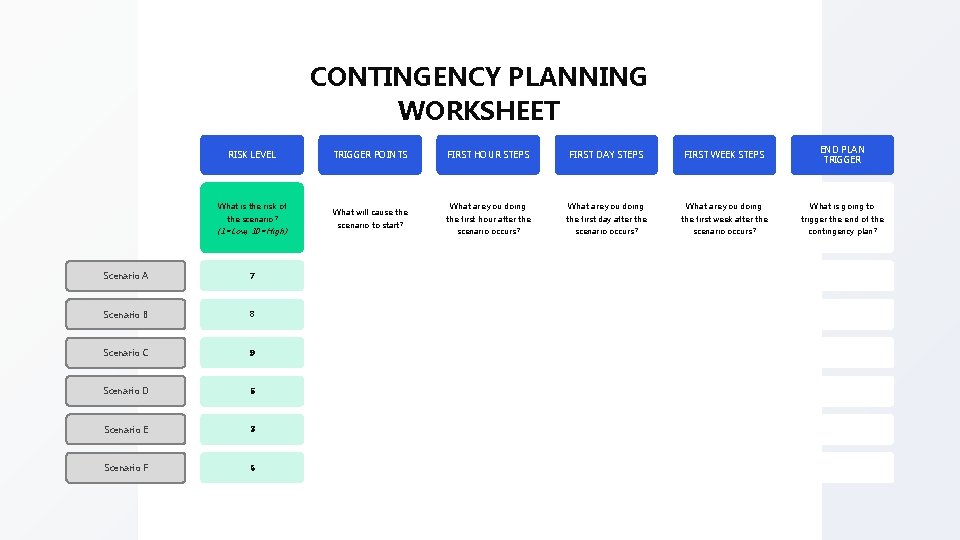
CONTINGENCY PLANNING WORKSHEET RISK LEVEL What is the risk of the scenario? (1=Low, 10=High) Scenario A 7 Scenario B 8 Scenario C 9 Scenario D 5 Scenario E 3 Scenario F 6 TRIGGER POINTS What will cause the scenario to start? FIRST HOUR STEPS FIRST DAY STEPS FIRST WEEK STEPS END PLAN TRIGGER What are you doing What is going to the first hour after the first day after the first week after the trigger the end of the scenario occurs? contingency plan?
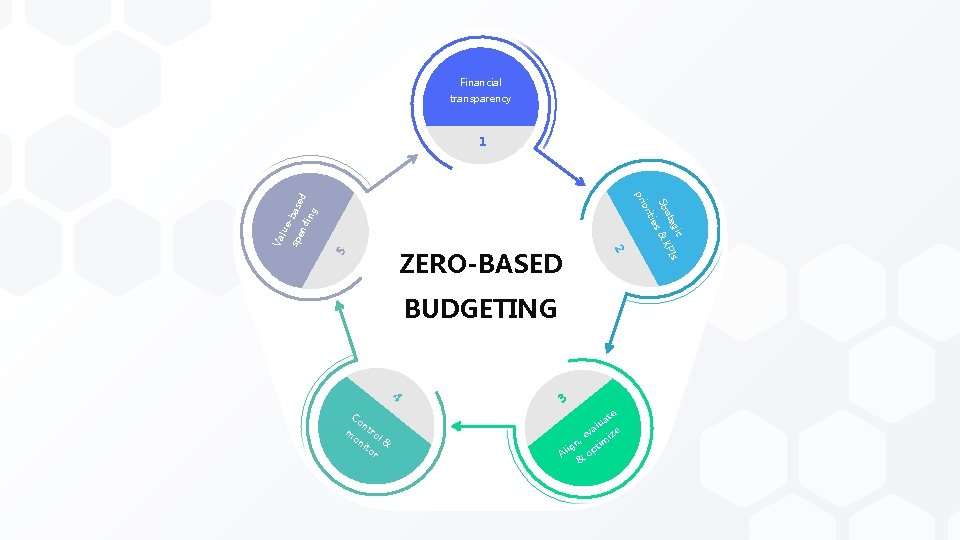
Financial transparency 1 ase din d g -b lue sp en 5 Is Co m nt ro l ito & r on KP Va s& BUDGETING 4 gic tie ate ori Str pri 2 ZERO-BASED 3 , te e va , e imiz n t ig op Al & a lu
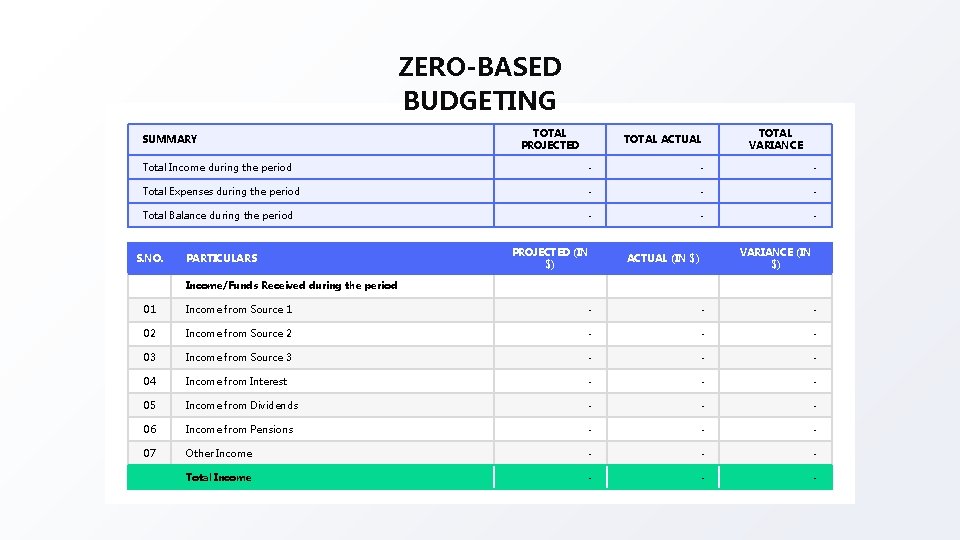
ZERO-BASED BUDGETING SUMMARY TOTAL PROJECTED TOTAL ACTUAL TOTAL VARIANCE Total Income during the period - - - Total Expenses during the period - - - Total Balance during the period - - - S. NO. PARTICULARS PROJECTED (IN $) VARIANCE (IN $) ACTUAL (IN $) Income/Funds Received during the period 01 Income from Source 1 - - - 02 Income from Source 2 - - - 03 Income from Source 3 - - - 04 Income from Interest - - - 05 Income from Dividends - - - 06 Income from Pensions - - - 07 Other Income - - - Total Income - - -