MANAGEMENT OF OBESITY IN THE CLINIC MEMS Nor

MANAGEMENT OF OBESITY IN THE CLINIC MEMS Nor Azmi Kamaruddin Committee Member CPG for the Management of Obesity 2001 -4 MOH, MASSO, MEMS, Academy of Medicine

THE OBESITY EPIDEMIC Malaysian scene

OBESITY “PERSONS WHO ARE NATURALLY FAT ARE APT TO DIE EARLIER THAN THOSE WHO ARE SLENDER” Hippocrates Father of Medicine (460 - 377 BC) Hazardous waist

ISSUES 1. Look at some factors that contribute to the increasing prevalence of obesity; where do we stand 2. The new cut-off points for BMI & WC; significant of the WC 3. Some practical approach 4. A bit on diet & exercise 5. Pharmacotherapy; guidelines & recommendations

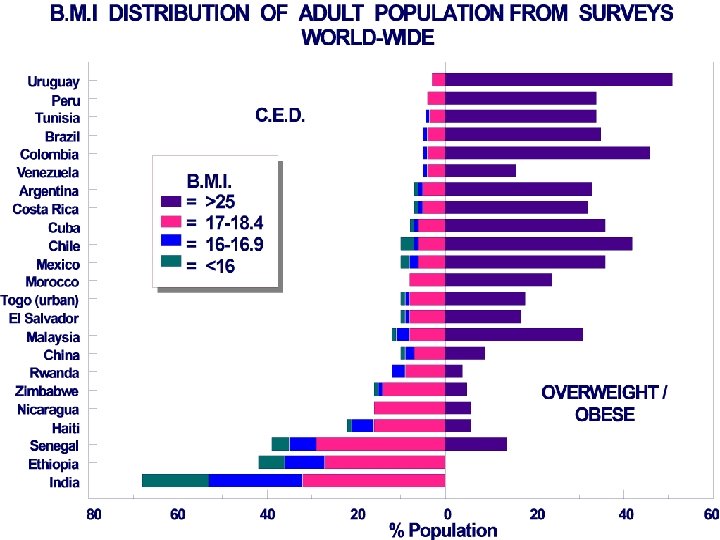
OBESITY: A MEDICAL ILLNESS Obesity is increasing in Malaysia, up to 5. 6% of adults are obese & 20. 4% overweight (NHMS II). Why is prevalence of obesity increasing? Mainly due to increase affluence, increase calorie intake and changes in life styles. Problem of cocacolonization and nintendonization of youth. As result, prevalence of obesity in children also increased esp urban areas.
 in women in some Commonwealth countries")
Overweight and obesity (%) in women in some Commonwealth countries

Overweight in Malaysia by age and ethnic background Ismail & James, 2001.
")
PREVALENCE OF OVERWEIGHT & OBESITY IN CHILDREN KUALA LUMPUR & KOTA BHARU (N=12, 521) Kuala Lumpur O/weight 18. 1% Underweight Obese 8. 5% 18. 3% At 9. 6% Kota Bharu O/weight 12. 4% Obese 5. 9% Underweight At 6. 5% 23. 4% Normal 63. 6% 64. 2% At risk overweight=85 th percentile BMI<95 th percentile Obese=BMI 95 th percentile, WHO 1995

BASELINE CHARACTERISTICS OF METABOLIC SYNDROME AMONG 100 CHILDREN 9 – 11 YEARS OLD Cases (Overweight & Obese) Control (Normal weight) P Mean BMI 26. 4 17. 6 0. 00 % Body fat 33. 5 21. 3 0. 0 8. 9 7. 33 0. 016 1907 1838 0. 00 Triglyceride 1. 2 0. 8 0. 00 Cholesterol 5. 2 5. 0 NS HDLC 1. 27 1. 47 NS LDLC 3. 4 3. 2 NS 102. 58 91. 25 NS 66. 36 60. 31 0. 00 Fat (kg) Energy Intake Systolic Blood Pressure Diastolic Fatimah Arshad

EVOLUTION & OBESITY HUNTER-GATHERER MODERN SOCIETY Thrifty gene FEAST & FAMINE MAXIMUM METABOLIC EFFICIENCY STORAGE OF FOOD FEAST • DIET: HIGH IN ANIMAL FAT & REFINED SUGAR • SEDENTARY LIFE • VISCERAL OBESITY AS FAT TO SURVIVE FAMINE PERIODS SURVIVAL OBESITY & DIABETES
 Fats (25%)")
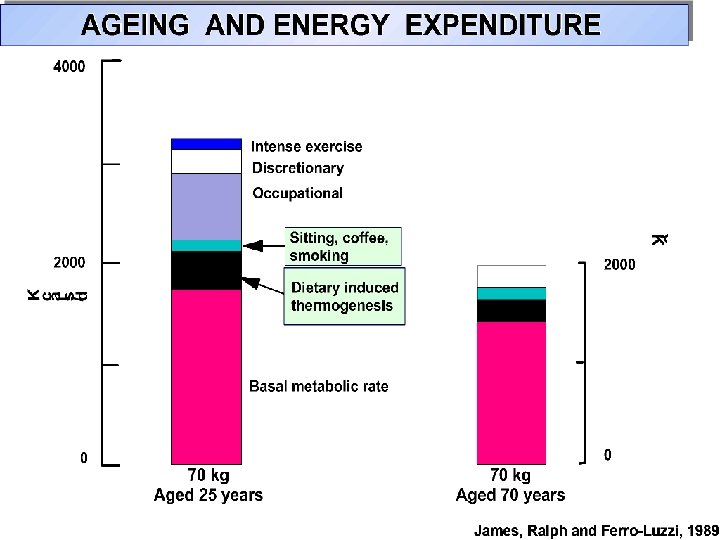
OBESITY – AN IMBALANCE IN ENERGY INTAKE AND ENERGY EXPENDITURE Proteins (20%) Fats (25%) ENERGY INTAKE Carbohydrates (55%) BMR (60 -65%) ENERGY EXPENDITURE Thermic effect of food (10%) Physical activity (25 -30%)
 1955")
STANDARD SERVES 1955 & 2001 (COURTESY OF DEPT HUMAN NUTRITION, UNIVERSITY OF OTAGO) 1955 Fries 72 g Coke 200 ml 2001 Fries 205 g Coke 950 ml
 Predominantly rural areas")
Relationship between dietary composition and Gross National Product per capita (1990) Predominantly rural areas Popkin B, 1998

“The major impact of television is not the behavior it produces, but the behavior it prevents [& prompts]” (Tucker, 1990)

SECULAR TRENDS IN DIET AND ACTIVITY IN RELATION TO OBESITY IN BRITAIN Percentage of mean for all time 180 160 Obesity Energy Intake Cars TV Viewing 140 120 100 80 60 40 1950 1960 1970 1980 1990 Prentice and Jobb (1995)
 Schoeller, DA. 1998. AJCN, 68: S")
BMI in relation to physical activity levels (PALs) Schoeller, DA. 1998. AJCN, 68: S 956 -961

RELATIONSHIP OF BMI TO EXCESS MORTALITY 300 Mortality Ratio 250 Age at Issue 20 -29 30 -39 200 150 100 Low Risk 50 0 15 20 25 30 Moderate High Risk 35 Body Mass Index Bray, 1987 40

DISEASES AND CONDITIONS FOR WHICH OBESITY IS A RISK FACTOR Coronary artery disease** Gallbladder disease*** Type II Diabetes Mellitus*** Osteoarthritis** Hypertension** Venous circulatory disease Dyslipidemia*** Increased anaesthetic risk* Respiratory disease*** Low back pain* Gout** Polycystic ovary disease* Reflux disease Cancer* Psychological problems Infertility* (ovarian, breast, endometrial, gallbladder, prostate, colon)

HEALTH RISKS ASSOCIATED WITH OBESITY
 Collection")
CLASSIFICATION OF OBESITY AS PER FAT DISTRIBUTION Android (or abdominal or central, males) Collection of fat mostly in the abdomen (above the waist) apple-shaped Associated with insulin resistance and heart disease Gynoid (below the waist, females) Collection of fat on hips and buttocks pear-shaped Associated with mechanical problems

ABDOMINAL OBESITY AND CARDIOVASCULAR RISK Dyslipidaemia Total-C • LDL-C Triglycerides Apo-B • HDL-C Hypertension Left ventricular hypertrophy Congestive heart failure Endothelial dysfunction Visceral Obesity Prothrombosis Fibrinogen PAI-1 Insulin resistance Glucose intolerance Hyperglycaemia Type 2 diabetes Renal Hyperfiltration Albuminuria Inflammatory Response

WAIST CIRCUMFERENCE IS A SURROGATE MARKER OF VISCERAL FAT Women Men cm >88 cm = Increased risk 1 >102 cm = Increased risk 1 Asian = 80 cm Asian = 90 cm 1 Lean MEJ, et al. Lancet; 1998: 351: 853– 6

WAIST CIRCUMFERENCE & WAIST-TOHIP RATIO Ratio = Waist Circumference diameter of the waist at the ASIS Risk increases if waist circumference is >90 cm in men and >80 cm in women WAIST HIPS TO FIND RATIO Waist: Measure at narrowest point with stomach relaxed Hips: Measure at fullest point Desired Ratio Women : <0. 8 Men : < 1. 0
/height(m)2 WHO Classification BMI Risk of Comorbidity Underweight")
WHO CLASSIFICATION OF OBESITY BMI = weight(kg)/height(m)2 WHO Classification BMI Risk of Comorbidity Underweight Below 18. 5 Low Healthy weight 18. 5 -24. 9 Average Overweight (grade 1 obesity) 25. 0 -29. 9 Mild increase Obese (grade 2 obesity) 30. 0 -39. 0 Moderate/severe Morbid/severe obesity(grade 3) 40. 0 and above Very severe World Health Organisation. Obesity: Preventing and Managing the Global Epidemic. Geneva: WHO, 1997 [3]

BMI Issues Are population specific BMI cut-off points for overweight and obesity necessary? Recent studies in Hong Kong, Singapore, Indonesia and Japan suggested that these populations have a relatively high body fat % at low BMI Meta-analysis in Asian populations revealed: - Caucasian prediction equation cannot be applied to all Asian populations. - In general, both male and female Asians have more body fat then their European counterparts of the same age and BMI. - Calculated BMI cut-off points vary considerably from (21. 6 – 25. 9) for overweight and from (26. 3 - 30. 8) for obesity WHO Consultation, July 2002.

PROPORTION OF SINGAPOREAN ADULTS WITH AT LEAST ONE RISK FACTOR BY BODY MASS INDEX (BMI) CATEGORIES
")
PROPORTION OF SINGAPOREAN ADULTS WITH AT LEAST ONE RISK FACTOR BY WAIST CIRCUMFERENCE (WC) CATEGORIES

BARRIERS TO EFFECTIVE WEIGHT MANAGEMENT Easier to treat effects of obesity Time Constraint Resources & Manpower Patients’ Attitude & Expectations Caregiver Frustration Patient’s Frustration Chronic problem

"Give it up Linda. You know he'll never change. He'll always eat nothing but meat until his first heart attack. "

MANAGEMENT STRATEGY FOR OBESITY

MULTI-DISCIPLINE APPROACH TO WEIGHT MANAGEMENT Behavioural & Motivational Therapist Dietician Patient/Peer Support Group Patient Physical Therapist Endocrine/Bariatric Surgeon Endocrinologist Primary Physician

HOW MUCH WEIGHT LOSS IS SIGNIFICANT? A 5 -10% reduction in weight (within 6 months) and weight maintenance should be stressed in any weight loss program and contributes significantly to decreased morbidity

BENEFITS OF 10% WEIGHT LOSS Mortality >20% fall in total mortality >30% fall in diabetes related deaths >40% fall in obesity related deaths Blood pressure fall of 10 mm. Hg systolic and diastolic pressure Diabetes 50% fall in fasting glucose Lipids 10% dec. total cholesterol 15% dec. in LDL 30% dec. in triglycerides 8% inc. in HDL Jung 1997
 associated")
ADVANTAGES OF WEIGHT LOSS Weight loss of 0. 5 -9 kg (n=43, 457) associated with 53% reduction in cancer-deaths, 44% reduction in diabetes-associated mortality and 20% reduction in total mortality Survival increased 3 -4 months for every kilogram of weight loss Reduced hyperlipidemia, hypertension and insulin resistance Improvement in severity of diseases Person feels ‘fit’ and mentally more active

TREATMENT GOALS Prevention of further weight gain Weight loss to achieve a realistic, target BMI Long-term maintenance of a lower body-weight

APPROACHES TO OBESITY MANAGEMENT Diet Activity Drugs VLCD Surgery BMI >35 BMI>40 BMI 23 -27. 5 No risk factors _ DM/CHD/HT/HL No risk factors (consider) DM/CHD/HT/HL BMI 27. 5– 30 BMI > 30 No risk factors (in (consider DM/CHD/HT/HL severe) in severe)

MANAGEMENT OF OBESITY IN THE CLINIC 1. History Aetiological factors Co-Morbidities Complications 2. Physical Examination Aetiological factors Co-Morbidities Complications 3. Laboratory Investigations 4. Treatment 5. Follow-up

HISTORY Aetiological factors Age of onset Duration of obesity Psychological Depression, Stress Endocrine & Metabolic Syndrome Cushing’s, Hypothyroid Genetic Lawrence Moon Biedl, Prader Willi Neurological Hypothalamic Steroid-Containing Traditional Treatment

SECONDARY CAUSES OF OBESITY Endocrine 1. Hypothyroidism 2. Polycystic Ovarian Syndrome 3. Cushing’s Syndrome 4. Acromegaly 5. Hypothalamic disorders 6. Hypogonadism e. g. Klinefelter’s syndrome and Kallman’s syndrome Genetic 1. Intracranial tumours, infections and trauma such as Craniopharyngioma 2. Prader-Willi Syndrome 3. Ainstrom Syndrome 4. Laurence-Moon Biedl Syndrome 5. Carpenter Syndrome 6. Cohen Syndrome 7. Blount disease and others.

THE GENETIC DISEASES ASSOCIATED WITH OBESITY The Prader-Willi syndrome consists of short stature, mental retardation, cryptorchidism, small hands and feet, neonatal hypotonia, and obesity. The face is also characteristic, with almond-shaped eyes and fish-like mouth. The disorder is associated with a deletion in the 15 th chromosome. The Aistrom syndrome is manifested by childhood blindness related to retinal degeneration, infantile obesity, nerve deafhess, type 2 diabetes mellitus, acanthosis nigricans, chronic nephropathy, and hypogonadism in males. The Laurence-Moon-Biedl syndrome exhibit retinitis pigmentosa, mental retardation, obesity, polydactyly, and hypogonadism. The Carpenter syndrome is characterised by obesity, mental retardation, male hypogonadism, polydactyly, and syndactyly. Cohen syndrome patients have microcephaly, mental retardation, short stature, facial abnormalities, and obesity. Blount disease consists of bowed legs, tibial torsion, and obesity.

EATING HABITS & BEHAVIOUR Eating Habits Frequency of Meals Amount Which meal is heaviest ? Types of Foods Way food is prepared In between meals snacks Eating Behaviour Watching TV Eating Out Fast Food Outlets Food Diary Eating the wrong food vs just eating a lot at a time.

EXERCISE Do you do any exercise ? Do you do any physical activities ? Level, Duration & Frequency ?

PSYCHOLOGICAL ASSESSMENT Are you going through a period of life where you are stressful ? Anxious ? Tensed ? Do you feel down ( depressed ) ? Do you feel they are contributing to your weight or eating problem? Boils down to either Stress Or Depression.

MOTIVATION Do you see yourself as having a problem? Do you want to do something about this problem? Relationship of obesity to physical & emotional health. If patient is not motivated no amount of dieting or pills will alleviate the weight problem. Once patient is willing to do something about their weight then only will your management be helpful.

NOCTURNAL EATING DISORDER Features Breakfast Satiety More than 50 % total calories after dinner Wake at least once Higher rate of depression May need SSRI anti-depressant

PHYSICAL EXAMINATION BMI Waist Circumference BP Signs of Genetic, Endocrine or Metabolic Diseases - Metabolic Syndrome - Cushing’s Syndrome - Hypopthyroidism Co-morbidities & Complications - BP, DM - Hyperlipidemia - Cardiac Failure - Sleep Apnoea Syndrome - Arthritis

BASELINE INVESTIGATIONS Fasting Serum Lipids Fasting Blood Glucose OGTT if FBG is bet 6. 1 – 6. 9 mmol/l If indicated; 24 hour urinary cortisol TFT esp in the above 60 yrs old Investigations for PCOS

BASIC PRICINPLES OF THERAPY THAT CAN BE IMPLEMENTED IN THE CLINIC Basic Dietary Principles Do not skip meals Heavy Breakfast, Light Dinner Drink lots of water Increase Fruits & Vegetables Reduce oily foods Eat Slowly Choose favourite food with low calories Physical Activities Avoid lifts for few floors Walk to the grocery shops etc Cycle with families

BASIC PRICINPLES OF THERAPY THAT CAN BE IMPLEMENTED IN THE CLINIC 2 Exercises Choose favourite sport with friends Behavioral Changes Reduce eating out Do not eat in front of TV Snacking while watching sports Conscious of what goes in the mouth Pharmacotherapy Lipase Inhibitor Appetite Suppressant Duration Surgery Assess Success
 Measure Weight, BMI & WC Assess Comorbidities Assess understanding")
ASSESSMENT IN THE CLINIC (7) Measure Weight, BMI & WC Assess Comorbidities Assess understanding & perception • Do you feel you have a weight problem? Assess Motivation • Most important of all Quick Dietary History • Binge vs Fat (Quantity vs Quality) Quick Daily Activity History Assess underlying psychological issues • Relieve stress, Nocturnal Binge Disorder

MANAGEMENT PLAN IN THE CLINIC Five dietary advice • Regular meals – Do not skip meals • Frequent small meals • Heavy breakfast, light dinner • Cut Carbos & Fat (Diet drinks, sweeteners etc) • Lots of Vegetables & Fruits Simple physical activity recommendations Return appointment & assess compliance On Return; Prescribe short term pharmacotherapy Assess every 1 -2 months Revise management plans

FOOD PYRAMID Use fats, alcohol, sugar and salt sparingly Have small serves of protein foods with preference for low fat variety Choose wide variety of fruits and vegetables Use these foods as basis of every meal

Does Coke make you fat ? Sugar versus sweetener Astrup et al. , NAASO 2001, Quebec.

European Multi-center RCT: complex versus sugar carbohydrates As produced by Astrup, A. 2001.

Long-term weight maintenance on different diets. VLCD Average Hypocaloric balanced Anderson et al. Am J Clin Nutr, 2001; 74: 579 -584.


Time needed for activity to achieve energy balance MET 3. 0 MET 3. 3 MET 5. 0 MET 12. 5 Erlichman, Kerbey & James, 2001. Whistler Conference, Vancouver.

PHYSICAL ACTIVITY ISSUES How much physical activity is enough to prevent unhealthy weight gain? Current guidelines of 30 minutes of moderate activity daily is important for limiting health risks to chronic diseases For preventing weight gain or regain, compelling evidence suggest a 60 -90 minutes of moderate activity To prevent a transition to overweight and obesity, a PAL of 1. 7 or approximately 45 -60 minutes per day of moderate activity is needed. For children even more activity time is recommended Stock Conference, March 2002
 Serotonergic")
DRUG THERAPY Appetite suppressants Adrenergic agents (e. g. amphetamine, methamphetamine, phenylpropanol amine, phentermine) Serotonergic agents (e. g. fenfluramine, dexfenfluramine, SSRIs like sertraline, fluoxetine) Thermogenic agents ephedrine, caffeine New ones Sibutramine ; Orlistat

ORLISTAT – MECHANISM OF ACTION Intestinal lumen Mucosal cell Lymphatics TG GI lipase + Xenical® FA FFA MG MG Bile acids Micelle 30% not absorbed
 – 2 Placebo (n=340) Orlistat")
ORLISTAT-INDUCED WEIGHT LOSS Change in 0 body weight (%) – 2 Placebo (n=340) Orlistat 120 mg (n=343) *p<0. 001 – 4 – 6. 1% – 8 * – 10. 2% – 12 – 4 0 10 20 Week 30 (Sjöström L, et al. Lancet 1998, 352; 167 172) 40 52 ITT population: BM 14119 C
 Placebo")
WEIGHT LOSS IN THE PRIMARY CARE SETTING Change in 0 body weight (%) Placebo (n=212) Orlistat 120 mg (n=210) – 2 *p<0. 001 – 4. 2% – 6 * – 8 – 7. 9% – 10 – 4 0 4 8 12 16 20 24 28 32 36 40 44 48 52 Week ITT population: BM 14161
 –")
CHANGE IN BODY WEIGHT OVER 2 YEARS Change in 0 body weight (%) – 2 Placebo Orlistat 60 mg Orlistat 120 mg *p<0. 01 – 4 – 6 * * – 8 – 10 – 4 0 10 20 30 40 52 Week 60 70 80 90 100104 ITT population: NM 14185

SIBUTRAMINE INHIBITS SEROTONIN AND NORADRENALINE REUPTAKE Noradrenaline Serotonin
 STORM STUDY : EFFECT OF SIBUTRAMINE ON WEIGHT LOSS 104 102 100")
Bodyweight (kg) STORM STUDY : EFFECT OF SIBUTRAMINE ON WEIGHT LOSS 104 102 100 98 96 94 92 90 Placebo Sibutramine 0 2 4 Weight loss 6 8 10 12 14 16 18 20 22 24 Month Weight maintenance Lancet 2000; 356: 2119 -2125
 STORM STUDY: MEAN WEIGHT LOSS AT TWO YEARS")
Mean Weight Loss (Kg) STORM STUDY: MEAN WEIGHT LOSS AT TWO YEARS

STORM STUDY : PROPORTION OF PATIENTS MAINTAINING AT LEAST 5% AND 10% WEIGHT LOSS Proportion of patients (%) 5% responders 10% responders Sibutramine Placebo 100 80 60 40 20 0 6 12 18 24 Lancet 2000; 356: 2119 -2125
 Waist/Hip Ratio Change Decrease")
STORM STUDY: EFFECT ON WAIST CIRCUMFERENCE AND WAIST/HIP RATIO (b) Waist/Hip Ratio Change Decrease in waist circumference (cm) (a) Waist Circumference

STORM STUDY : EFFECTS ON LIPIDS 5 0 -5 -10 -15 -20 -25 VLDL cholesterol Placebo % change Triglycerides Sibutramine 0 6 12 18 24 5 0 -5 -10 -15 -20 -25 Placebo Sibutramine 0 6 12 18 24 Lancet 2000; 356: 2119 -2125
 HDL cholesterol % change 30 25")
STORM STUDY : EFFECTS ON LIPIDS (CONTD. ) HDL cholesterol % change 30 25 Sibutramine 20 15 Placebo 10 5 0 0 6 12 18 24 Month of assessment Weight loss Weight maintenanc e Lancet 2000; 356: 2119 -2125

STORM STUDY : EFFECT ON INSULIN AND HBA 1 C Insulin Placebo. e Si bu tra m in Month of Assessment % Change Hb. A 1 c Placebo min a Sibutr e Month of Assessment Lancet 2000; 356: 2119 -2125

STORM STUDY: OTHER METABOLIC EFFECTS Variable Baseline SIB PLAC Month 6 SIB PLAC Month 24 SIB PLAC Uric acid 0. 32 0. 33 0. 29 0. 30 0. 32 Glucose 5. 20 5. 11 5. 07 5. 01 5. 13 5. 17 Insulin 17. 7 16. 7 12. 7 13. 8 16. 2 12. 4 C-peptide 3. 21 3. 05 2. 54 2. 46 2. 38 2. 69 Hb. A 1 c 5. 86 5. 75 5. 56 5. 50 5. 56 5. 66

STORM STUDY: CONCLUSIONS Almost all patients who persist with a weight management program consisting of sibutramine, diet and exercse can achieve at least a 5% weight loss with sibutramine Over half can lose more than 10% weight within 6 months Weight loss was sustained in most patients continuing therapy for two years
 Sibutramine 10 mg 0 -0. 5 -1 -1.")
SIBUTRAMINE VS. DEXFENFLURAMINE Weight loss (kg) Sibutramine 10 mg 0 -0. 5 -1 -1. 5 -2 -2. 5 -3 -3. 5 -4 -4. 5 -5 Dexfenfluramine 30 mg -3. 2 -4. 5 n=226; 12 wks Int J Obes 1995; 19. Suppl 2: 144

ADVERSE EFFECTS OCCURRING IN >5% OF PATIENTS TREATED WITH SIBUTRAMINE COMPARED WITH PLACEBO Sibutramine % Placebo % Adverse Effects Incidence (n=2068) Incidence (n=884) Headache 30. 3 18. 6 Dry Mouth 17. 2 4. 2 Anorexia 13. 0 3. 5 Constipation 11. 5 6. 0 Insomnia 10. 7 4. 5 Dizziness 7. 0 3. 4 Nausea 5. 9 2. 8 Nervousness 5. 2 2. 9 Dyspepsia 5. 0 2. 6 Ann Pharmacother 1999; 33: 968 -978

SIBUTRAMINE: SAFETY Discontinuation rates: 9% with placebo and 7% with sibutramine Has been associated with a mean increase in BP and heart rate of approximately 1 -3 mm. Hg and 4 -5 beats/min Cardiac side effects viz. hypertension, tachycardia and palpitations < 2. 6% vs 0. 6 -0. 9% in placebo group Caution to be exercised in patients with history of hypertension and should not be given to patients with uncontrolled or poorly controlled hypertension Not associated with cardiac valve abnormalities or primary pulmonary hypertension

STORM STUDY : WITHDRAWALS DUE TO BP INCREASE Dose of Sibutramine % patients who withdrew due to increase in BP 10 mg 1% 15 mg 2% 20 mg 3% Lancet 2000; 356: 2119 -2125

INDICATIONS & DOSAGE Recommended for obese patients with a BMI > 30 kg/m 2 or > 27 kg/m 2 in the presence of other risk factors (e. g. hypertension, diabetes, dyslipidemia) In Asian patients, sibutramine could be considered in patients with BMI > 27. 5 kg/m 2 or those with BMI of 23 kg/m 2 with 2 comorbid conditions Recommended starting dose is 10 mg once daily. If there is inadequate weight loss, the dose may be titrated after four weeks to a total of 15 mg once daily. The 5 mg dose should be reserved for patients who do not tolerate the 10 mg dose.

MALAYSIAN RECOMMENDATIONS Indications for anti-obesity drugs u BMI > 27. 5 kg/m 2 u BMI > 25 plus 2 CVS Risk Factors Drugs should never be used alone. Drugs should be used in combination with diet, exercise, and behavior modification. Drugs may have role in weight maintenance. “Malaysian CPG for The Management of Obesity 2004”

M’SIAN CPG ON MANAGEMENT OF OBESITY SUMMARY OF RECOMMENDATIONS The BMI should be used to classify overweight and obesity and to estimate relative risk for disease compared to normal weight (Evidence Level B) The waist circumference should be used to assess abdominal fat content (Evidence Level B). Based on current evidence in adults, overweight is defined as BMI > 23 kg/m 2 and obesity as BMI > 27. 5 kg/m 2 (Evidence Level C) Current evidence suggests that waist circumference of > 90 cm in men and > 80 cm in women is associated with increased risk of comorbidities (Evidence Level C). In overweight & obese individuals, weight loss is recommended to(Evidence Level B): Lower elevated blood pressure Lower elevated levels of total cholesterol, low-density lipoprotein cholesterol and triglycerides Raise low levels of high-density lipoprotein cholesterol Lower elevated blood glucose levels


WHO APRIL 2001 “Obesity cannot be prevented or managed solely by governments (or health professionals). The food industry, international agencies, the media, communities and individuals need to work together so that the environment is less conducive to weight gain”
- Slides: 87