Maintenance Sheet DUE FRIDAY I can graph proportional


- Slides: 13
Maintenance Sheet DUE FRIDAY
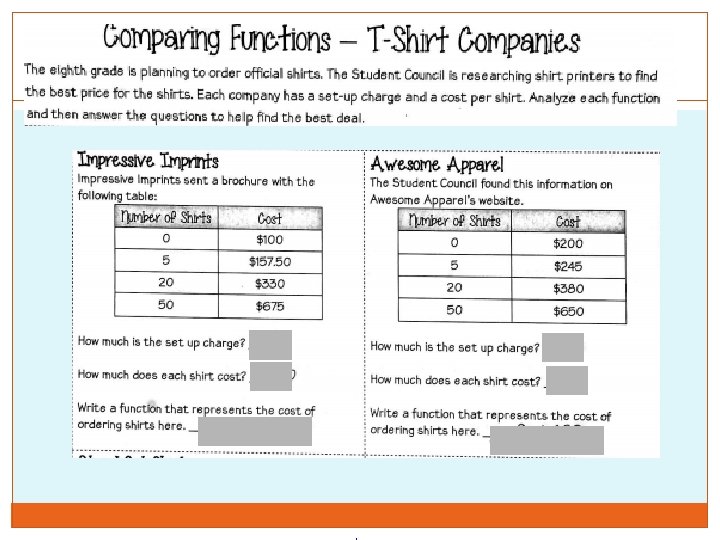
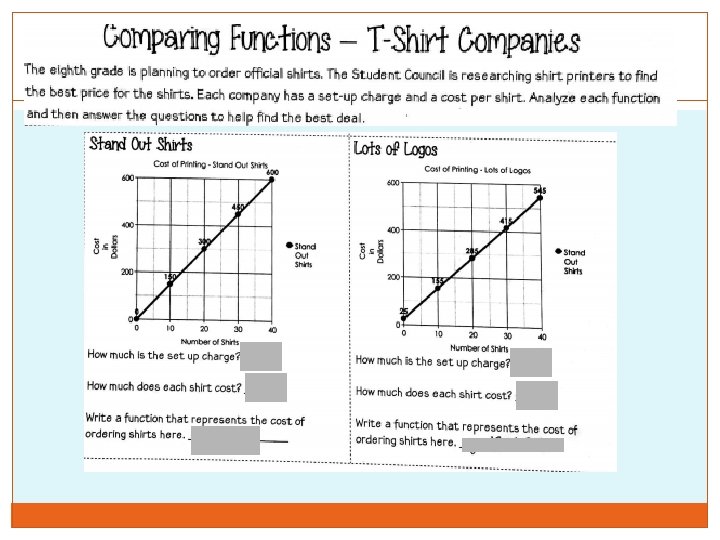
I can graph proportional relationships and interpret the unit rate as the slope. I can compare two different proportional relationships given different representations
I can graph proportional relationships and interpret the unit rate as the slope. I can compare two different proportional relationships given different representations
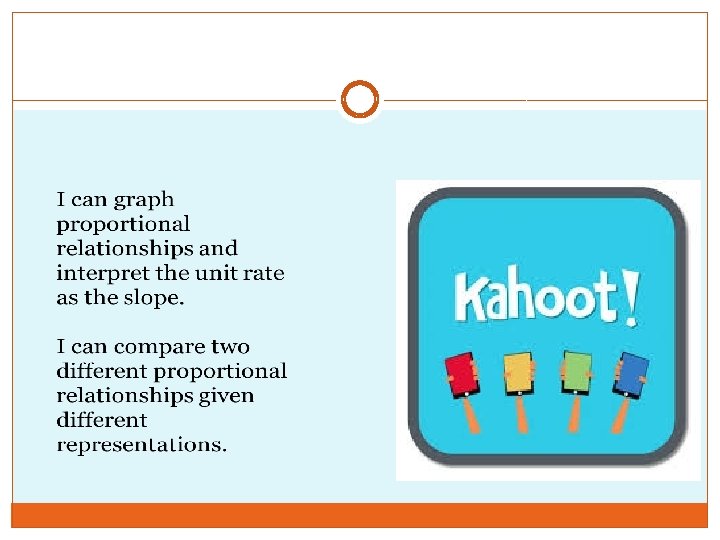
I can graph proportional relationships and interpret the unit rate as the slope. I can compare two different proportional relationships given different representations.
I can graph proportional relationships and interpret the unit rate as the slope. I can compare two different proportional relationships given different representations.
I can graph proportional relationships and interpret the unit rate as the slope. I can compare two different proportional relationships given different representations.
�When comparing functions, make sure each function is represented in a common representation Table/Table X- 0 1 2 3 1 �Function 1: y = 2 x + 2 �Function 2: Y 0 2 4 6 8 X Y -1 0 1 -4 -2 0 2 2 3 4 Function 1 has a greater rate of change
�When comparing functions, make sure each function is represented in a common representation Rate of Change (slope) *use an equation �Function 1: y = 2 x + 2 �Function 2: Function 2 has a greater rate of change Y = 3 x-2 X Y -1 0 1 -5 -2 1 2 4 3 7
�When comparing functions, make sure each function is represented in a common representation Graphs �Function 1: y = 2 x + 2 Function 1 has a greater rate of change, bc its slope is steeper (moves up faster/closer to the y- axis Function 1
I can graph proportional relationships and interpret the unit rate as the slope. I can compare two different proportional relationships given different representations.