Main Points of Darwins Theory of Natural Selection


 Single gene trait: controlled by single gene with two alleles ♦")
 Polygenic trait: controlled by 2 or more genes, each with 2 or more")


 Key Directional Selection Food becomes scarce. Low mortality, high fitness")


 Disruptive Selection Low mortality, high fitness High mortality, low fitness")

 Macroevolution • the formation of new species between organisms")


- Slides: 42
Main Points of Darwin’s Theory of Natural Selection 1. Over production. Most organisms produce more offspring than can survive. 2. Competition. Organisms compete for food and resources. 3. Variation. There is variation among individuals of a species. 4. Adaptation. Individuals with traits best suited to the environment will survive.
Population Evolution Population genetics genetic principles as they apply to entire populations of organisms Population group of organisms of the same species living in the same area Genotype the representation on the gene of an organism Phenotype the physical trait shown by a genotype Allele different form of a gene Gene pool combined genetic info. for all members of a population
Population Genetics • Natural selection acts on individuals phenotypes not genotypes. • Populations evolve – Individual’s genes will stay the same – Population’s gene pool may change
Population Genetics • Which trait was a better adaptation and selected for? • How were frequencies of different alleles affected?
How Gene Frequencies Change Sources of Variation • Ways that new adaptations and gene frequencies arise – S – sexual reproduction – C – crossing over during meiosis (recombination of genes) – A – arrangement of chromosomes (alleles) during meiosis – M – mutations of DNA
Other Factors Can Affect Genetic Variation In A Population • Other factors that increase variation in the genetic material (gene pool) of a population on which natural selection acts: – Random/nonrandom mating = sexual selection – Gene traits-single/polygenic – Isolation – Genetic Drift – Fitness is the relative ability of genotypes to survive and reproduce
Gene Traits: A) Single gene trait: controlled by single gene with two alleles ♦ Examples: widow’s peak, hitchhiker’s thumb, tongue rolling
B) Polygenic trait: controlled by 2 or more genes, each with 2 or more alleles ♦ Examples: height, hair color, skin color, eye color Most human traits are polygenic. This type of variation cause different types of selection of one phenotype over others
Do the following graphs show the distribution of phenotypes for single-gene or polygenic traits? Explain. type: single gene type: polygenic why? Only two phenotypes possible why? Multiple (many) phenotypes possible Example: tongue roller or non-tongue roller Example: height range 4 feet to 9 feet all
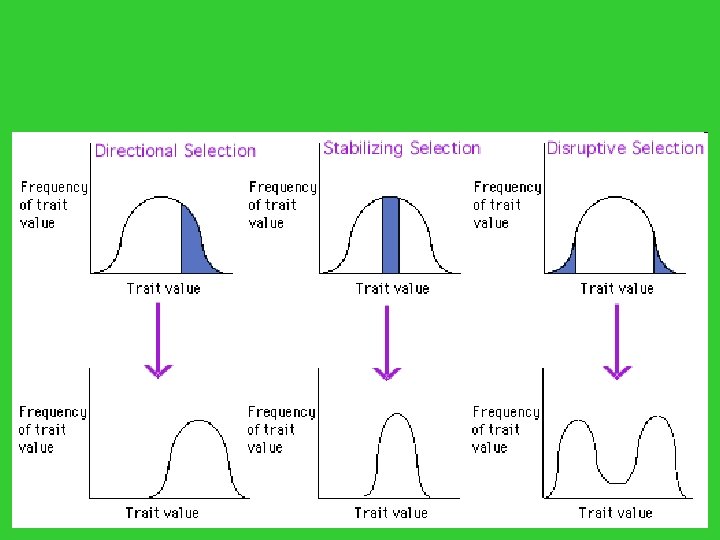
Directional, Disruptive, and Stabilizing Selection • Three modes of selection: – Directional selection favors individuals at one end of the phenotypic range – Disruptive selection favors individuals at both extremes of the phenotypic range – Stabilizing selection favors intermediate variants and acts against extreme phenotypes © 2011 Pearson Education, Inc.
a. Directional Selection: individuals at one end of the curve have higher fitness so evolution causes increase in individuals with that trait Key Food becomes scarce. Low mortality, High high fitness mortality, low fitness ♦ Individuals with highest fitness: those at one end of the curve ♦ Example: Galapagos finches – beak size
Directional Selection (page 398) Key Directional Selection Food becomes scarce. Low mortality, high fitness High mortality, low fitness
b. Stabilizing Selection: individuals at the center of the curve have highest fitness; evolution keeps center in the same position but narrows the curve Stabilizing Selection Individuals with highest fitness: near the center of the curve (average phenotype) Example: human Percentage of Population Key Low mortality, High high fitness mortality, low fitness Birth Weight Selection against both extremes keep curve narrow and in same place.
Stabilizing Selection Key Low mortality, high fitness Percentage of Population High mortality, low fitness Birth Weight Selection against both extremes keep curve narrow and in same place.
c. Disruptive Selection: individuals at both ends of the curve survive better than the middle of the curve. Disruptive Selection Largest and smallest seeds become more common. High mortality, low fitness Population splits into two subgroups specializing in different seeds. Beak Size Number of Birds in Population Low mortality, high fitness Number of Birds in Population ♦ Individuals with highest fitness: both ends of curve Key Beak Size ♦ Example: birds where seeds are either large or small
Disruptive Selection (pg 399) Disruptive Selection Low mortality, high fitness High mortality, low fitness Population splits into two subgroups specializing in different seeds. Beak Size Number of Birds in Population Key Number of Birds in Population Largest and smallest seeds become more common. Beak Size
ORGIN OF SPECIES What is a Species? A Group of interbreeding organisms that can produce fertile offspring.
The Origin of Species (Macroevolution) Macroevolution • the formation of new species between organisms (speciation) and accompanying events Microevolution • refers to changes in allele frequencies in a gene pool from generation to generation. Represents a gradual change in a population.
• Macroevolution Microevolution
How Do New Species Form? Speciation- formation of a new species Causes of Speciation: 1. Geographic Isolation 2. Temporal Isolation 3. Behavioral Isolation 4. Ecological Isolation
Geographic Isolation • Physical separation of members of a population (by formation of a canyon, mountain, river, etc. ) – Leads to different adaptations on each side of barrier, and eventually new species (allopatric speciation)
Modes of Geographic Isolation Allopatric speciation describes speciation that takes place in populations with geographically separate ranges. Gene flow is interrupted and new species evolve. Sympatric speciation describes speciation that takes place in geographically overlapping populations.
Geographic Isolation = New Species: An Example
Temporal Isolation • Species isolated because they reproduce in different seasons or times of day • Prevents species from ever breeding together – keeps two species separate but usually arises after species have formed.
Behavioral Isolation • Species Differ In Their Mating Rituals (e. g. different bird songs, mating colors, dances, pheromones, etc. )
Ecological Isolation – Species inhabit the same area, but different habitats, so they don’t encounter each other
Microevolution refers to changes in allele frequencies in a gene pool from generation to generation. Represents a gradual change in a population. Causes of microevolution: 1) Genetic drift 2) Natural selection 3) Gene flow (migration of genes from one population to another) 2) Mutation
GENETIC DRIFT DNA frequency in a population changes simply by CHANCE not fitness
Types of Genetic Drift 1. Founder’s Effect 2. Bottleneck Effect some individuals of a population colonize a new habitat few survivors are left to reproduce
FOUNDER'S EFFECT: some individuals of a population colonize a new habitat ex: Columbus bringing organisms to USA Spain: DNA Frequency 66% pink 33% red S. America: DNA Frequency 25% pink 75% red
Bottleneck Effect: Small representation of the original population after a catastrophic event. Alleles in gene pool are not equally represented and species may evolve.
HOW DOES GENETIC DRIFT AFFECT THE DIVERSITY OF A POPULATION OVER TIME?
Genetic drift decreases diversity. In this case yellow and pink DNA are gone, and red DNA is now the majority. Genetic drift = decrease in DNA diversity
How quickly do new species form?
Gradualism Many transitional forms between common ancestor and modern organisms Punctuated Equilibrium Sudden shifts in form from an ancestor to newer organism, so not many transitional forms between common ancestor and modern organisms
Phylogeny • Study of evolutionary relationships among organisms; Phylogenetic Tree- A diagram of how organisms are related based on the nucleotide sequences in the DNA.
Patterns of Evolution • Convergent Evolution • Divergent Evolution – Adaptive Radiation – Artificial Selection • Coevolution
Convergent Evolution • Organisms appear similar, because of similar habitat and selection pressure. These organisms aren’t closely related • Why? – Similar environments select for similar traits
Divergent Evolution • accumulation of differences between groups which can lead to the formation of new species; evolving from a common ancestor • Related populations or species become less and less alike
A Second Type Of Divergent Evolution • Artificial Selection – Humans, rather than nature, select traits
Coevolution • Two or more species in close association w/one another change together – Predator/Prey – Parasite/Host – Plant/Pollinator