
Main achievement outcomes continued n n n Performance
- Slides: 38
Main achievement outcomes continued. . n n n Performance on mathematics and reading (minor domains) in PISA 2006, including performance by gender Performance across domains in PISA 2006 Trends in performance in Ireland across OECD countries (2000 -2006 1
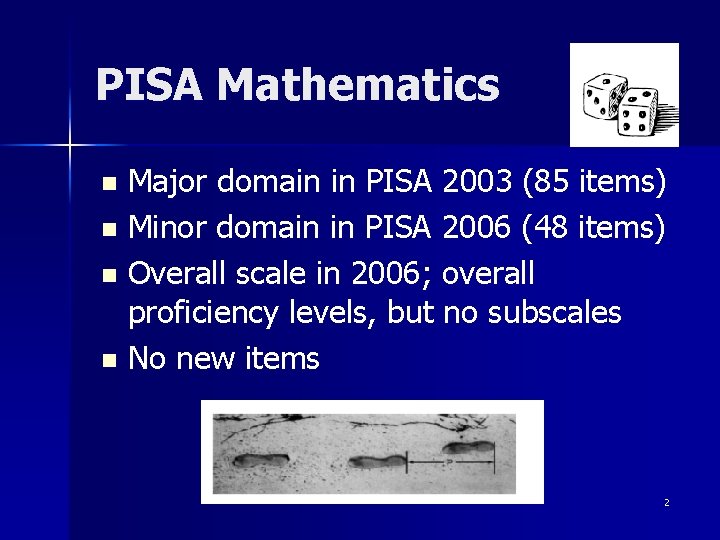
PISA Mathematics Major domain in PISA 2003 (85 items) n Minor domain in PISA 2006 (48 items) n Overall scale in 2006; overall proficiency levels, but no subscales n No new items n 2
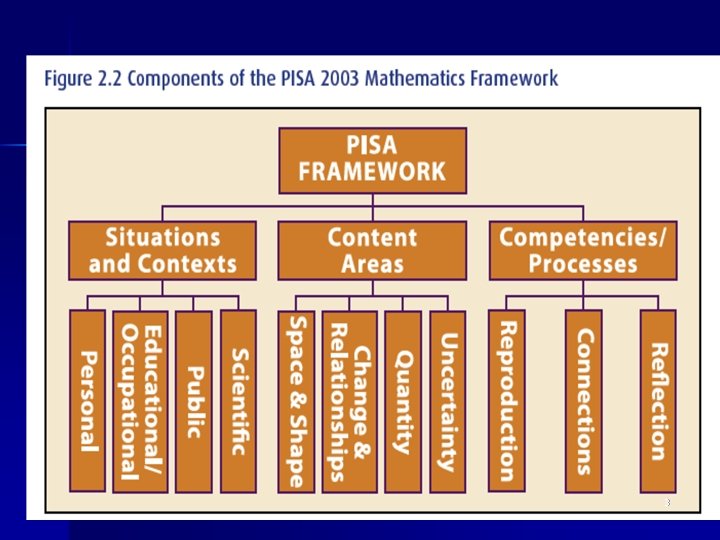
3
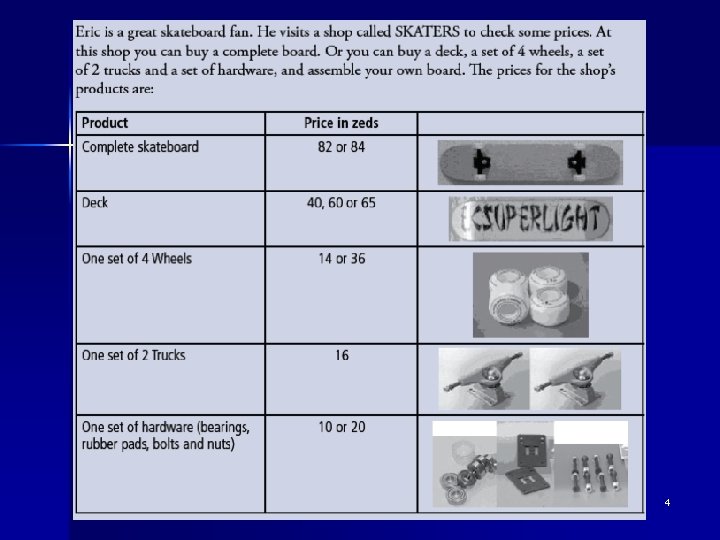
4
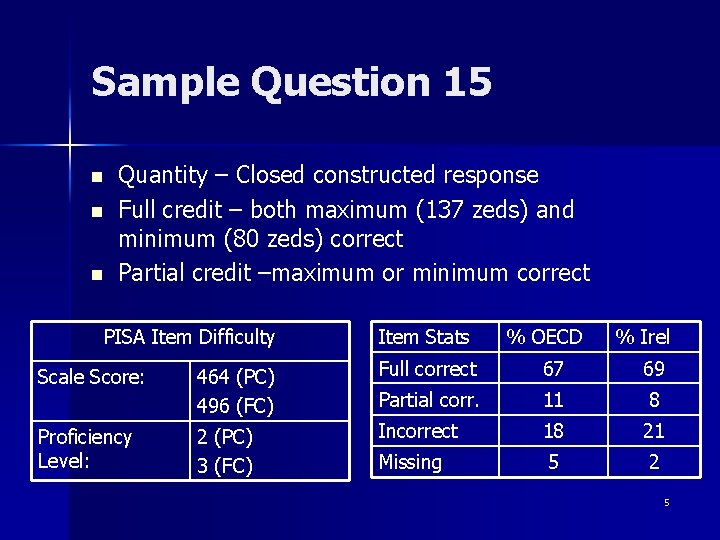
Sample Question 15 n n n Quantity – Closed constructed response Full credit – both maximum (137 zeds) and minimum (80 zeds) correct Partial credit –maximum or minimum correct PISA Item Difficulty Item Stats % OECD % Irel Scale Score: 464 (PC) 496 (FC) Full correct 67 69 Partial corr. 11 8 Proficiency Level: 2 (PC) 3 (FC) Incorrect 18 21 Missing 5 2 5
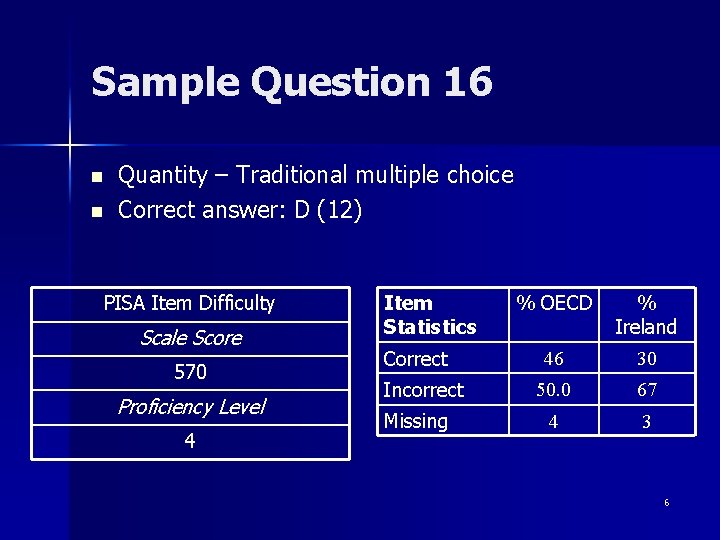
Sample Question 16 n n Quantity – Traditional multiple choice Correct answer: D (12) PISA Item Difficulty Scale Score 570 Proficiency Level 4 Item Statistics Correct Incorrect Missing % OECD 46 % Ireland 30 50. 0 67 4 3 6
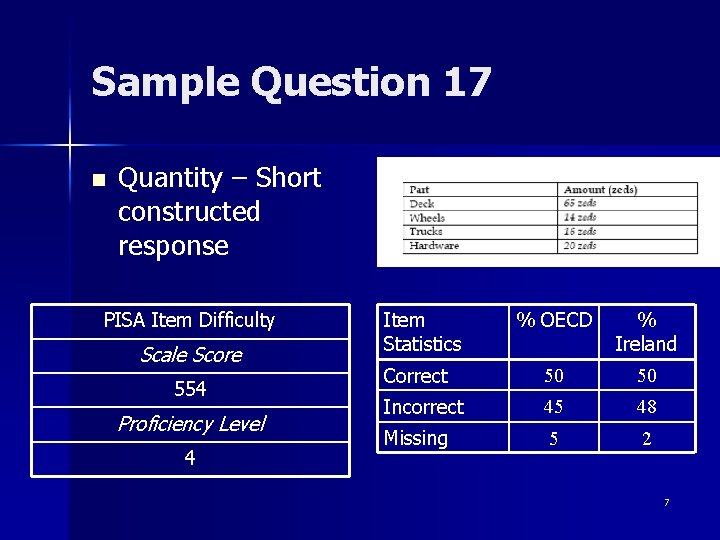
Sample Question 17 n Quantity – Short constructed response PISA Item Difficulty Scale Score 554 Proficiency Level 4 Item Statistics % OECD Correct 50 % Ireland 50 Incorrect 45 48 Missing 5 2 7
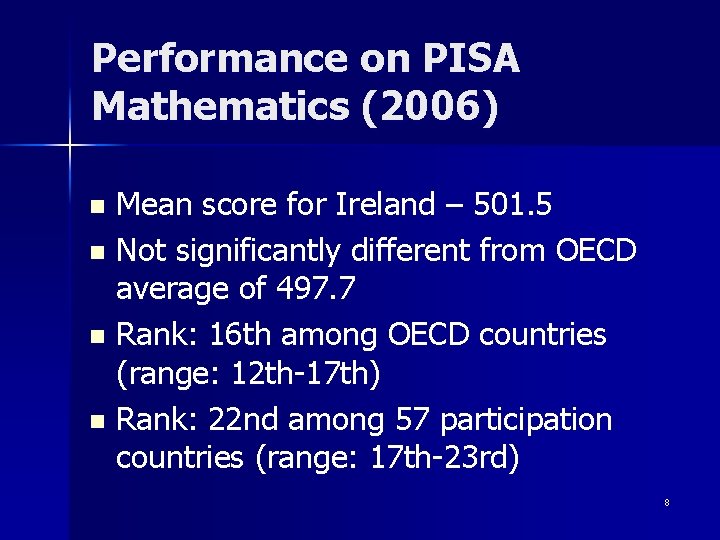
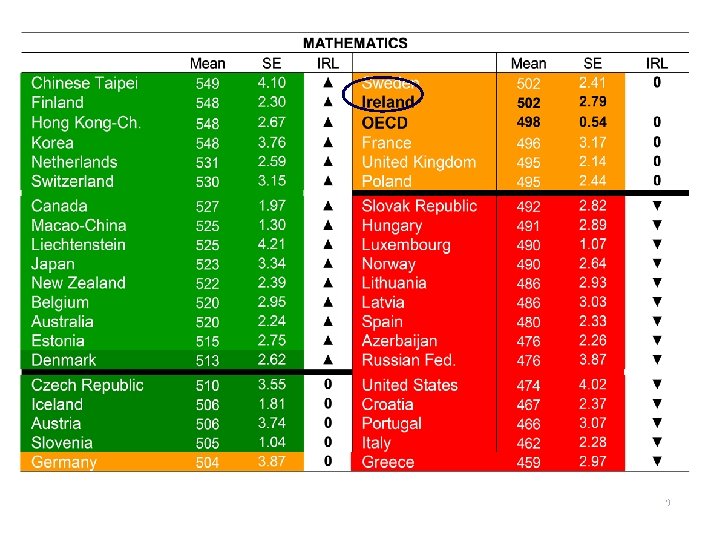
Performance on PISA Mathematics (2006) Mean score for Ireland – 501. 5 n Not significantly different from OECD average of 497. 7 n Rank: 16 th among OECD countries (range: 12 th-17 th) n Rank: 22 nd among 57 participation countries (range: 17 th-23 rd) n 8
9
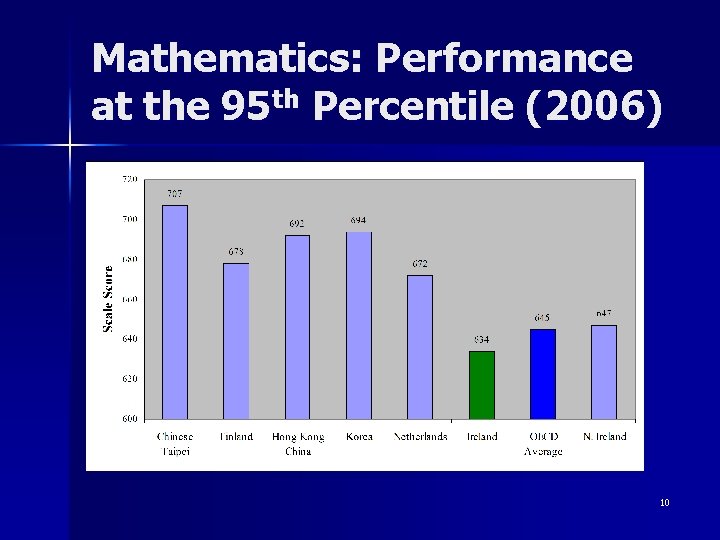
Mathematics: Performance at the 95 th Percentile (2006) 10
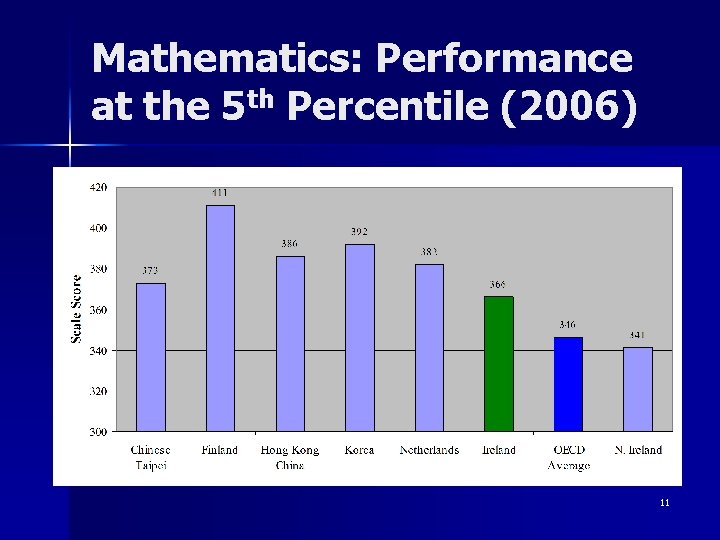
Mathematics: Performance at the 5 th Percentile (2006) 11
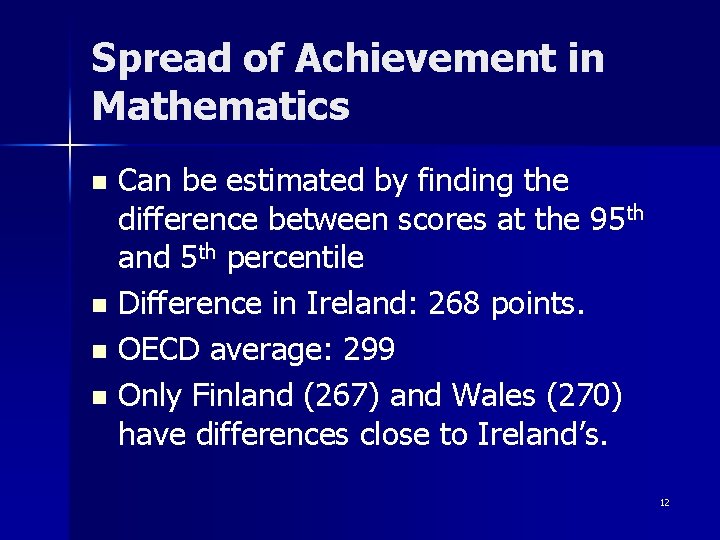
Spread of Achievement in Mathematics Can be estimated by finding the difference between scores at the 95 th and 5 th percentile n Difference in Ireland: 268 points. n OECD average: 299 n Only Finland (267) and Wales (270) have differences close to Ireland’s. n 12
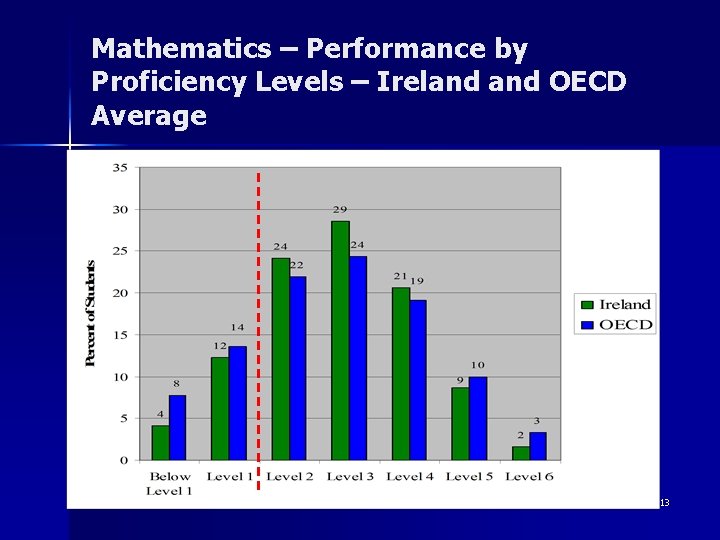
Mathematics – Performance by Proficiency Levels – Ireland OECD Average 13
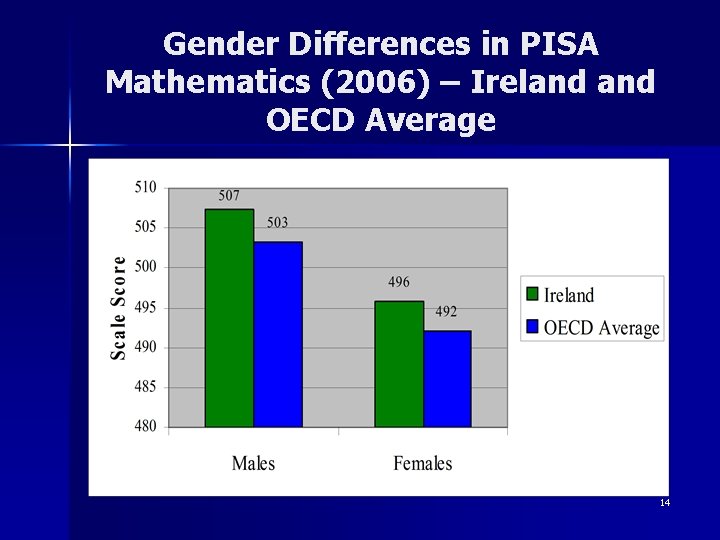
Gender Differences in PISA Mathematics (2006) – Ireland OECD Average 14
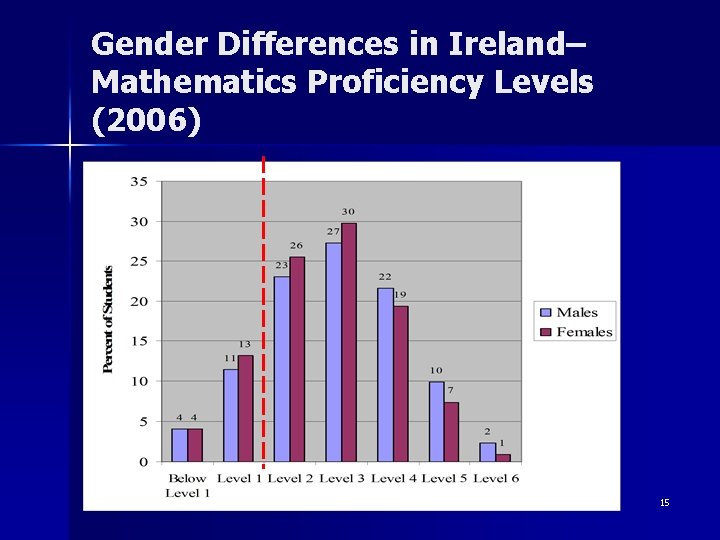
Gender Differences in Ireland– Mathematics Proficiency Levels (2006) 15
Explaining Gender Differences in Mathematics n n n Structure of test (e. g. , impact of Space & Shape items) Item type (multiple-choice vs. constructed response) Nature of the PISA mathematics tasks Contrast with Junior Certificate examination where females achieve more A and B grades in mathematics at higher and ordinary levels Presentation by Seán Close this afternoon to examine gender differences in detail. 16
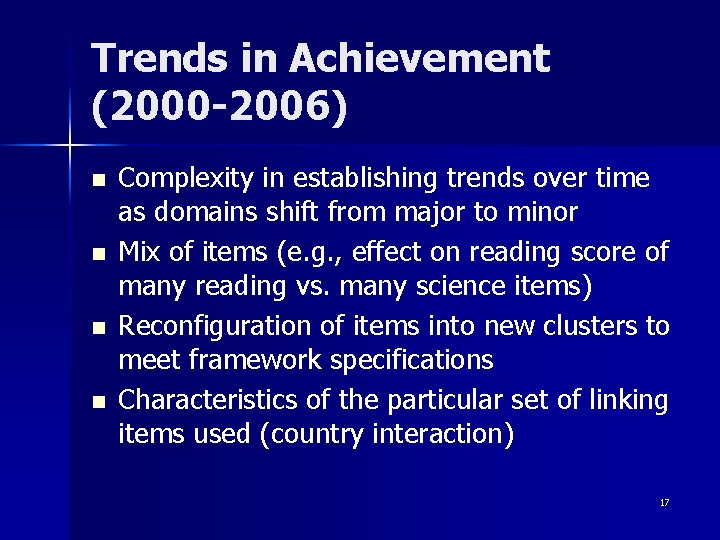
Trends in Achievement (2000 -2006) n n Complexity in establishing trends over time as domains shift from major to minor Mix of items (e. g. , effect on reading score of many reading vs. many science items) Reconfiguration of items into new clusters to meet framework specifications Characteristics of the particular set of linking items used (country interaction) 17
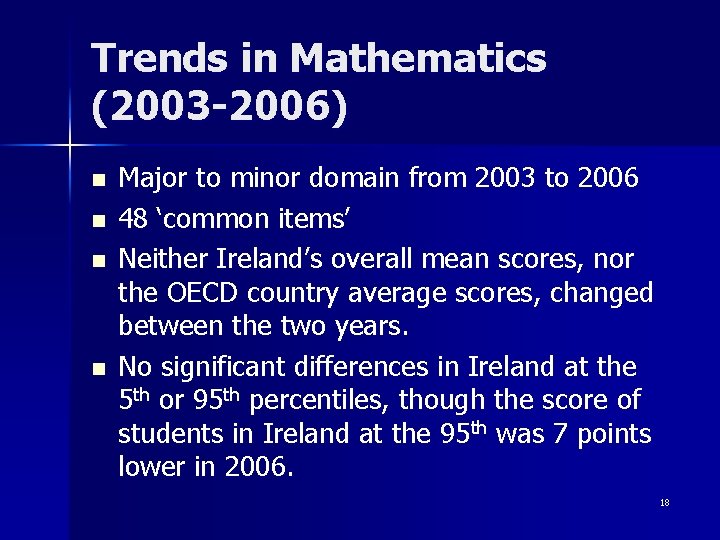
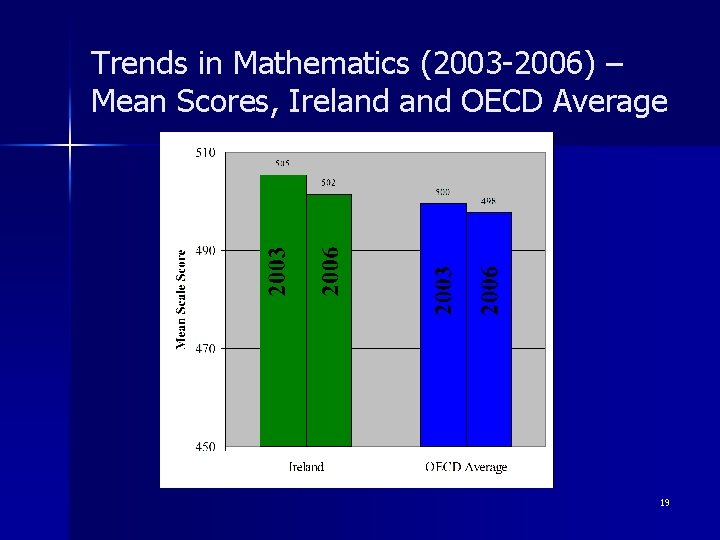
Trends in Mathematics (2003 -2006) n n Major to minor domain from 2003 to 2006 48 ‘common items’ Neither Ireland’s overall mean scores, nor the OECD country average scores, changed between the two years. No significant differences in Ireland at the 5 th or 95 th percentiles, though the score of students in Ireland at the 95 th was 7 points lower in 2006. 18
Trends in Mathematics (2003 -2006) – Mean Scores, Ireland OECD Average 19
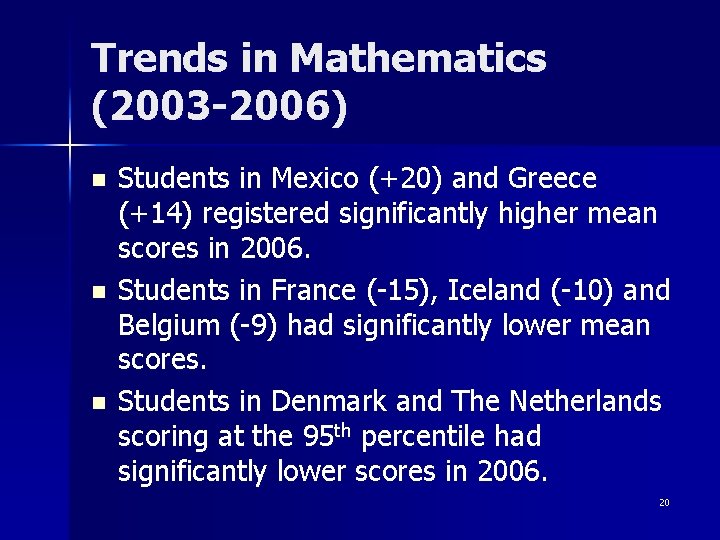
Trends in Mathematics (2003 -2006) n n n Students in Mexico (+20) and Greece (+14) registered significantly higher mean scores in 2006. Students in France (-15), Iceland (-10) and Belgium (-9) had significantly lower mean scores. Students in Denmark and The Netherlands scoring at the 95 th percentile had significantly lower scores in 2006. 20
PISA Reading Literacy Major domain in PISA 2000 (141 items) n Minor domain in PISA 2003/2006 (28 items) n Overall scale in 2006; overall proficiency levels, but no subscales n Items drawn from 3 reading processes: retrieve (25%), interpret (50%), and reflect/evaluate (25%) n No new items n 21
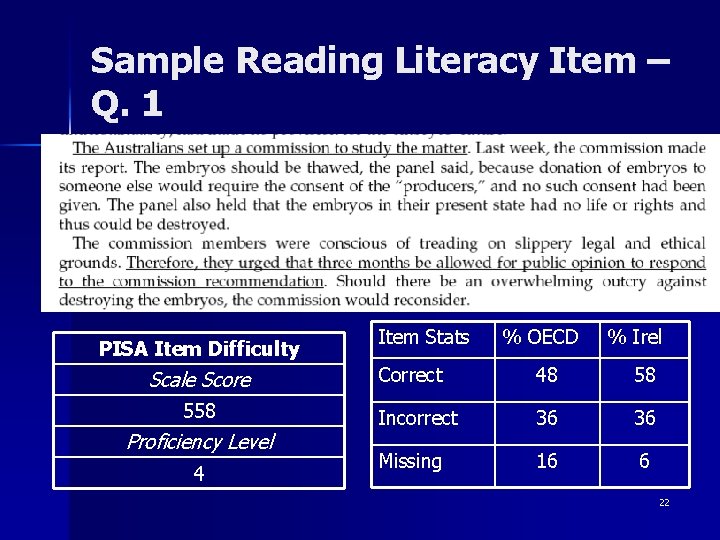
Sample Reading Literacy Item – Q. 1 PISA Item Difficulty Scale Score 558 Proficiency Level 4 Item Stats % OECD % Irel Correct 48 58 Incorrect 36 36 Missing 16 6 22
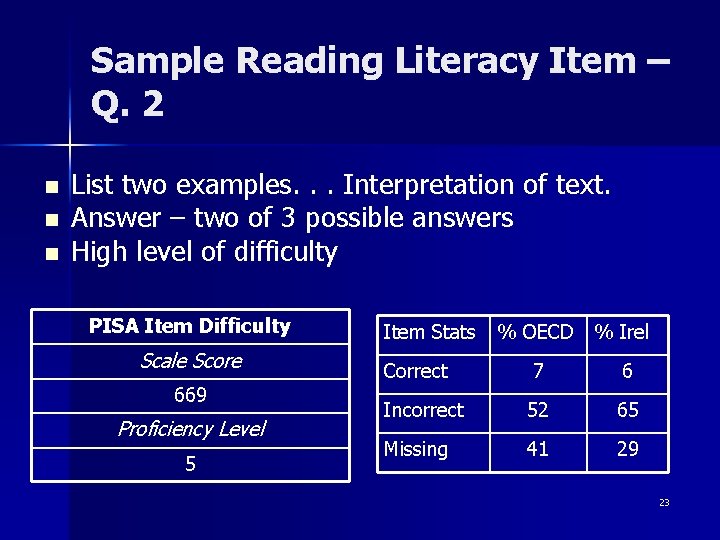
Sample Reading Literacy Item – Q. 2 n n n List two examples. . . Interpretation of text. Answer – two of 3 possible answers High level of difficulty PISA Item Difficulty Scale Score 669 Proficiency Level 5 Item Stats % OECD % Irel Correct 7 6 Incorrect 52 65 Missing 41 29 23
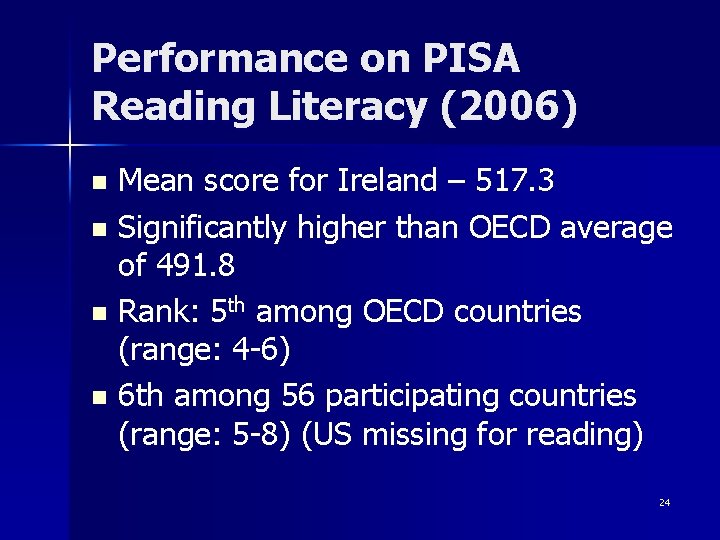
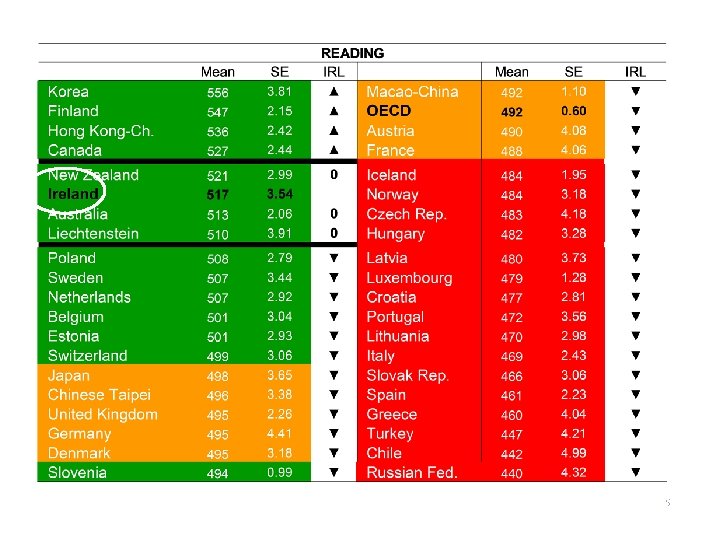
Performance on PISA Reading Literacy (2006) Mean score for Ireland – 517. 3 n Significantly higher than OECD average of 491. 8 n Rank: 5 th among OECD countries (range: 4 -6) n 6 th among 56 participating countries (range: 5 -8) (US missing for reading) n 24
25
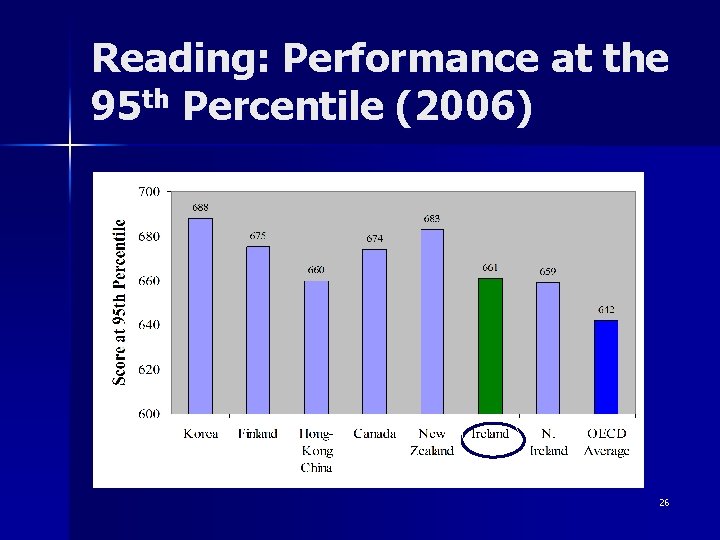
Reading: Performance at the 95 th Percentile (2006) 26
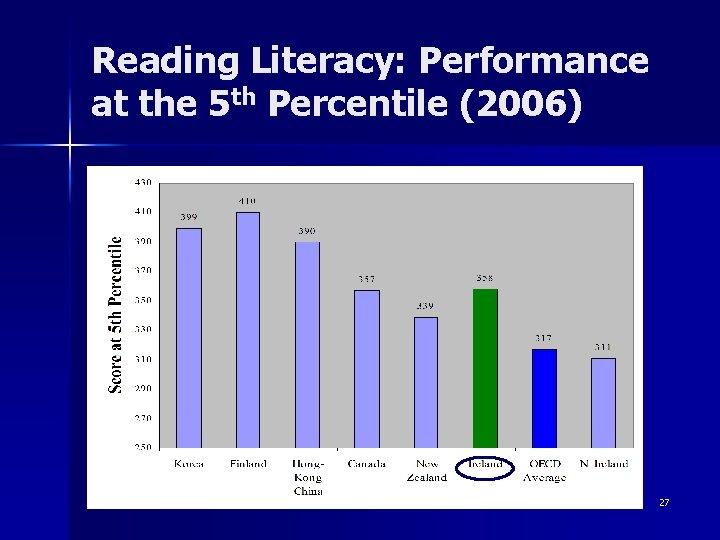
Reading Literacy: Performance at the 5 th Percentile (2006) 27
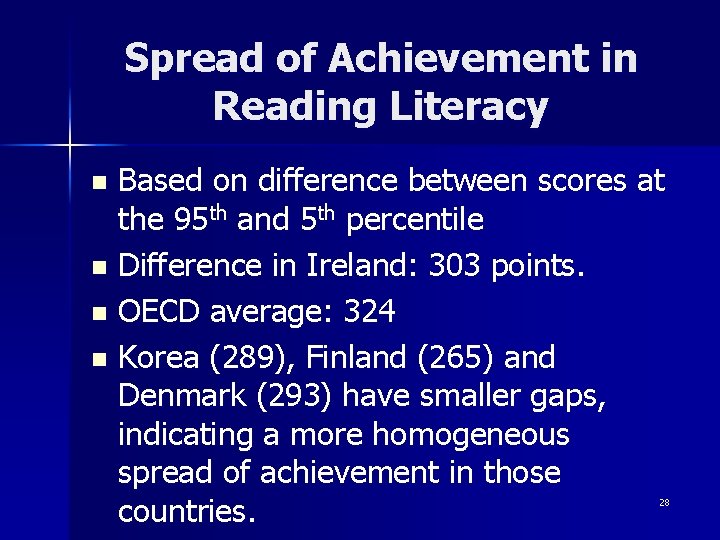
Spread of Achievement in Reading Literacy Based on difference between scores at the 95 th and 5 th percentile n Difference in Ireland: 303 points. n OECD average: 324 n Korea (289), Finland (265) and Denmark (293) have smaller gaps, indicating a more homogeneous spread of achievement in those countries. n 28
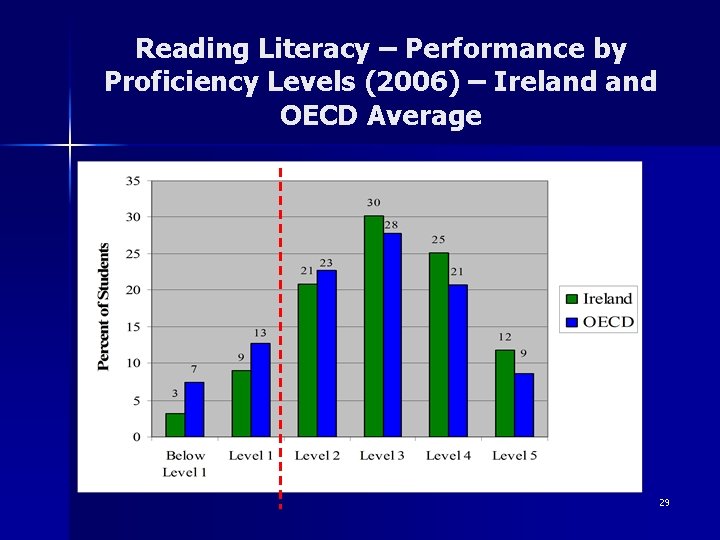
Reading Literacy – Performance by Proficiency Levels (2006) – Ireland OECD Average 29
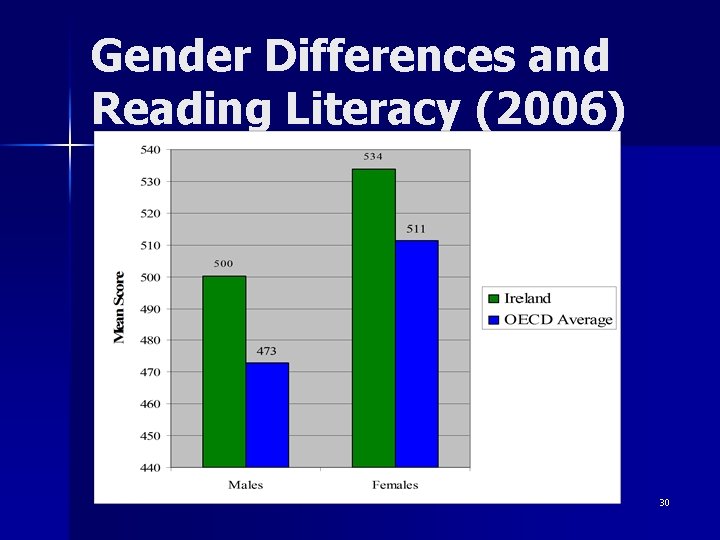
Gender Differences and Reading Literacy (2006) 30
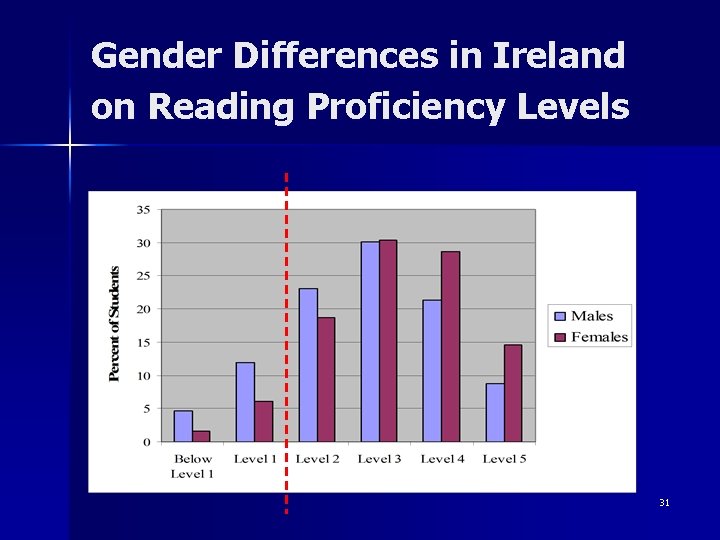
Gender Differences in Ireland on Reading Proficiency Levels 31
Explanation of Gender Differences in Reading Literacy n n Emphasis on text type (continuous vs. noncontinuous) Item type (multiple-choice vs. constructed response) Reading process (retrieve, interpret, reflect/evaluate) Presentation by Brian Murphy this afternoon will examine differences in more detail 32
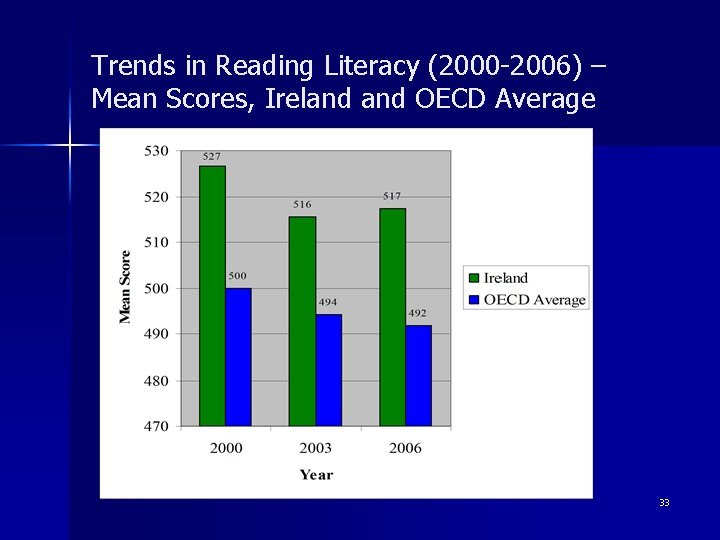
Trends in Reading Literacy (2000 -2006) – Mean Scores, Ireland OECD Average 33
Trends in Reading Literacy (2000 -2006) – Mean Scores n n n Korea’s mean score increased by 31 points between 2000 and 2006 Poland’s mean score increased by 29 points between the same years. Significant declines in mean reading scores in Australia (-15), France (-17), Greece ( -14), Iceland (-22), Italy (-19), Japan (24), Norway (-21), and Spain (-32). 34
Trends in Reading Literacy (2000 -2006) – Performance at Key Benchmarks n n n Significant (22 point) drop in performance of students in Ireland at 95 th percentile in 2003 (relative to 2000), though some of the difference (14 points) was made up in 2006 No significant differences at 5 th percentile. More comprehensive trend data for reading literacy in 2009, when it becomes a major domain again - the first time a major domain is repeated in PISA. 35
Trends in Science Performance (2000 -2006) n n n Difficulty in developing trend data going from minor domain Decline in performance on link items in Ireland between 2003 and 2006, but difference not significant. Significant increases in Mexico (+22. 7) and Greece (20. 5) and a drop in France (-16) Ireland performed at about the same level on all three assessments to date – comfortably above the OECD average in 2000, and just above it in 2003 and 2006. 36
37
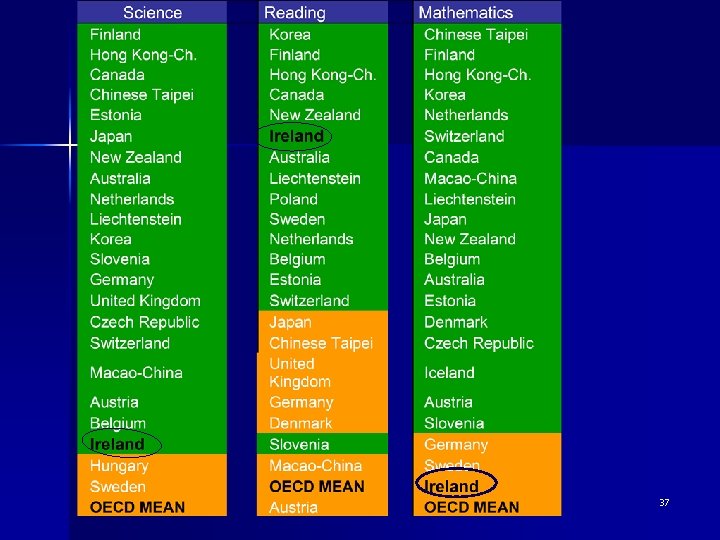
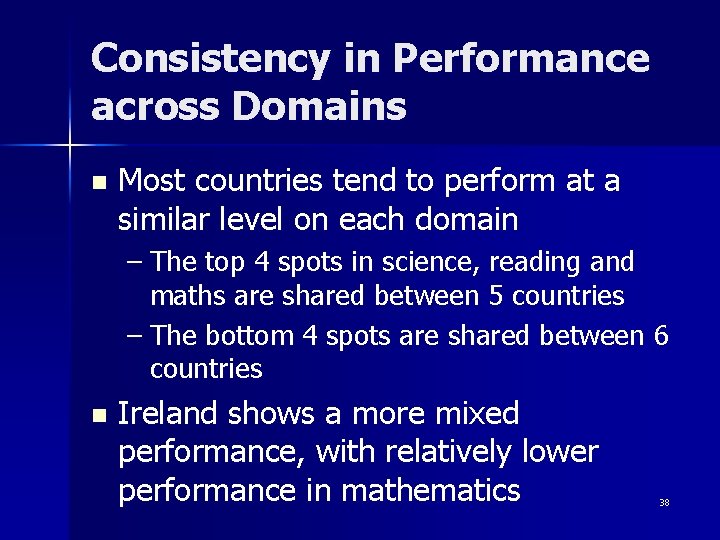
Consistency in Performance across Domains n Most countries tend to perform at a similar level on each domain – The top 4 spots in science, reading and maths are shared between 5 countries – The bottom 4 spots are shared between 6 countries n Ireland shows a more mixed performance, with relatively lower performance in mathematics 38