Macroecono mic Objectiv e Equity in In come

Macroecono mic Objectiv e: Equity in In come Distribution Chapter 16

Equality vs. Equity in the distribution of income v Equity refers to the fairness in economics, while equality means minimizing the disparities in income and wealth among a nation’s households. v. Equity requires a level playing field on which individuals in society can all have a fair shot at achieving economic success. v. Equity ultimately promotes greater equality in income distribution.

Minimizing disparities Fairness

Wealth inequality Ø http: //www. youtube. com/watch? v=QPKKQnijns. M

Unequal distribution Ø One of the characteristics of a free market is unequal distribution of income ØSome people will earn more than others and therefore be in a position to consume/demand more ØThere is an argument to say that large inequalities are unfair ØPeople on low incomes will experience relatively low living standards and will have fewer opportunities ØIn developing countries they may live in relative poverty

Economic incentives u Unequal distribution of income is seen as unfair…but u People need an incentive to work hard u They will work harder to gain higher incomes u If the incentive was not there people may not work hard in school and in work u Human capital would not improve having huge implications on the supply side of the economy u How much inequality is allowed is a value/normative judgement u Governments try to bring about equity rather than equality so that they do not destroy the incentive to work harder

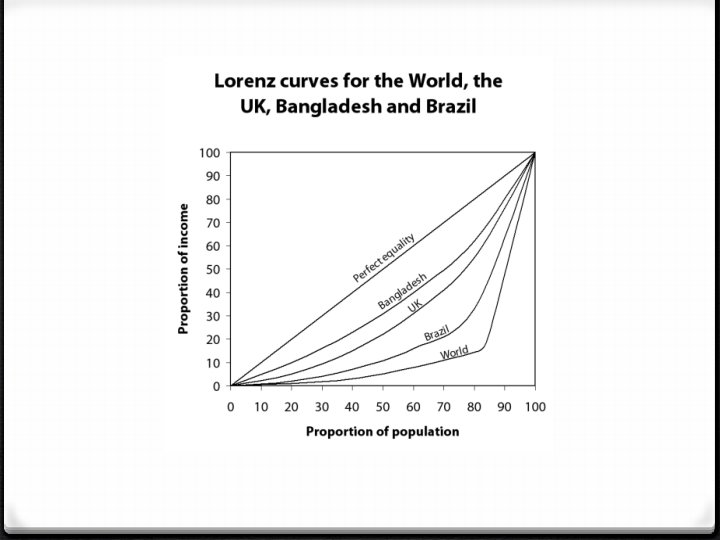
Measuring the distribution of income ü A method of measuring and illustrating the degree of inequality in the distribution of income and wealth is the LORENZ CURVE ü Horizontal axis measures the cumulative percentage of the Population ü Vertical axis measures percentage of income ü The 45 degree line is the line of perfect equality (50% of the population would have 50% of the income) ü The actual share of income is shown by the curve (the Lorenz curve)) ü The greater the degree of inequality the further the curve will be from the 45 degree line

Measuring the distribution of income üA statistical measure of the degree of inequality shown on a Lorenz curve is known as the GINI COEFFICIENT üIt is the ratio of the area between the line and the curve and the total area beneath the 45 degree line [a / (a+b)] üPerfect equality would give a ratio of zero and perfect inequality would give 1 üThe closer to 1 the more unequal the distribution of income

Gini Index Ø Is an economic indicator of the level of income distribution in a nation Ø It is expressed as a number between 0 and 100 (Gini coefficient times 100) Ø The closer the index to 100, the greater the disparity between the richest and poorest households in a nation Ø The closer to zero, the more equally income is distributed across the nation’s households

Gini coefficient data for the UK Year Gross Income Disposable Income 1980 0. 34 0. 28 1990 0. 38 0. 36 2003 0. 37 0. 33 Ø The table shows Gini coefficient data for the UK from 1980 to 2003 for both gross income and disposable income Ø Gross income is before tax Ø Disposable income is what you are left with to spend Ø What do the numbers show? Ø Tax reduces Gini coefficient – makes income distribution more equitable Ø In 1980, tax helped reduce the inequality more than in 1990 and 2003

Ted Talk: “Rich people don’t create jobs” Ø http: //www. youtube. com/watch? v=i. Ih. OXCg. Sunc

How economic inequality harms society Ø http: //www. youtube. com/watch? v=AFOEe 6 M 2 VT 4

Indicators of poverty Ø What does it mean to be poor? Ø Poverty exists everywhere Ø Higher-income contries => relative poverty Ø Poorest countries => absolute poverty

Relative vs. Absolute Poverty § Relative Poverty Ø condition experienced by people in a country whose incomes are considerably lower than the higher income groups in the same country Ø it exists even in the world’s richest countries § Absolute Poverty Ø condition experienced by individuals who cannot afford to acquire the basic necessities for a healthy and safe existence Ø Does not exist everywhere, it is primarily concentrated across the 60% poorest countries of the world

Possible Causes of Poverty v Low income v Unemployment v Lack of human capital

Reasons for low income u Incomes may be low and people may live in poverty because…. ² They were born into a household where income is low ² They may have received poor, or no education ² They may have had poor health care and malnutrition ² They may have had to go out to work before completing an education u The consequence of poverty include ² Low living standards ² Lack of access to sufficient health care ² Low levels of education u The consequences lead to low levels of human capital u. If people have poor education and health care, they will find it difficult to find work or it may be low paid

Evaluation v. It is important to be careful when using the Gini index numbers to evaluate a country’s development progress v. Although low income countries tend to have higher levels of inequality than high income countries there is no hard and fast correlation between the level of development and its Gini index v. It is also not correct to assume that having more equality will raise living standards v. If poorest 20% of the population earns 3% of the national income and the national income rises and the income distribution remains the same – the poorest will receive a larger amount (the cake got bigger but their percentage share remained)

Improving inequality of income with taxation ØTax can be used to improve income inequality ØThere are 2 different types of tax ²DIRECT taxes ²INDIRECT taxes

Direct Taxes Ø Taxes imposed on people’s income or wealth and on firm’s profit Ø Taxes that are paid directly to the government by those on whom they are imposed Ø Example: Income tax and Corporation tax Ø Unavoidable because individuals and firms have to declare their full income

Indirect Taxes Ø Taxes paid by households through an intermediary such as a retail store Ø The intermediary then pays the government Ø Possibly avoidable – you can choose not to buy the goods and services

Types of Taxation Systems v Proportional Tax v Regressive Tax v Progressive Tax

Proportional Tax Ø A tax for which the percentage remains constant as income increases Ø Many countries are now promoting the idea of proportional direct taxes or flat taxes Ø The same percentage tax is paid at all levels of income

Regressive Tax ØTax that decreases in percentage as income increases ØSuch a tax places a larger burden on lower income household than it does on higher income earners since a greater percentage of a poor household’s income is used to pay the tax than a rich household’s ØMost indirect taxes are regressive

Regressive Tax Income of buyer $ Amount of tax paid $ % of income taxed 10, 000 1% 50, 000 100 0. 2% 100, 000 100 0. 1% Ø The higher-income consumer pays the same amount of tax as the lower-income consumer Ø Although they appear to be equitable since everyone pays the same percentage of the price of the goods they consume, placing a larger burden on those whose ability to pay is lower and a smaller burden on the higher-income earners whose ability to pay is greater Ø Regressive taxes may be a good source of government revenue and might discourage the consumption of demerit goods but they can worsen income inequality

Progressive Tax ØThis is a tax for which the percentage paid in tax increases as income increases ØIs the most equitable of the 3 types of taxes a government collects ØLower income households not only pay less tax, but they pay a smaller percentage of their income in tax as well ØThis is a hypothetical example where there are 4 tax brackets Taxable Income ($) % to be paid as tax 0 – 10, 000 0 10, 001 – 25, 000 30% 25, 001 – 50, 000 40% 50, 001 and higher 50%

Progressive Tax If someone earns $56, 000 they will pay the following tax: Ø For the first $10, 000 = 0 Ø For the next $15, 000 = 4. 5 k (15 k x. 30) Ø For the next $25, 000 = 10 k (25 k x. 40) Ø For the next $6, 000 = 3 k (6 k x. 50) Ø In total they would pay = 17, 500 Ø On average they would be paying 31% tax (17, 500 / 56, 000)

Progressive Taxation Exercise How much tax would they pay and what is their average tax rate if they earned: a) $7, 000 b) $14, 000 c) $28, 000 d) $77, 000 Taxable Income ($) % to be paid as tax 0 – 10, 000 0 10, 001 – 25, 000 30% 25, 001 – 50, 000 40% 50, 001 and higher 50%

Tax Calculation – HL only ØThere are 2 types of calculations you could be asked to perform ØThe average tax rate = total tax paid divided by income x 100 ØThe marginal tax rate = change in total tax paid divided by change in income x 100

Progressive Taxation Exercise ØA person earning $56 k paid an average tax rate of 31% ØIf the same person’s salary went up to $63 k the total tax paid would be = 0 + 4. 5 + 10 + 6. 5 = $21 k ØOriginally they paid $17. 5 k ØThe marginal tax rate = (21 – 17. 5) / (63 – 56) = 50% Taxable Income ($) % to be paid as tax 0 – 10, 000 0 10, 001 – 25, 000 30% 25, 001 – 50, 000 40% 50, 001 and higher 50%

Progressive Tax ØArguments for a progressive income tax ²Provides governments with an effective means of redistributing the nation’s income because those with the greatest ability to pay (the rich) provide the nation with far more of its revenue than those with the least ability to pay (the poor). ØArguments against progressive income tax ²Further increases in the tax rate are believed to lead to a decline in the amount of taxable income due to the disincentive created by the higher tax rate.

Comparing Income Tax Systems

Other measures to promote equality ØRole of government: provision of public goods ²Government provides education and health ØRole of government: transfer payments ²Unemployment benefits ²Social security benefits ²Nutritional subsidies ²Higher education grants and tuition subsidies ²Welfare benefits
- Slides: 33