
Machine Learning in Finance ISB presentation Claudio Moni

Machine Learning in Finance ISB presentation Claudio Moni 25/03/2010
Main applications • Forecasting financial time series to identify trading opportunities. • Estimating assets distributions, for trading and risk-management. • Derivatives pricing (small)
Forecasting • Difficult! • High level of noise in financial time series. • Suppose we want to estimate the equity market (annualised) return, which is of the order of 5%, with a +-5% confidence interval. How many years of daily data do we need, assuming historical volatility is 20%? 64 years! • Situation improves at high frequencies, as more data are available.
Forecasting • Difficult! • High level of noise in financial time series. • Suppose we want to estimate the equity market (annualised) return, which is of the order of 5%, with a +-5% confidence interval. How many years of daily data do we need, assuming historical volatility is 20%? 64 years! • Situation improves at high frequencies, as more data are available.
Forecasting • Difficult! • High level of noise in financial time series. • Suppose we want to estimate the equity market (annualised) return, which is of the order of 5%, with a +-5% confidence interval. How many years of daily data do we need, assuming historical volatility is 20%? 64 years! • Situation improves at high frequencies, as more data are available.
Forecasting 2 • Financial time series are non-stationary. • Business cycles. • Small disjuncts alternative. • We can try to forecast an asset in isolation or a set of interrelated assets all.
Regression vs. Classification • Financial forecasting is (usually) a regression problem. • It is not enough to know that the expected return from a financial bet is positive to decide to make it and to decide how much to bet. • It makes financial sense to invest more in the most profitable opportunities (see Kelly criterion) • This applies to a single strategy across time, or when the strategy is part of a portfolio.
Technical Analysis • Set of standard trading rules, mainly based on graphical patterns. • No theoretical justification. • Usually not thoroughly back-tested. • Can become self-fulfilling prophecies. • TA rules are often used as building blocks for Machine Learning systems.
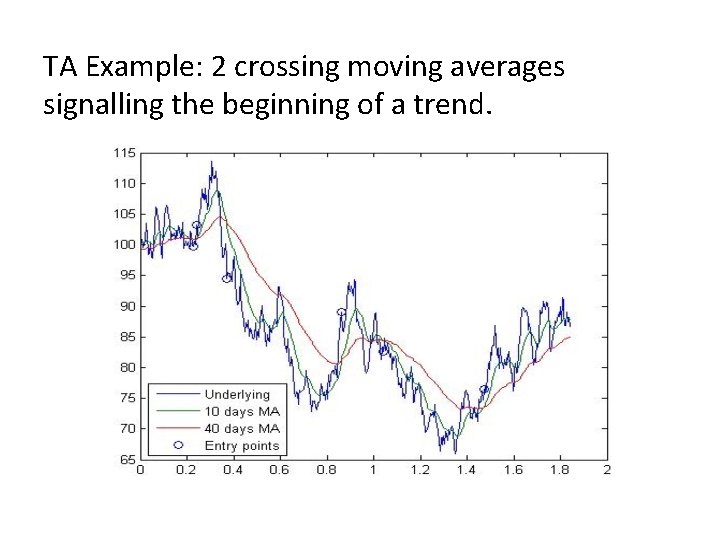
TA Example: 2 crossing moving averages signalling the beginning of a trend.
Empirical approach • Instead of estimating the dynamics of the underlying processes and then construct strategies exploiting these dynamics, estimate the trading strategies directly. • Metric: trading performance, usually measured by the Sharpe ratio = mean/stdev. • Robust with respect to process misspecification.
Quantization • Often useful to turn a continuous process into a discrete one. • Subdivide R into a set of intervals, user defined or obtained by clustering. • Limit case for returns: {Ret<0, Ret>=0}. • Reduces noise but throws away information. • Allows Markov chains models to be used.
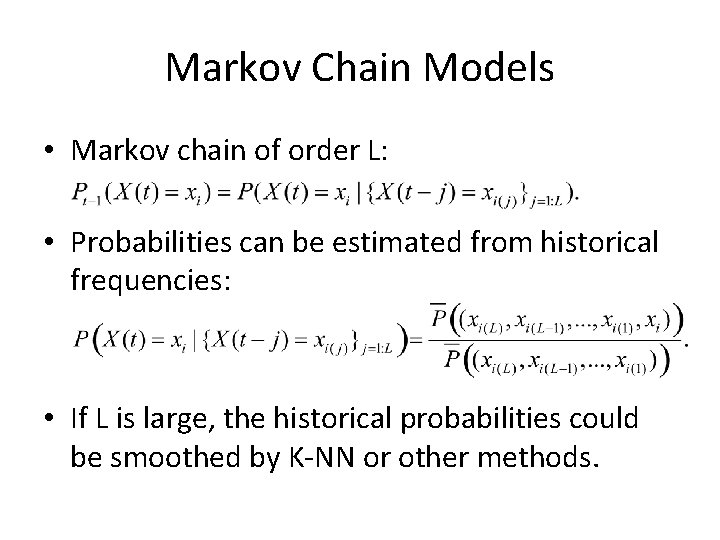
Markov Chain Models • Markov chain of order L: • Probabilities can be estimated from historical frequencies: • If L is large, the historical probabilities could be smoothed by K-NN or other methods.
Evolutionary approaches • The empirical strategy selection can be very naturally generated through evolution. • Fitness: trading performance. • Mutation: small parameter changes. • Crossover: combination of parts of different strategies. For example (S 1, S 2) = [A*and(B, C), D*and(E, F)] -> (S 3, S 4) = [A*and(B, F), D*and(E, C)].
Neural Networks • Non-linear regression. • The independent variables can be given by the underlying process (e. g. daily returns), or more commonly by a set of trading signals generated by user defined trading rules. • Has been found to generate positive trading results, although not necessarily better than those obtained by using simpler models.
News mining • News are part of the information available to human traders. • Machines need to be able to use this source of information too. • Natural Language Processing. • News classification, Bag of words, SVM. • Useful to human traders too, to filter incoming news by relevance.
Reinforcement Learning • Can be used for game-theoretic problems. • Optimal trade execution, to minimize market impact. • Often large numbers of shares need to be bought (or sold), and the trade has to be split in a number of smaller trades since not enough shares are for sale at a given moment in time, or not a good price. Need to hide our intentions to prevent price from rising.
Estimating assets distributions • Standard statistical techniques. • Filtering. • Dimensionality reduction.
Filtering • Hidden variable models. • Example 1: Stochastic volatility models. • Example 2: Factor models. Some factors may not be observable or observable only at discrete times. E. g. Interest rates, inflation, GDP, . . . • Kalman Filter. Extended KF, Unscented KF. • Particle Filtering.
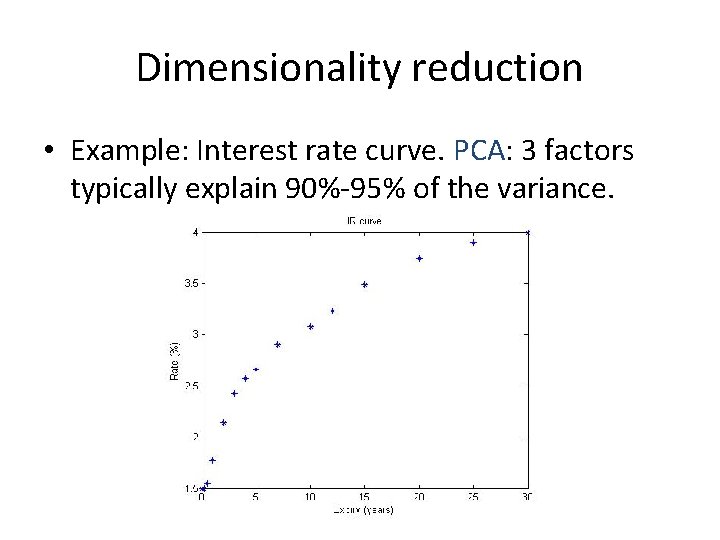
Dimensionality reduction • Example: Interest rate curve. PCA: 3 factors typically explain 90%-95% of the variance.
Derivatives pricing • Small area of application for ML since here we work with risk-neutral probabilities instead of historical ones. • One main application: approximation of American style option by parametric functions of the state variables, through regression. • Monte Carlo simulation, Local Least Squares.

Questions?
References • [AD 09] Adamu, K. (2009) Modelling Financial Time Series using Grammatical Evolution. Talk given at the AMLCF 2009 conference, London. http: //videolectures. net/amlcf 09_london/ • [AL 10] Aldridge, I. (2010) High Frequency Trading. John Wiley and Sons. • [AE 01] Alexander, C. (2001) Market Models. John Wiley and Sons. • [BB 03] Boguslavsky, M. Boguslavskaya, E. (2003) Optimal Arbitrage Trading. Working paper. • [BI 06] Bishop, C. (2006) Pattern Recognition and Machine Learning. Springer. • [CH 09] Chang, E. P. (2009) Quantitative Trading. John Wiley and Sons.
• [DH 09 a] Dhar, V. (2009) Prediction in Financial Markets: The Case for Small Disjuncts. Working paper. • [DH 09 b] Dhar, V. (2009) Machine Learning Predictions in Financial Markets. Talk given at the AMLCF 2009 conference, London. http: //videolectures. net/amlcf 09_london/ • [ES 03] Eiben, A. E. Smith, J. E. (2003) Introduction to Evolutionary Computing. Springer • [FV 00] Franses, P. H. Van Dijk, D. (2000) Non-linear time series models in empirical finance. Cambridge. • [GI 07] Gifford, B. (2007) No News is Bad News. The Trade, Issue 13, July. Sept. • [HTF 08] Hastie, T. Tibshirani, R. Friedman, J. (2008) The Elements of Statistical Learning. Second Edition. Springer.
• [IV 09] Ibanez, A. Velasco, C. (2009) The Optimal Method to Price Bermudan Options by Simulation. Working paper. • [JLG 03] Javaheri, A. Laurent, D. Galli, A. (2003) Filtering in Finance. Willmot Magazine (Vol 5). • [KA 98] Kaufman, P. (1998) Trading Systems and Methods. John Wiley and Sons. • [LS 01] Longstaff, F. A. Schwartz E. S. (2001) Valuing American Options by Simulation: a Simple Least Squares Approach. Review of Financial Studies. • [LU 09] Luss, R. (2009) Predicting Abnormal Returns from News using Text Classification. Talk given at the AMLCF 2009 conference, London. http: //videolectures. net/amlcf 09_london/ • [MA 09] Mahler, N. (2009) Modelling S&P 500 Index using the Kalman Filter and the Lag. Lasso. Talk given at the AMLCF 2009 conference, London. http: //videolectures. net/amlcf 09_london/
• [NFK 06] Nevmyvaka, Y. Feng, Y. Kearns, M. (2006) Reinforcement Learning for Optimized Trade Execution. ICML. • [RA 09] Ramamoorthy, S. (2009) Multi-Strategy Trading Utilizing Market Regimes. Talk given at the AMLCF 2009 conference, London. http: //videolectures. net/amlcf 09_london/ • [TSD 01 a] Tino, P. Schittenkopf, C. , Dorffner, G. (2001) Volatility trading via Temporal Pattern Recognition in Quantized Financial Time Series. Pattern Analysis and Applications, 4(4). • [TSD 01 b] Tino, P. Schittenkopf, C. , Dorffner, G. (2001) Financial Volatility trading using Recurrent Neural Networks. IEEE Transactions on Neural Networks.
- Slides: 25